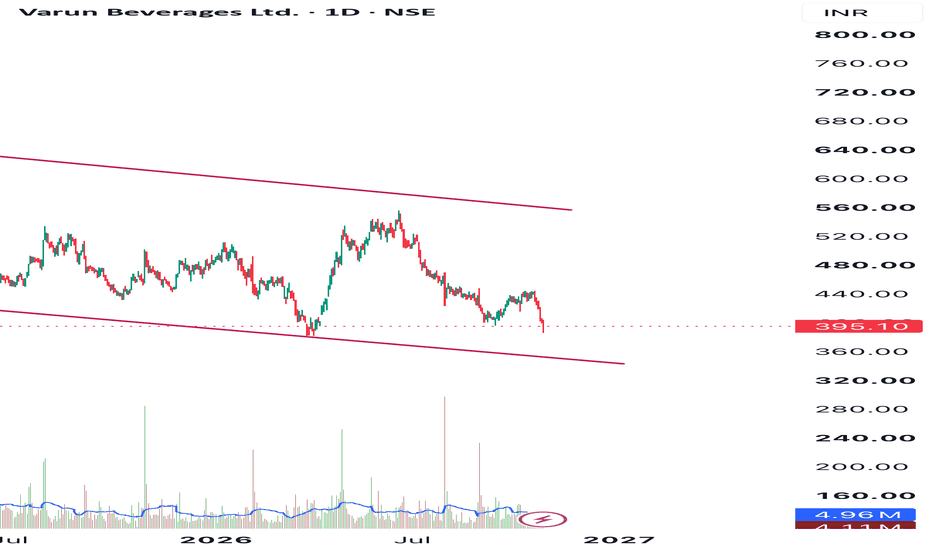
VBL trading in a channelVarun Beverages Ltd. (NSE: VBL) โ Bearish Trend Within a Descending Channel ๐
On the daily timeframe, Varun Beverages appears to be moving within a descending channel, indicating sustained bearish price action.
๐ Technical observations:
* Price has been forming lower highs and lower lows.
* The upper trendline has acted as dynamic resistance.
* Price is approaching the lower boundary of the descending channel, an important area to watch.
* A decisive daily candle close below the lower trendli
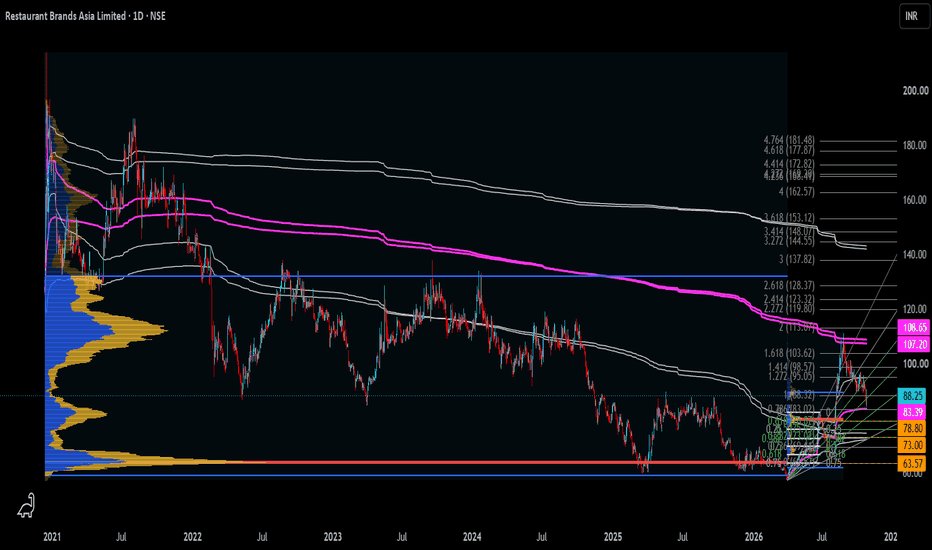
Add Restaurant Brands Asia (RBA) In Your Watchlist....Look at the price action, anchored vwap's with 1 standard deviation. For entry and exit strictly follow fib fan, volume profiles. Targets according to fib trend extension.
Levels to watch closely :- 78.8, 73, 63.57 (Zoom out the chart)
Recent Event :- October 29 Earnings Release
For better understandings get in touch @Subhrajit006
BUY TODAY SELL TOMORROW for 5%DONโT HAVE TIME TO MANAGE YOUR TRADES?
- Take BTST trades at 3:25 pm every day
- Try to exit by taking 4-7% profit of each trade
- SL can also be maintained as closing below the low of the breakout candle
Now, why do I prefer BTST over swing trades? The primary reason is that I have observed that 90% of the stocks give most of the movement in just 1-2 days and the rest of the time they either consolidate or fall
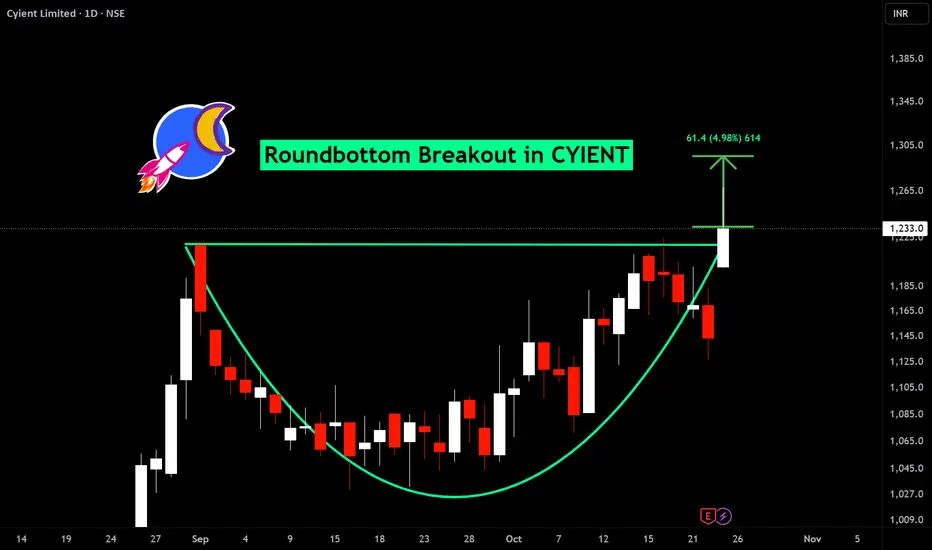
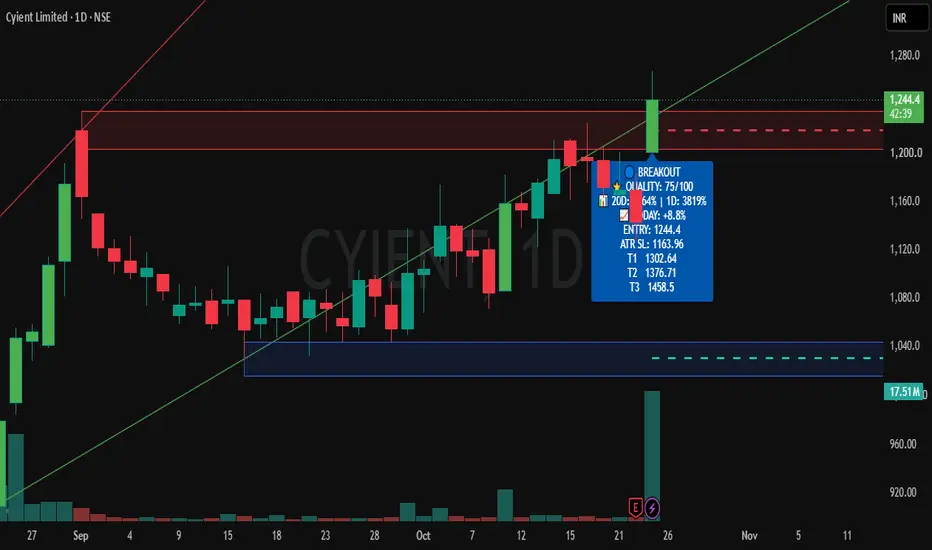
Roundbottom breakout in CYIENT
BUY TODAY SELL TOMORROW for 5%
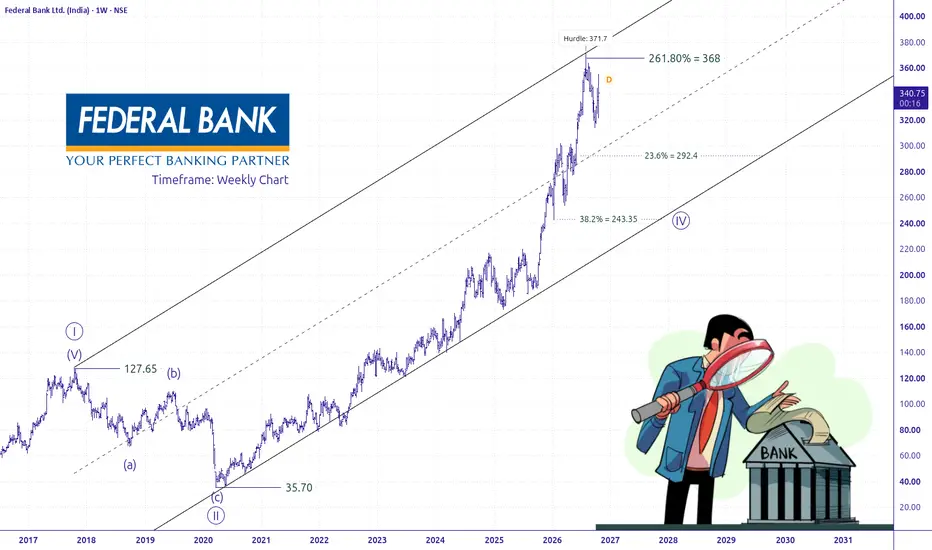
Federal Bank: Waiting for the Right Entry OpportunityNSE:FEDERALBNK is currently facing selling pressure after its sharp rally. The key level to watch is the 371.70 hurdle .
๐ Wave (III) Continuation: If the stock breaks above 371.70, the next targets are 494.95 (361.8%) and 573.40 (423.6%) .
๐ Selling Pressure Intensifies: However, if the current selling pressure increases and the stock breaks below 313.60 with a strong bearish candle and elevated selling volume, the downside levels to watch are 292.40 and 243.35 .
For now, the
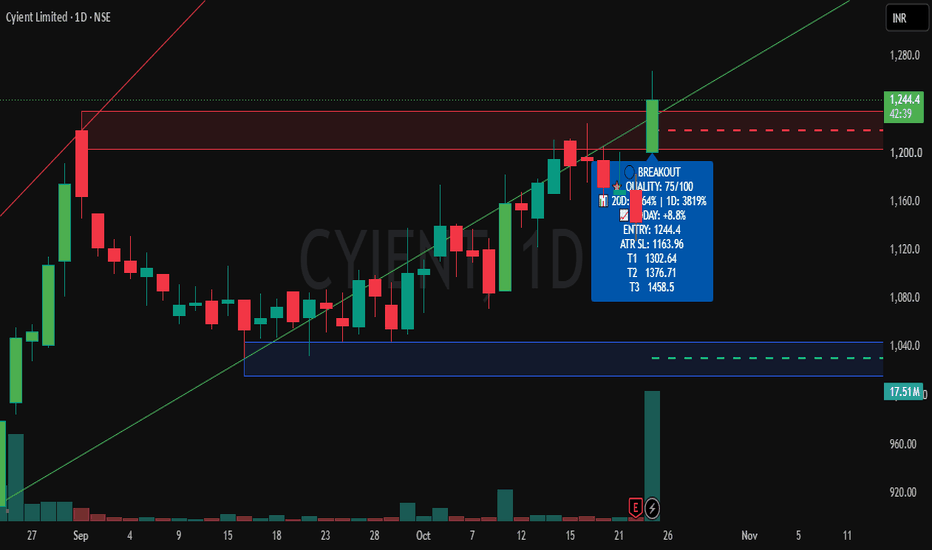
Buy Today, Sell Tomorrow for 3-5% - Daily Breakout SetupCYIENT โ BTST BREAKOUT SETUP
Entry, Stop Loss & Targets Are Clearly Defined โ Helping You Plan Your Trade With Confidence.
๐ Stock Strength: 75/100
(Note: Higher score indicates stronger stock conditions, not guaranteed returns.)
A bullish breakout has appeared on the 1D timeframe with positive price action and strong volume expansion.
๐ Trade Type: BTST
โโโโโโโโโโโโโโโโโโโโ
๐ฏ TRADE LEVELS
ENTRY: โน1248
๐ STOP LOSS
ATR SL: โน1168
๐ฏ TARGETS
3โ5%
โโโโโโโโโโโโโโโโโโโโ
๐ VOLUME
GOOD VOL.
โ
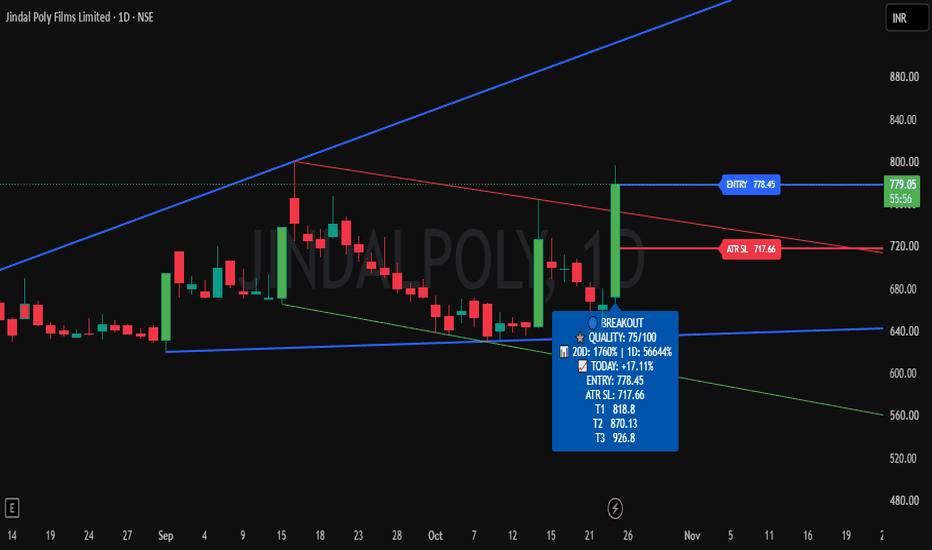
Buy Today, Sell Tomorrow for 3-5% - Daily Breakout SetupJINDALPOLY โ BTST BREAKOUT SETUP
Entry, Stop Loss & Targets Are Clearly Defined โ Helping You Plan Your Trade With Confidence.
๐ Stock Strength: 75/100
(Note: Higher score indicates stronger stock conditions, not guaranteed returns.)
A bullish breakout has appeared on the 1D timeframe with positive price action and strong volume expansion.
๐ Trade Type: BTST
โโโโโโโโโโโโโโโโโโโโ
๐ฏ TRADE LEVELS
ENTRY: โน781
๐ STOP LOSS
ATR SL: โน720
๐ฏ TARGETS
3โ5%
โโโโโโโโโโโโโโโโโโโโ
๐ VOLUME
GOOD VOLUM
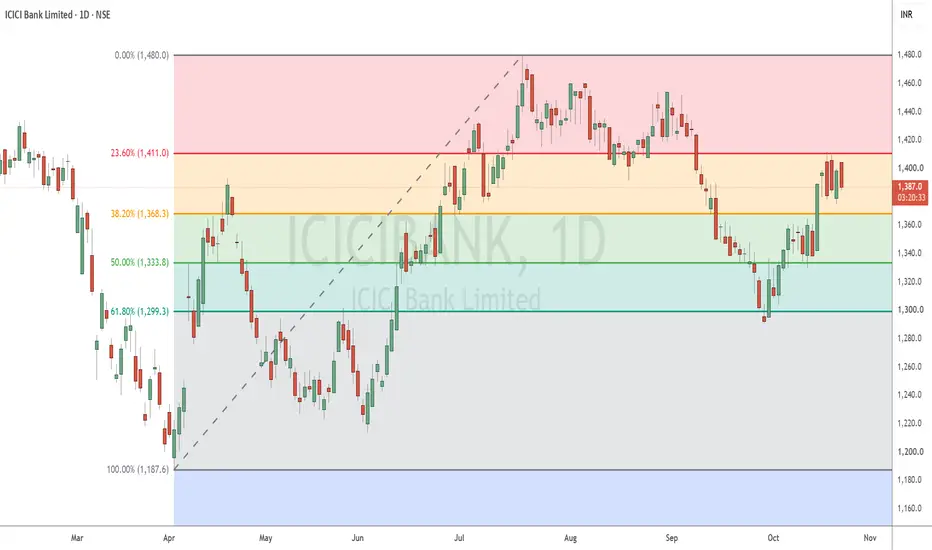
ICICI Bank Shows Positive Momentum Following Strong Q2 ResultsHighlights
ICICI Bank closed around โน1,398โโน1,400 on October 22, showing renewed buying interest following its Q2 FY27 results announced on Saturday, October 17.
Immediate resistance is around โน1,400โโน1,420. A sustained breakout above โน1,420 could push the stock towards โน1,445โโน1,480.
On the downside, โน1,375โโน1,385 is the immediate support zone, followed by stronger support around โน1,350โโน1,365. Holding these levels would preserve the positive structure.
Momentum is improving, with RSI ar
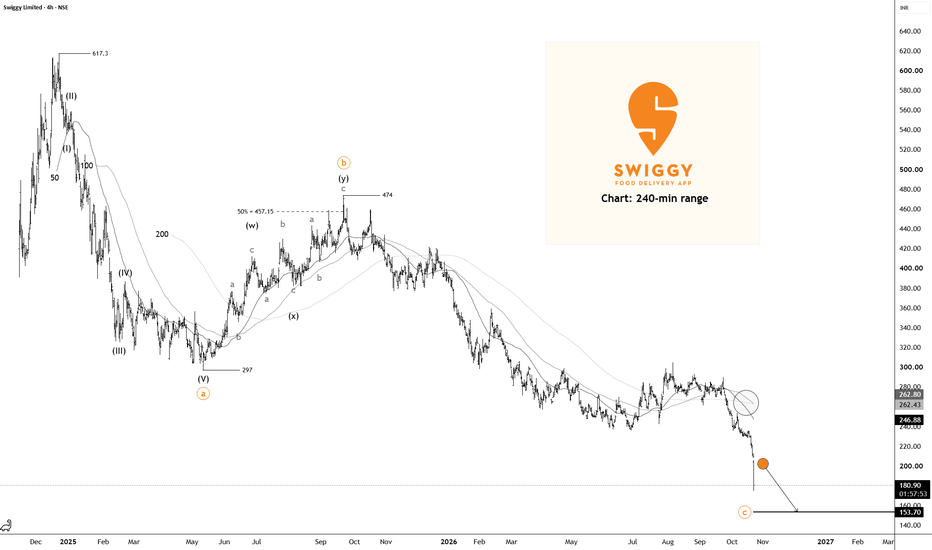
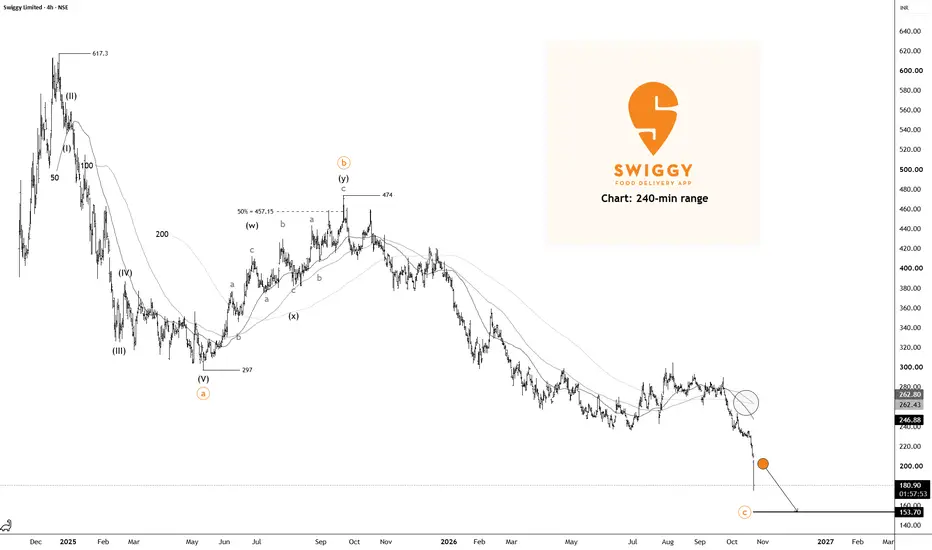
Swiggy Ltd (NSE): Will Sellers Push Lower?๐ Elliott Wave Analysis | 4-Hour Chart
Swiggy has witnessed a sharp bearish breakdown, with price falling to 176.65 on the 4-hour chart. The current technical structure favors a bearish interpretation, with the possibility that the decline from 474 is part of a larger corrective sequence.
The decline from 617.30 to 297 appears to have developed into a five-wave bearish impulse, labeled Waves (I) through (V). Following this decline, Swiggy recovered toward 474 in a complex WโXโY corrective stru
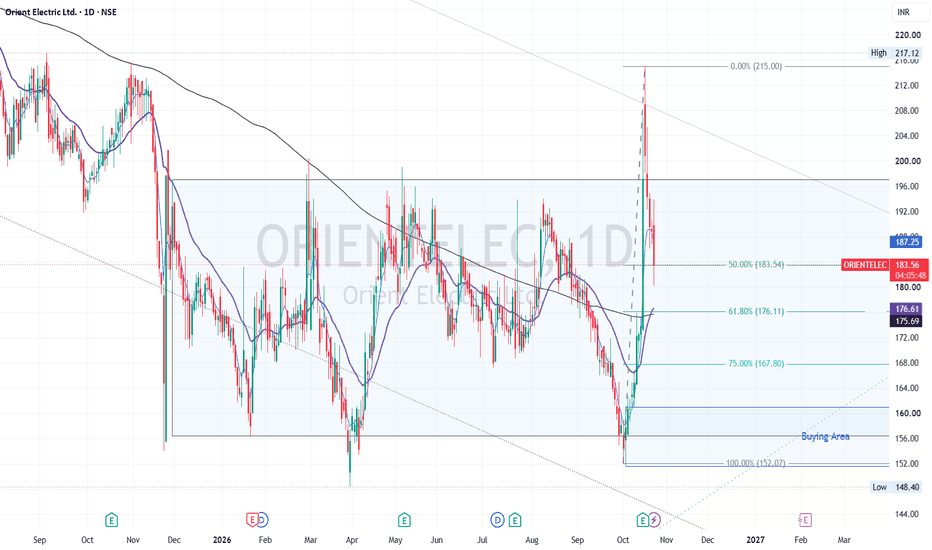
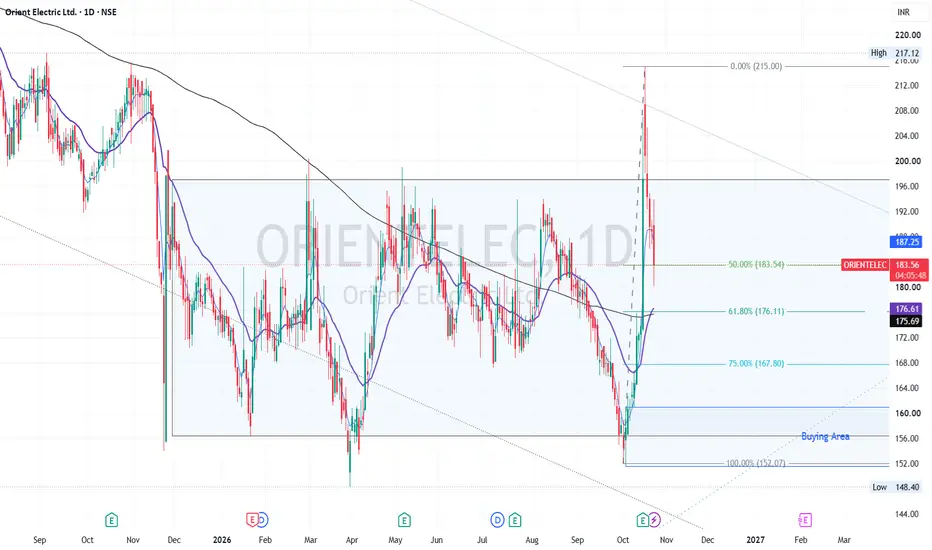
Orient Electric shows a bullish structure with price >SMA200
Trading Idea
Bias: Bullish with caution at current support zone.
Entry Zone: โน165โ170 (near 75% fib retracement and EMA cluster).
Targets:
Shortโterm: โน178โ185 (EMA 21 resistance zone).
Mediumโterm: โน200โ210 (previous swing highs).
StopโLoss: Below โน160 (to protect against breakdown under fib support).
Risk Note: If price fails to hold above EMA 21 and retraces below โน160, weakness could extend toward โน150 (SMA 200).
โ ๏ธ Risks & Considerations
Overbought MFI: Money Flow Index recently ab
TARIL Technical Analysis: Breakout or Bull Trap?๐ What Does the Chart Say?
Sharp rally: TARIL surged 14.97% on 14 October, closing at โน349.50, with exceptional volume of approximately 6.9 crore shares.
Profit-booking followed: The stock subsequently declined over several sessions, retreating towards โน314.50.
Volume warning : The huge volume spike was followed by a sustained pullback.
The breakout attempt has lost momentum and needs confirmation.
Moving averages: Price remains above the 20-, 50-, 100- and 200-day SMAs, but is below
eMudhra Stock Crashes Nearly 40%! What Went Wrong?Introduction
eMudhra shares witnessed a sharp sell-off after a cybersecurity incident triggered major concerns about the company's digital-certificate business, reputation and future prospects.
๐ **Why Is the Stock Falling?**
1๏ธโฃ Cybersecurity Flaw
] Eight intermediate Certificate Authority certificates were found to have weak private keys because of a cryptographic key-generation flaw.
The incident raised concerns about the security and trustworthiness of affected digital certifica
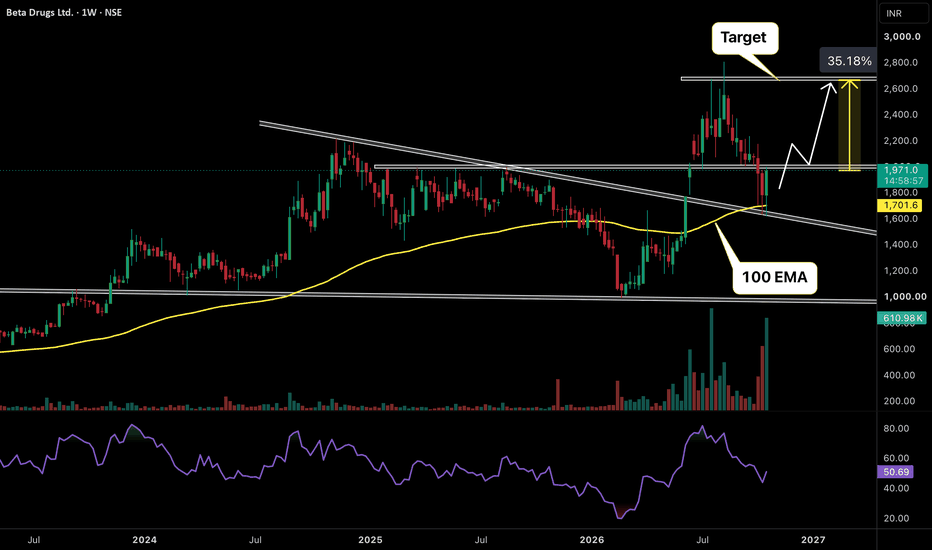
This Powerful Reversal Could Push Beta Drugs Towards 2700+Beta Drugs is showing a strong bullish reversal after successfully retesting its major multiyear trendline breakout. The stock had already delivered a powerful rally after breaking this resistance but the recent correction brought price back towards the same trendline which is now acting as support. Interestingly the 100 EMA is also sitting near this zone around 1700 which makes this support even stronger. Buyers have responded aggressively with a strong weekly recovery of more than 18% and impr
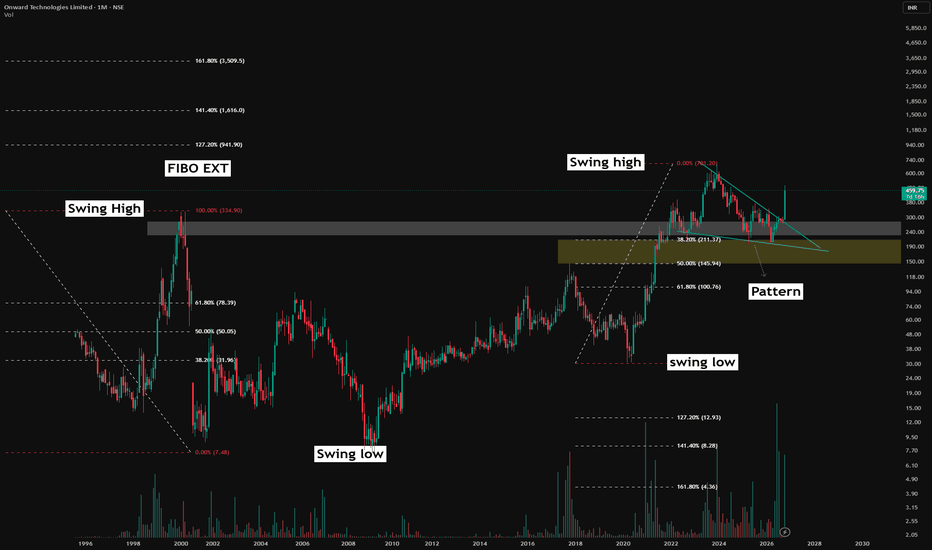
Onward Technologies: Reading Resistance, Consolidation & FibApoorv Dubey | SEBI Registered Research Analyst
A simple exercise in analysing a monthly chart independently:
1. Start with historical resistance
The grey resistance band traces back to the price activity around 2000. Price revisited and moved through this area around 2022. Observe the subsequent monthly closes and retests to understand how this old resistance has influenced the newer structure.
2. Map the consolidation
The converging green boundaries outline the consolidation following the l
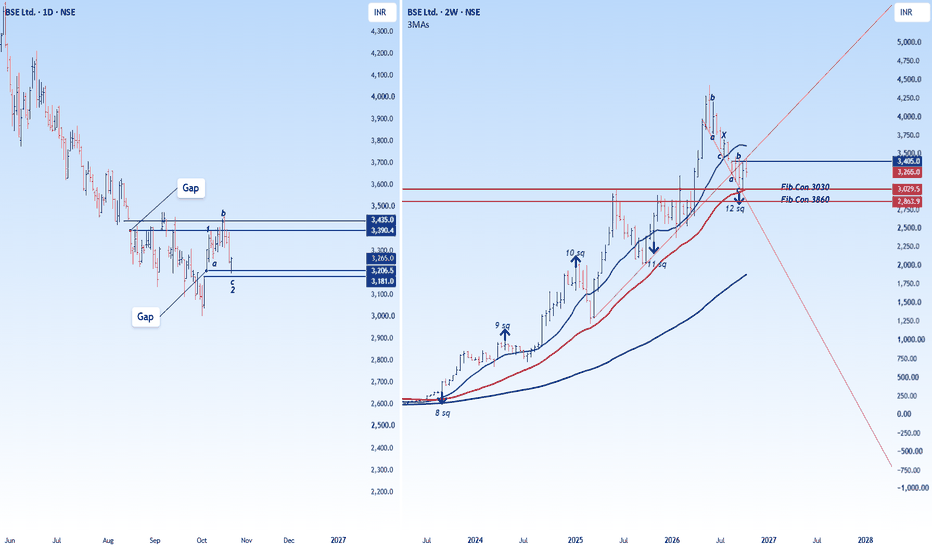
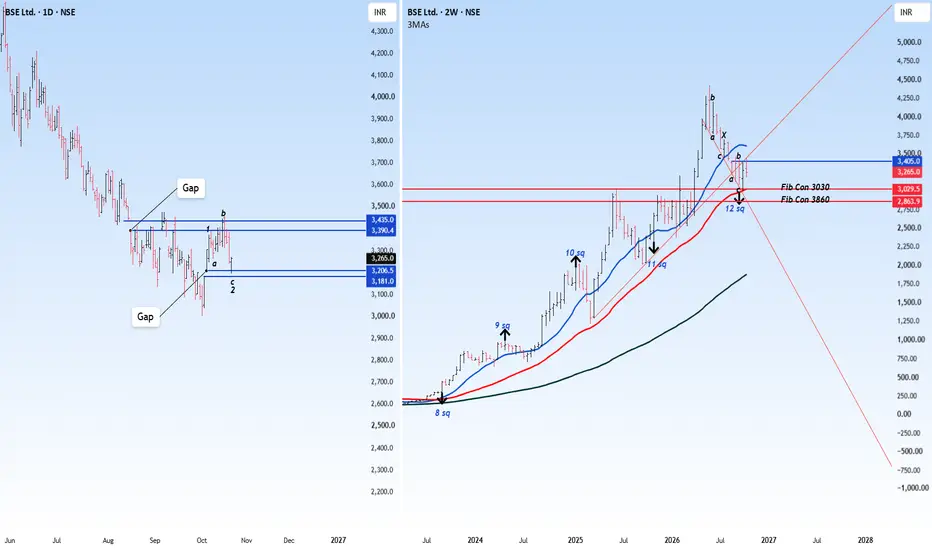
Is it still a good buy??BSE CMP 3265
Fib- the stock made lows at the fib con at 3030. The MA in red cutting the confluence zone at 3030 is further supporting the strength of the zone.
Elliott- A complex correction ended at 3030.
Gann Cycle- where the second c wave finished it also marked the 12th Gann square cycle.
Gap - the trendline and gap at 3400 is acting as a strong resistance as of now.
Conclusion - to me if the stock doesn't close below the gap at 3180 then it is a buy. A safe entry point will be on
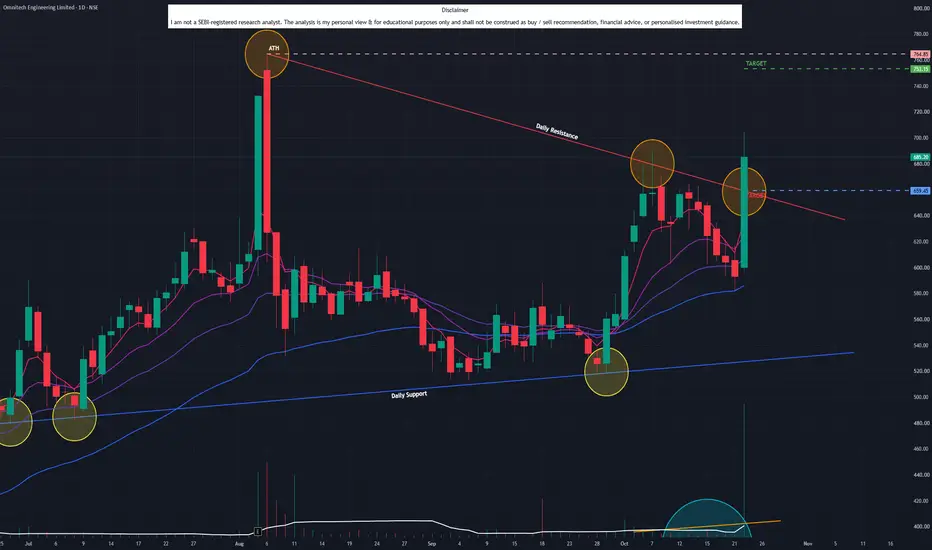
Omnitech Engineering (D): GAP-UP BREAKOUTTimeframe: Daily | Chart Scale: Linear
Explosive gap-up and +15.54% surge today backed by a massive 21.12M volume spike! ๐ฅ
Technical Highlights:
โ
Breakout: Gapped up, cleared & closed above short-term angular resistance (active since Aug '26).
โ
Volume: Rising volume confirms heavy and sustained buyer accumulation.
โ
Momentum: Short-term EMAs in positive crossover (Daily). MACD & RSI rising. ๐
Key Levels to Watch:
๐ฏ Target: 753
๐ก๏ธ Support / Pullback: 659.45 (Previous r
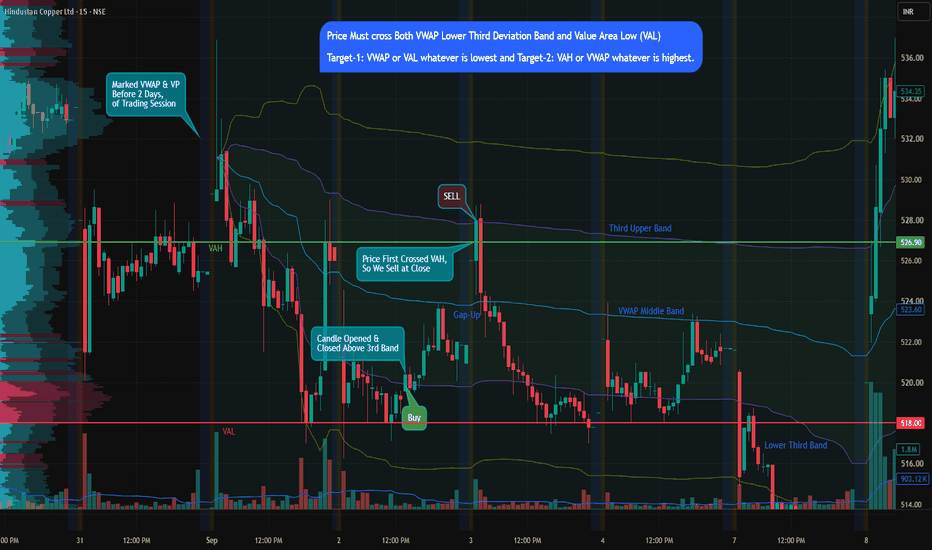
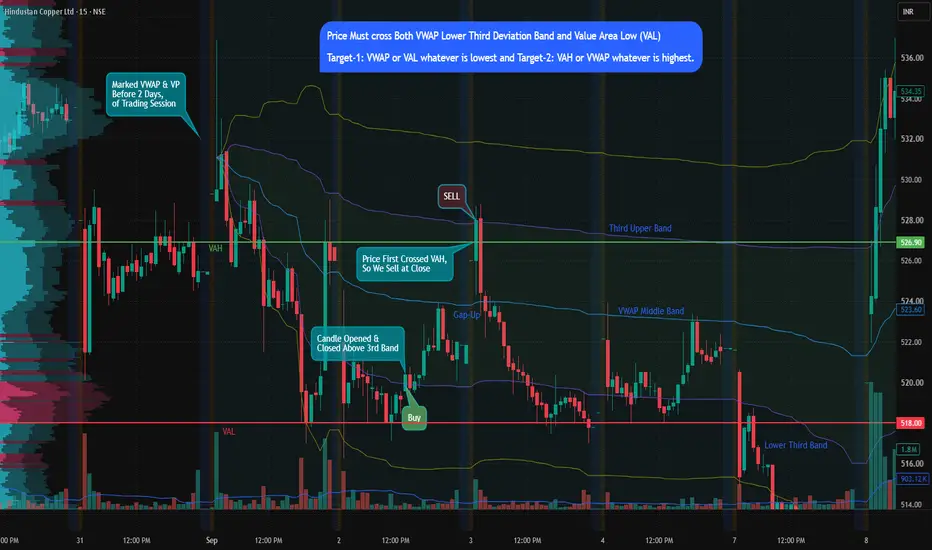
VWAP + Volume Profile Trading StrategyVWAP + Volume Profile Strategy | Hindustan Copper (NSE)
Price action becomes more powerful when combined with VWAP, deviation bands, and Volume Profile.
This strategy focuses on identifying potential trade setups using key reference levels and price confirmation.
Strategy Rules
1. Entry Confirmation
Identify the Value Area High (VAH) and Value Area Low (VAL) using Volume Profile.
Plot VWAP with its deviation bands.
Short setup: Wait for price to cross below both the Low
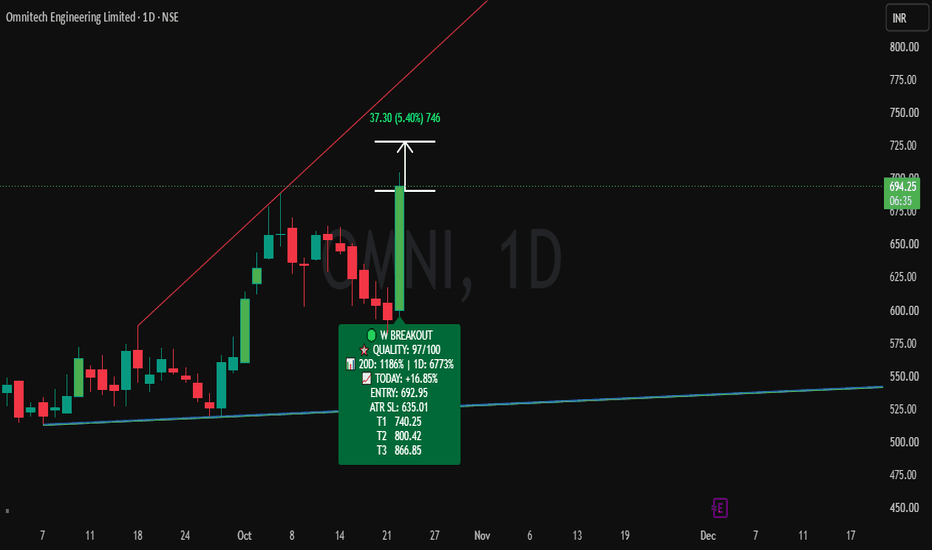
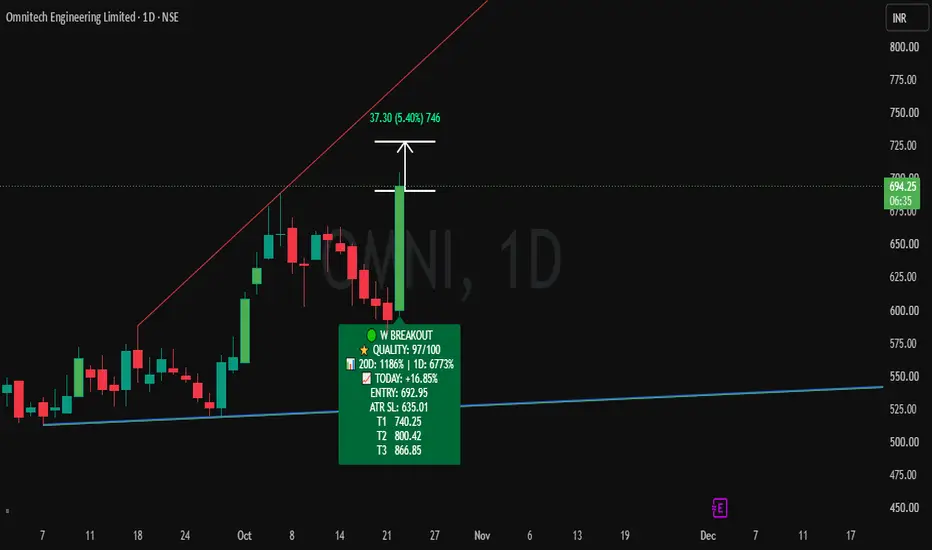
Buy Today, Sell Tomorrow for 3-5% - Daily Breakout SetupOMNITECH โ BTST BREAKOUT SETUP
Entry, Stop Loss & Targets Are Clearly Defined โ Helping You Plan Your Trade With Confidence.
๐ Stock Strength: 97/100
(Note: Higher score indicates stronger stock conditions, not guaranteed returns.)
A bullish breakout has appeared on the 1D timeframe with positive price action and strong volume expansion.
๐ Trade Type: BTST
โโโโโโโโโโโโโโโโโโโโ
๐ฏ TRADE LEVELS
ENTRY: โน691
๐ STOP LOSS
ATR SL: โน633
๐ฏ TARGETS
5%
โโโโโโโโโโโโโโโโโโโโ
๐ VOLUME
20D Volume: 1
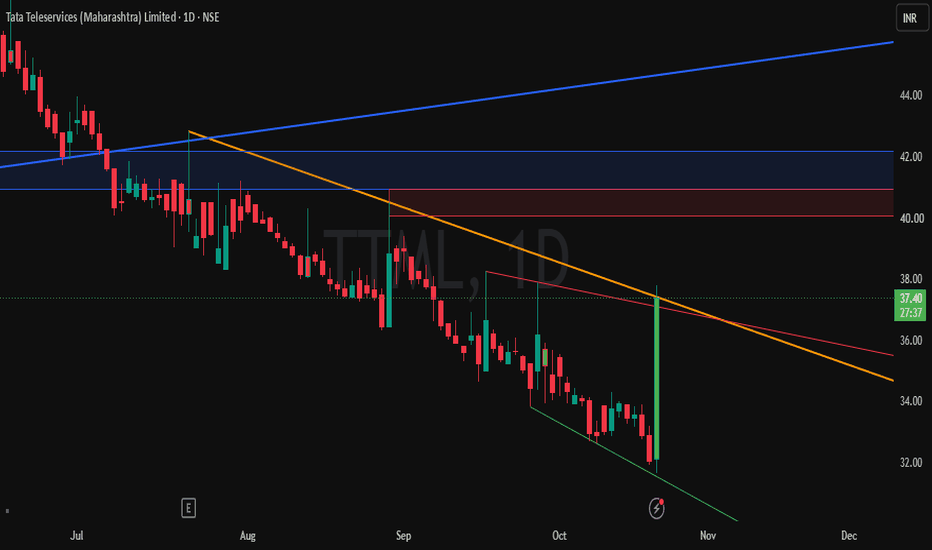
Buy Today, Sell Tomorrow for 3-5% - Daily Breakout SetupTTML โ BTST BREAKOUT SETUP
Entry, Stop Loss & Targets Are Clearly Defined โ Helping You Plan Your Trade With Confidence.
A bullish breakout has appeared on the 1D timeframe with positive price action.
๐ Trade Type: BTST
โโโโโโโโโโโโโโโโโโโโ
๐ฏ TRADE LEVELS
ENTRY: โน37
๐ STOP LOSS
34
๐ฏ TARGETS
3โ5%
โโโโโโโโโโโโโโโโโโโโ
โฑ Timeframe: 1 Day
๐ Trade Entry: Take the trade only after 3:15 PM.
The position can be held for the next trading session if the trend remains strong.
The setup is base
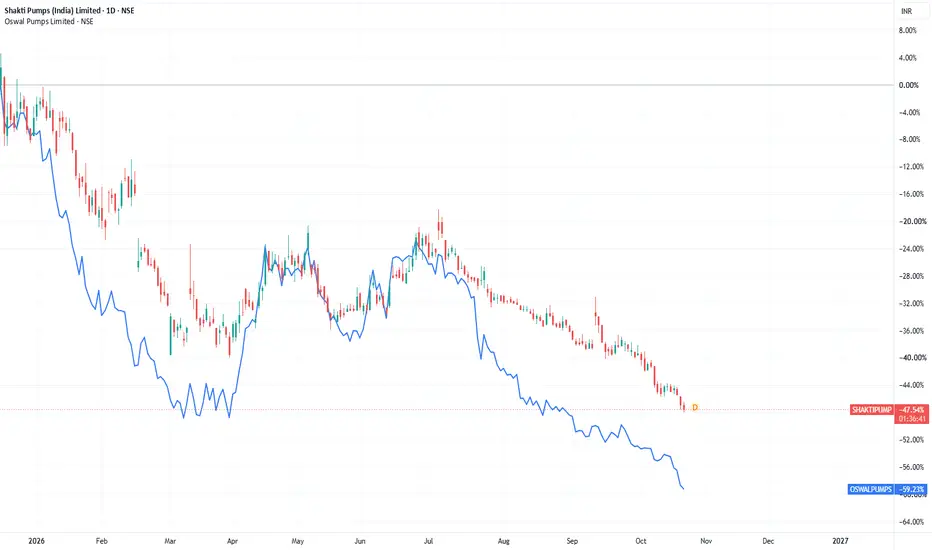
WHY ARE PUMP STOCKS CRASHING IN INDIA?Introduction
Pump stocks have corrected sharply from their previous highs. Is the solar-pump growth story over? Not necessarily! The bigger concern is whether companies can convert strong industry demand into sustainable profits and cash flow.
๐ How Severe Is the Correction?
Shakti Pumps: Approximately 48% below its reported 52-week high.
Oswal Pumps: Approximately 68% below its reported 52-week high.
๐ 6 Major Reasons Behind the Fall
1๏ธโฃ Aggressive Tender Pricing
Intense competi
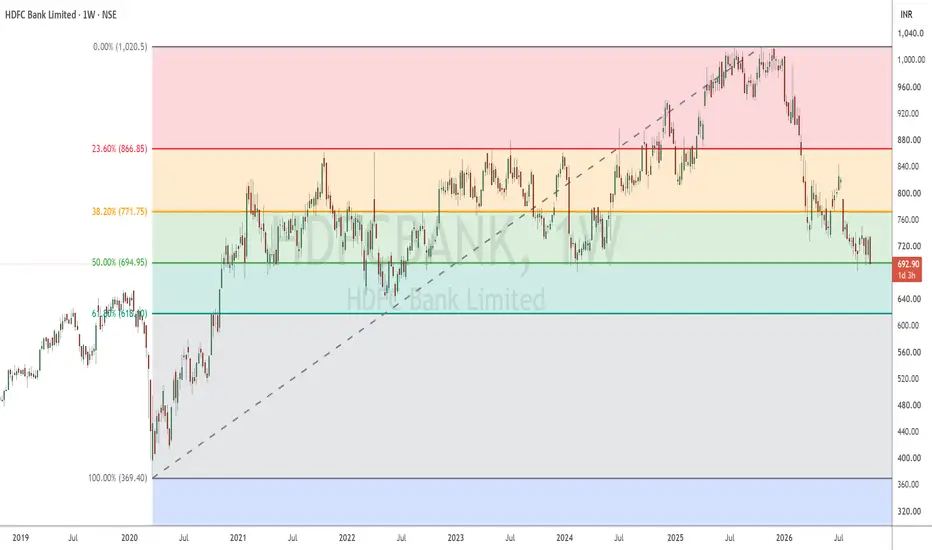
HDFC Bank Faces Pressure Following Q2 ResultsHighlights
HDFC Bank closed around โน707 on October 21 after weakening following its Q2 FY27 results announced on Saturday, October 17. The stock remains in a broader corrective trend.
Immediate support is around โน700โโน708, followed by โน685โโน692. A decisive breakdown below โน685 could extend the correction towards โน670โโน675.
On the upside, โน718โโน728 is the immediate resistance zone. A sustained breakout above โน728 could trigger a recovery towards โน742โโน755.
Momentum remains weak, with RSI a
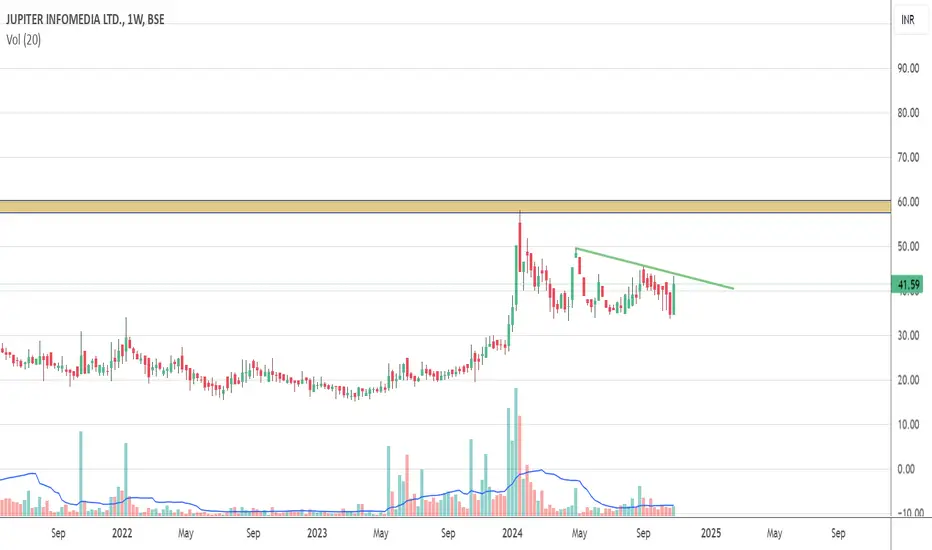
Jupiter Infomedia - Ready to breakout for a good move!Jupiter infomedia made a tall pole breakout last year and since then it has been consolidating. Stock has shown great volume during the pole construction and even during the consolidation volume has shown growth with small spike regularly.
Stock is now showing potential to come out of its range and breakout from the flag pattern.
CMP 41
Potential upside of about 40%
Watch out for breakout before you dive-in
Disclaimer: I'm not a registered analyst. I'm only sharing my opinion on the platfo
HFCL again hits resistanceHFCL rallied but was not able to break the trendline which carries the high in September 2024. If it has to rally above this level HFCL will require strength. Just count the instances this trendline has been hit. It's a very solid resistance and if broken you know what to expect:)