• Products
  • Community
  • Markets
  • Brokers
  • More
Get started
  • Markets
  • /India
  • /Stocks
  • /Ideas
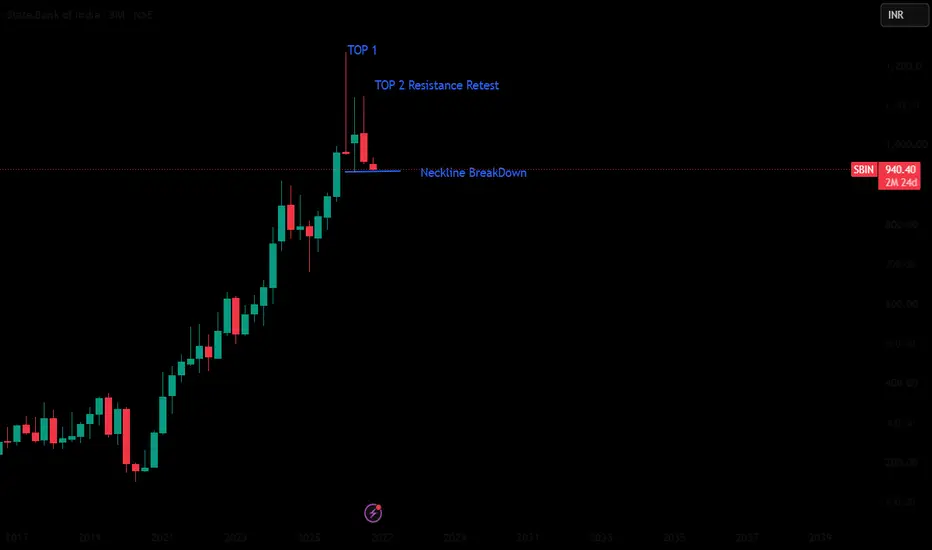
SBI 3M Chart: Potential Double Top at the NecklineSBI’s 3-month chart is showing a potential Double Top following a strong upward trend. The first peak was followed by a pullback. Price then rallied toward the previous resistance zone, forming a second, slightly lower peak and showing rejection near that area. The reaction low between these two peaks forms the neckline, marked on the chart. This support is the key level to watch as price tests the potential breakdown. A completed 3-month candle closing below the neckline would confirm the pa
NSE:SBIN
by bkshikhar7
2
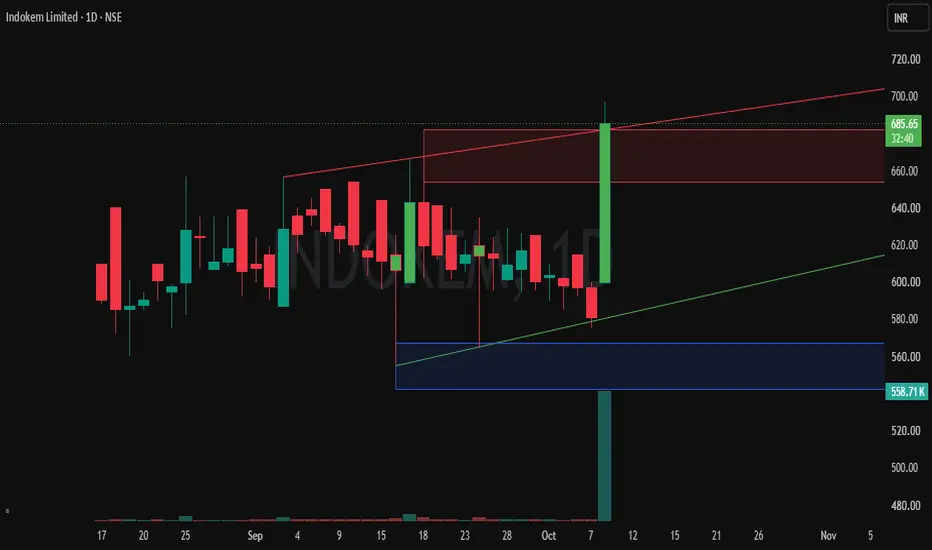
Buy Today, Sell Tomorrow for 3-5% - Daily Breakout SetupINDOKEM — BTST BREAKOUT SETUP Entry, Stop Loss & Targets Are Clearly Defined — Helping You Plan Your Trade With Confidence. 📊 Stock Strength: 94/100 (Note: Higher score indicates stronger stock conditions, not guaranteed returns.) A bullish breakout has appeared on the 1D timeframe with positive price action and strong volume expansion. 🔄 Trade Type: BTST ──────────────────── 🎯 TRADE LEVELS ENTRY: ₹685 🛑 STOP LOSS ATR SL: ₹625 🎯 TARGETS 3-5% ──────────────────── 📈 VOLUME GOOD ──
NSE:INDOKEMLong
by nemichandbhati
Buy Today, Sell Tomorrow for 3-5% - Daily Breakout SetupFINO — BTST BREAKOUT SETUP Entry, Stop Loss & Targets Are Clearly Defined — Helping You Plan Your Trade With Confidence. 📊 Stock Strength: 94/100 (Note: Higher score indicates stronger stock conditions, not guaranteed returns.) A bullish breakout has appeared on the 1D timeframe with positive price action and strong volume expansion. 🔄 Trade Type: BTST ──────────────────── 🎯 TRADE LEVELS ENTRY: ₹148 🛑 STOP LOSS ATR SL: ₹139 🎯 TARGETS 3-5% ──────────────────── 📈 VOLUME GOOD ──────────
NSE:FINOPBLong
by nemichandbhati
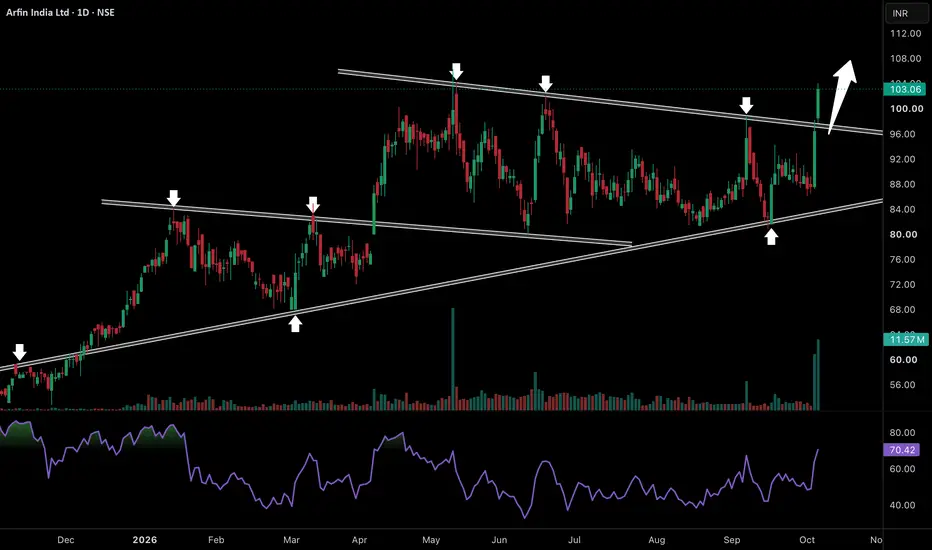
Arfin India Looks Ready For Its Next Powerful RallyStock is again testing the 96–98 falling resistance that has controlled every major rally since May. What makes this attempt important is the pressure building underneath. The stock continues to respect its rising trendline and the recent sharp fall towards 80–82 was immediately bought, showing buyers are still aggressively defending the broader bullish structure. Since then price has rebuilt momentum and today’s strong move has pushed it directly back towards resistance with a clear expansion i
NSE:ARFINLong
by Marketik
Updated
L&T Consolidates Near Key Support With Positive OutlookHighlights L&T's broader technical outlook remains constructive, supported by its strong infrastructure and engineering order book. However, the stock needs to overcome near-term resistance to resume its upward momentum. The ₹4,000 psychological level remains an important reference point. Sustained trading above this region would favour recovery, while a breakdown could increase selling pressure. The latest available price is around ₹3,675–₹3,700, reflecting continued selling pressure. The
NSE:LTF
by yogeshwar
1
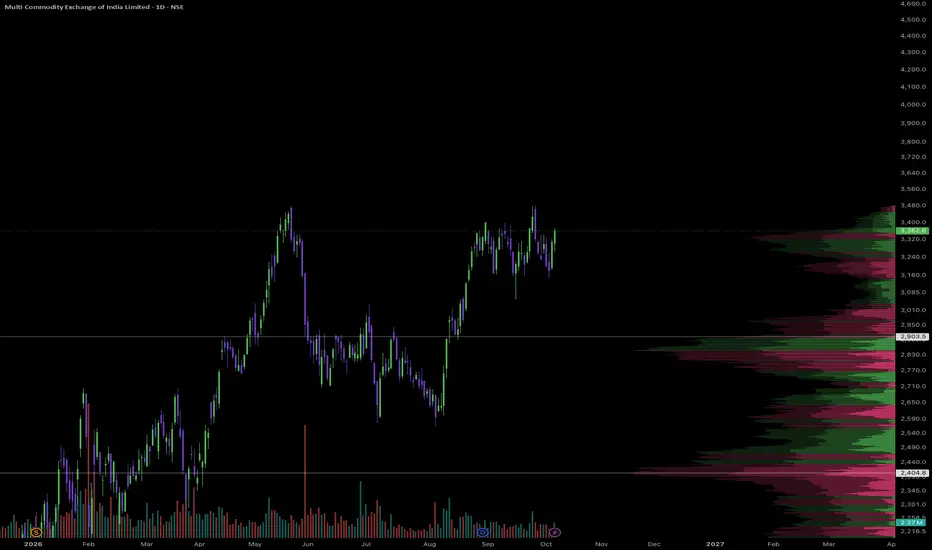
MCX good chart and commodities markets cool offbeen watching MCX for a while now, and been trading it too. Whenever it creates a wedge or a W pattern its like its installing a game on the computer, when you wait wait wait for the game to install and play it, looking at the installation bar to get to 100% and look away to see if it installs fast. i will personally aim for 3600. but will take an early exit at 3580-90 for half of it rest trailing. Entry- Now or a little lower, maybe a little higher (3300-3350) tp- 3580-3620 sl- 5-6% lower.
NSE:MCXLong
by RedBullBlueBull
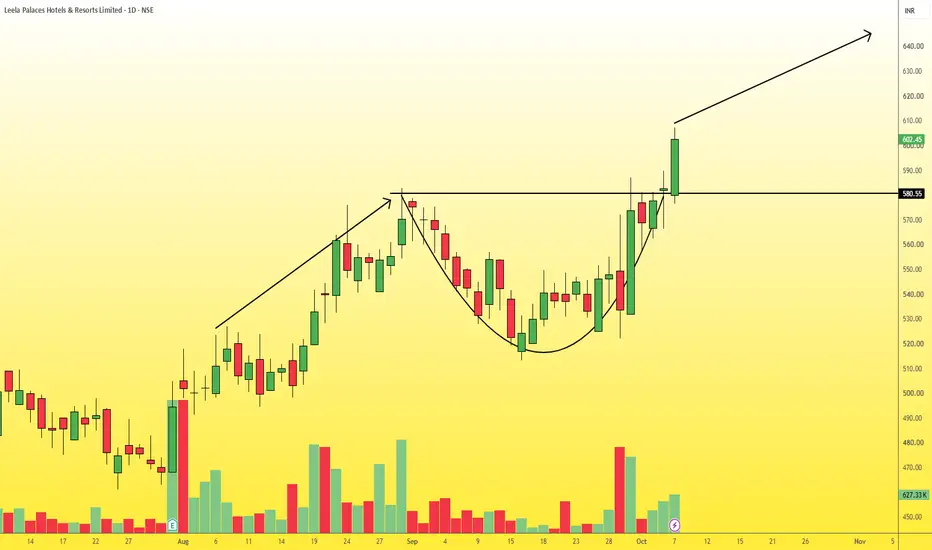
THELEELA Bullish Cup BreakoutThe price action has formed a classic 'Cup' or rounding bottom pattern. This indicates a gradual accumulation phase and a clear shift in momentum from sellers to buyers. Breakout: The price successfully broke out of the neckline resistance at 580.55. The 580.55 mark held firm as new support, followed by a strong bullish bounce that confirms the breakout's validity. Volume Confirmation: The initial breakout was accompanied by a noticeable surge in buying volume, adding significant weight to the
NSE:THELEELA
by ParamjitMahapatro
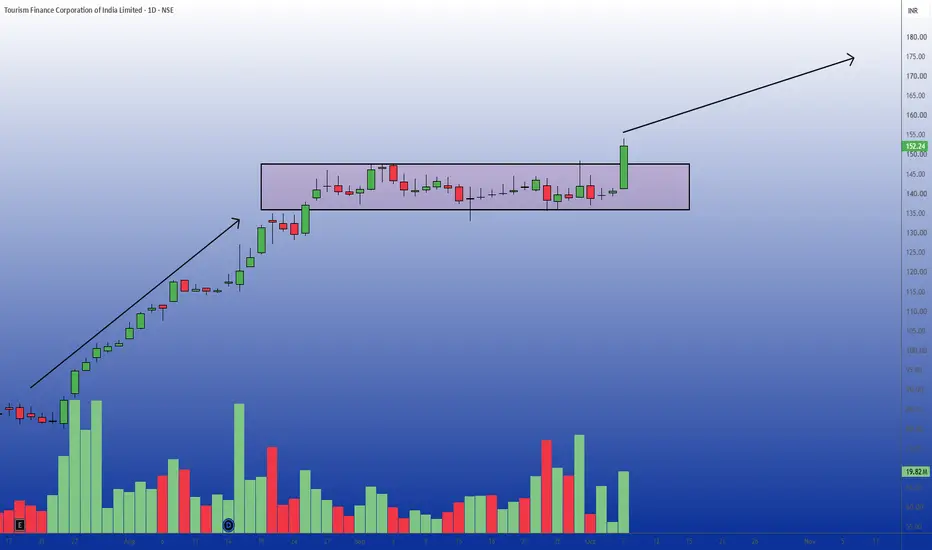
TFCILTD Bullish Breakout from Consolidation Phase on DailyOn the daily timeframe, Tourism Finance Corporation of India Limited has demonstrated a strong preceding uptrend, rallying significantly before entering a period of sideways movement. Over the past several weeks, the price has been consolidating within a well-defined rectangular box, bouncing between structural support near 135 and resistance near 146-147. In the most recent trading session, a strong bullish candle broke out above the upper boundary of this consolidation zone, closing at 152.2
NSE:TFCILTD
by ParamjitMahapatro
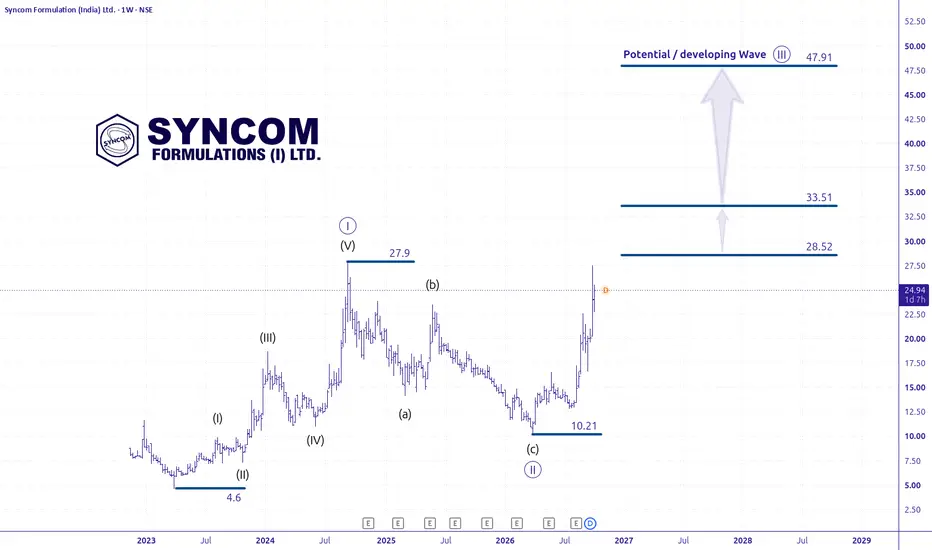
Is Wave (III) Starting in NSE Stock Syncom?🧬 SYNCOM Can Wave (III) Push It to ₹47+? NSE:SYNCOMF appears to be developing an interesting Elliott Wave structure on the weekly chart . The advance from 4.60 to 27.90 can be interpreted as a five-wave impulse, potentially completing a larger Wave (I) . Price then corrected from 27.90 to 10.21 , with the decline appearing to form an A-B-C corrective structure that may have completed Wave (II) at 10.21. Since that low, price has rebounded strongly and is now trading around 24.
NSE:SYNCOMFLong
by VCSompura
2
AVADHSUGAR Multi-Year Breakout Above Key Resistance on WeeklyLooking at the weekly timeframe for Avadh Sugar & Energy Ltd., the stock has just staged a massive breakout above a multi-year resistance level at 855.10. This horizontal resistance has acted as a strong ceiling since early 2022, rejecting the price on multiple occasions. Over the past few years, the stock has formed a large, constructive basing pattern (resembling a massive rounding bottom or cup formation). The recent upward thrust to current levels (around 937.55) is accompanied by a notic
NSE:AVADHSUGAR
by ParamjitMahapatro
Black Box: Bullish Recovery Setup with 1,020 Target Black Box is showing a recovery from the 709 low, with momentum improving. Price is now above 841, which is the key support level. A sustained move above 893 can strengthen the bullish setup. Upside targets are around 953 – 1,020 . The setup stays positive as long as 841 holds. A break below 841 would weaken the structure. Overall, the chart favours further upside if momentum continues. Disclaimer: For educational purposes only. Not financial advice. By @BrightRally_Research
NSE:BBOX
by BrightRally_Research
JYOTICNC – WAVE II COMPLETE, WEDGE BREAKOUTJyoti CNC Automation ( NSE:JYOTICNC ) looks to have completed a large Wave II correction. The stock is now in the early stages of a potential Wave III advance. 📈 Wave I (₹370 → ₹1,505) – Clean 5-wave impulse Wave 3 is the longest at about 1.54× Wave 1, so the "never the shortest" rule holds. Wave 4 low (~₹970) stays well above the Wave 1 high (~₹850), so there's no overlap. Wave 2 was sharp and Wave 4 was sideways, which gives good alternation. 📉 Wave II (₹1,505 → ~₹575) – W-X-Y do
NSE:JYOTICNC
by hardeepssethi
Swiggy: Three Legs Down, Now a Base?Educational study only. Not a buy or sell recommendation. I am not forcing a wave count on this chart yet. But the structure is getting interesting, so I am sharing what I can see and what I am waiting for. The fall from the top: Swiggy fell from its listing high of 617.30 in three clear legs: 617.30 down to 297 (320 points). A bounce to 474, taking back about 55% of the first fall. Another fall to 235.50 (238 points, about 0.75 times the first leg). Three legs usually mean a correct
NSE:SWIGGY
by WaveXplorer
GLAND Symmetrical Triangle Breakout with Strong Volume🔥 Gland Pharma: Symmetrical Triangle Breakout with Strong Volume 📊 MARKET STRUCTURE SNAPSHOT | NSE: GLAND | DAILY Closing Price: 3,150.60 Core Trend: Uptrend Market State: Breakout Chart Pattern: Symmetrical Triangle — Bullish Breakout Candlestick Pattern: Strong Bullish Candle Price Structure: Price spent several weeks consolidating within a symmetrical triangle before expanding sharply above the upper boundary. The latest candle has carried price to 3,150.60, creating a clear expansion from th
NSE:GLANDLong
by simpletradewithpatience
3
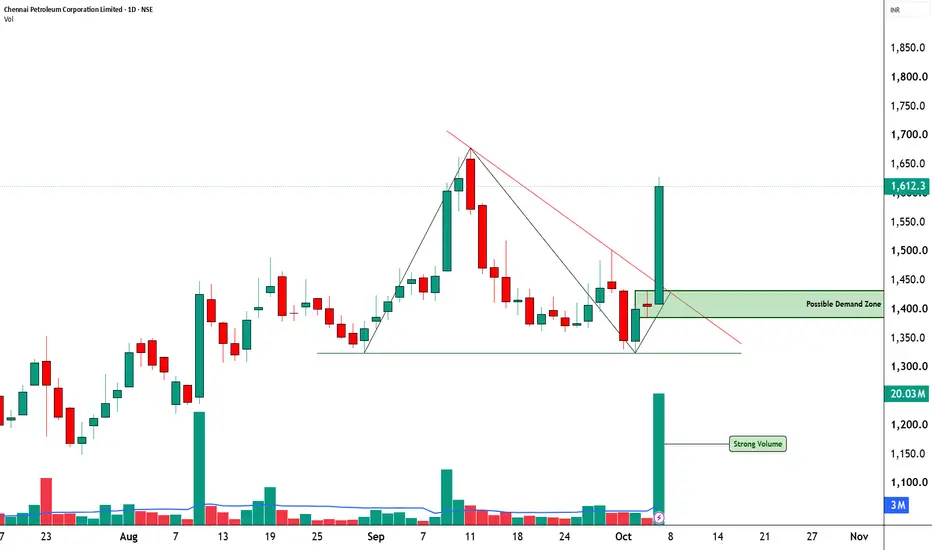
CHENNPETRO Descending Triangle Breakout with Exceptional Volume🔥 Chennai Petroleum: Descending Triangle Breakout with Exceptional Volume 📊 MARKET STRUCTURE SNAPSHOT | NSE: CHENNPETRO | DAILY Closing Price: 1,612.30 Core Trend: Uptrend Market State: Strong Bullish Expansion / Breakout Chart Pattern: Descending Triangle — Bullish Breakout Candlestick Pattern: Strong Bullish Candle Price Structure: Price had been consolidating below a descending resistance line after the earlier rejection near the 1,650–1,680 zone. The latest session has produced a powerful ex
NSE:CHENNPETROLong
by simpletradewithpatience
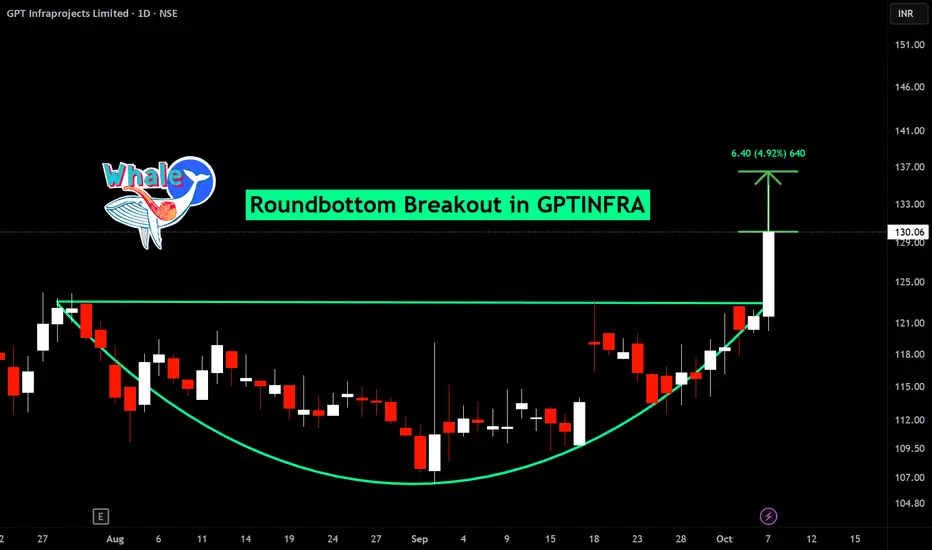
BUY TODAY SELL TOMORROW for 5%DON’T HAVE TIME TO MANAGE YOUR TRADES? - Take BTST trades at 3:25 pm every day - Try to exit by taking 4-7% profit of each trade - SL can also be maintained as closing below the low of the breakout candle Now, why do I prefer BTST over swing trades? The primary reason is that I have observed that 90% of the stocks give most of the movement in just 1-2 days and the rest of the time they either consolidate or fall Roundbottom breakout in GPTINFRA BUY TODAY SELL TOMORROW for 5%
NSE:GPTINFRA
by Kapil-Mittal
2
BUY TODAY SELL TOMORROW for 5%DON’T HAVE TIME TO MANAGE YOUR TRADES? - Take BTST trades at 3:25 pm every day - Try to exit by taking 4-7% profit of each trade - SL can also be maintained as closing below the low of the breakout candle Now, why do I prefer BTST over swing trades? The primary reason is that I have observed that 90% of the stocks give most of the movement in just 1-2 days and the rest of the time they either consolidate or fall Trendline breakout in MBEL BUY TODAY SELL TOMORROW for 5%
NSE:MBEL
by Kapil-Mittal
2
Arfin India Has Finally Broken Out Now Momentum Can ExplodeArfin India has finally done what buyers were trying to achieve for months. The falling trendline that rejected price repeatedly around the 98–104 zone has now been broken with a strong bullish candle and a massive expansion in volume. What makes this breakout more powerful is the structure underneath. Every major correction continued to respect the rising support and the latest fall towards 80–82 was aggressively bought. Price then returned to resistance much faster than before and this time se
NSE:ARFINLong
by Marketik
1
Epack Prefab Is Breaking Out After Months Of CompressionThe stock is reaching a very important turning point after spending almost a year under the falling trendline. Price has been squeezed between this long-term resistance and a steadily rising support line. The important part is what happened during the latest correction. Buyers again defended the rising trendline around 210–220 and price started forming higher lows before today’s strong move towards 267. The stock is now trying to break the falling trendline with clear expansion in volume while R
NSE:EPACKPEBLong
by Marketik
Molbio Is Building Pressure For A Move Towards New HighsThe stock is showing a very strong bullish structure with buyers consistently defending the rising trendline. Every meaningful correction has formed a higher low and the latest reaction from around 1200 was followed by an aggressive rally towards 1550. What stands out now is how price is behaving near the 1540–1560 resistance zone. Instead of getting rejected sharply the stock is consolidating tightly just below resistance. This usually shows sellers are getting absorbed while buyers are comfort
MLong
by Marketik
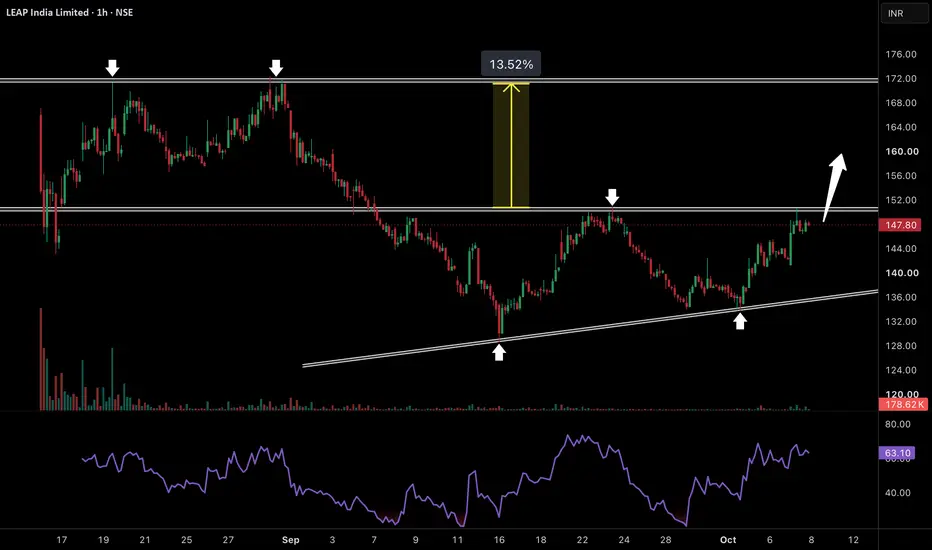
LEAP India Is One Breakout Away From A 13% ExpansionThe stock is again testing the 149–150 resistance zone and this time the structure underneath looks much stronger. Price was rejected from this level in September but sellers could not create a fresh low. Instead the correction found buyers near the rising trendline around 134–135 and the stock quickly returned to the same resistance. This higher-low structure shows buyers are slowly taking control while supply around 150 is getting absorbed. RSI has also recovered above 60 which supports the im
LLong
by Marketik
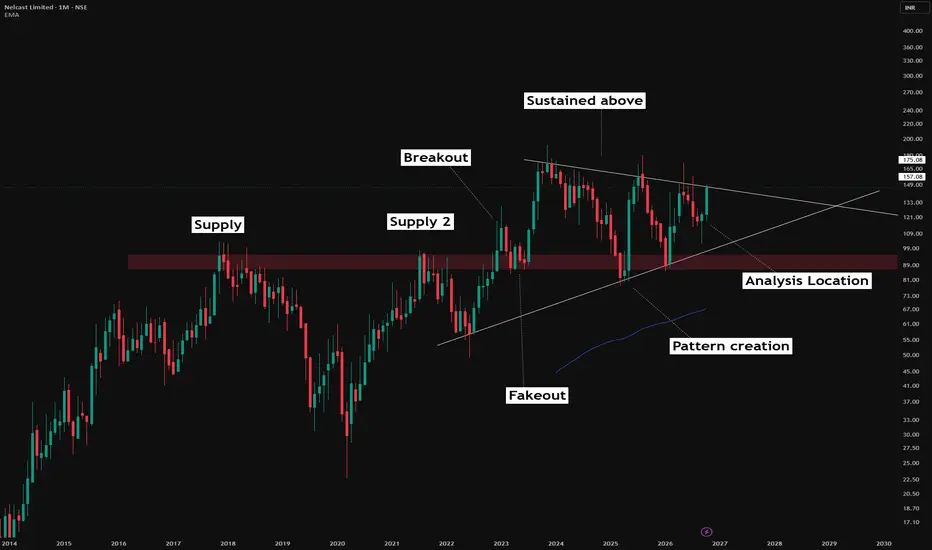
Breakout Isn’t the Opportunity — What Happens AFTER It IsThis is not a Recommendation to Buy, Sell or Hold, This is a Method, how to analyse Stocks on your own and what Location is great to do so . One of the biggest differences between finding a stock worth analysing and simply chasing price is understanding what happens after an important supply zone is crossed. I personally don't consider the breakout of an all-time high or a major supply zone, by itself, a sufficient reason to enter a trade. Why? Because a breakout is only an event. What price
NSE:NELCASTLong
by Apoorv-Dubey_SEBI-RA
Black Box Is Breaking Out And 1100 Is Back In SightBlack Box has given a strong breakout above the 830–840 resistance zone after spending the last few months rebuilding its structure. The correction from 1100 eventually found buyers around 700–720 which is an important area because it was an old breakout zone and also aligned closely with the rising 200 EMA near 727. Price repeatedly refused to break this support and slowly started forming a base. Now buyers have pushed price above 840 with improving volume while RSI has moved towards 67. This l
NSE:BBOXLong
by Marketik
PhysicsWallah Is Breaking Out And 160 Could Be Next Stock is showing a very clean shift in structure. After the sharp recovery from the March lows price started forming higher lows along the rising trendline while every rally from July onwards kept getting capped by the falling resistance. This created a large compression where sellers were pushing from the top but buyers kept accepting higher prices from below. The latest dip towards 118–120 was again defended aggressively and price has now pushed through the falling trendline around 135–138 wi
NSE:PWLLong
by Marketik
123456789101112131415161718192021222324252627282930313233343536373839404142
…999

Made by humans

Select market data provided by ICE Data Services. Select reference data provided by FactSet. Copyright © 2026 FactSet Research Systems Inc.Copyright © 2026, American Bankers Association. CUSIP Database provided by FactSet Research Systems Inc. All rights reserved. SEC filings and other documents provided by Quartr.© 2026 TradingView, Inc.

SOC 2 CompliantGDPR Compliant
More than a product
  • Supercharts
Screeners
  • Stocks
  • ETFs
  • Bonds
  • Crypto coins
  • CEX pairs
  • DEX pairs
  • Pine
Heatmaps
  • Stocks
  • ETFs
  • Crypto coins
Calendars
  • Economic
  • Earnings
  • Dividends
  • IPOs
More products
  • News Flow
  • Portfolios
  • Fundamental Graphs
  • Yield Curves
  • Options
  • Macro Maps
  • Pine Script®
  • MCP Server
Apps
  • Mobile
  • Desktop
Community
  • Social network
  • Wall of Love
  • Refer a friend
  • Creator program
  • House Rules
  • Moderators
Ideas
  • Trading
  • Education
  • Editors' picks
Pine Script
  • Indicators & strategies
  • Wizards
  • Freelancers
  • Marketplace
Tools & subscriptions
  • Features
  • Pricing
  • Market data
  • Gift plans
Trading
  • Overview
  • Brokers
  • Brokers comparison
  • The Leap
Special offers
  • CME Group futures
  • Eurex futures
  • US stocks bundle
About company
  • Who we are
  • Space mission
  • Blog
  • Help Center
  • Careers
  • Media kit
Merch
  • Tarot cards for traders
  • The C63 TradeTime
Policies & security
  • Terms of Use
  • Disclaimer
  • Privacy Policy
  • Cookies Policy
  • Accessibility Statement
  • Trust Center
  • Security tips
  • Bug Bounty program
  • Status page
Business solutions
  • Widgets
  • Charting libraries
  • Lightweight Charts™
  • Advanced Charts
  • Trading Platform
Growth opportunities
  • Advertising
  • Brokerage integration
  • Partner program
  • Education program
Community
  • Social network
  • Wall of Love
  • Refer a friend
  • Creator program
  • House Rules
  • Moderators
Ideas
  • Trading
  • Education
  • Editors' picks
Pine Script
  • Indicators & strategies
  • Wizards
  • Freelancers
  • Marketplace
Business solutions
  • Widgets
  • Charting libraries
  • Lightweight Charts™
  • Advanced Charts
  • Trading Platform
Growth opportunities
  • Advertising
  • Brokerage integration
  • Partner program
  • Education program
Look FirstLook First