• Products
  • Community
  • Markets
  • Brokers
  • More
Get started
  • Markets
  • /India
  • /Stocks
  • /Ideas
HFCL hit new trend line resistanceHCL has surpassed a trendline resistance and now hit another. Let's hope it surpasses this also.
NSE:HFCL
by myport
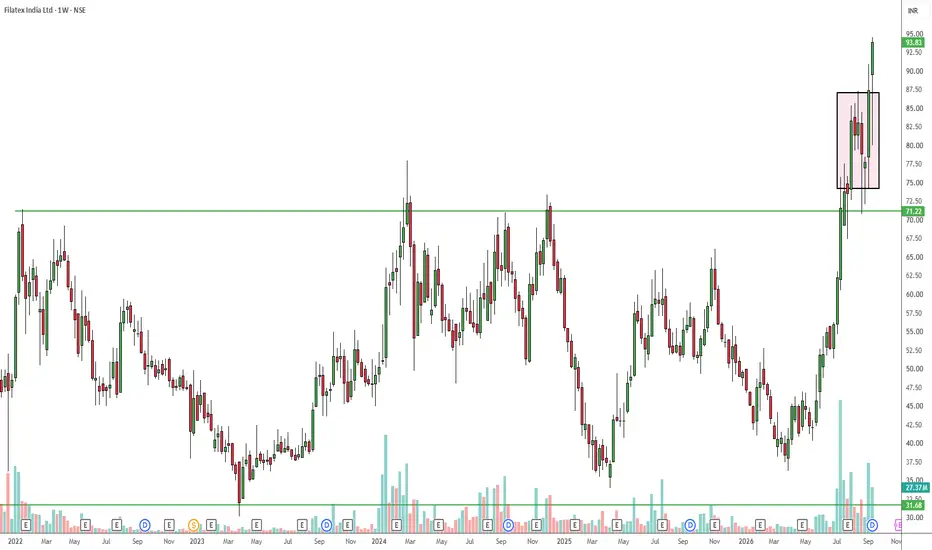
FILATEX : Multi-Year Breakout and Bullish Flag ContinuationBased on the weekly timeframe, Filatex India Ltd is demonstrating strong bullish momentum following a major structural breakout. Technical Analysis: The Breakout: The chart shows a decisive breakout above the long-term horizontal resistance line at 71.22, a level that previously capped upside movement. The Consolidation: Following the initial surge past 71.22, the price entered a healthy period of consolidation, creating a bullish rectangular flag pattern (highlighted by the pink box). Curren
NSE:FILATEX
by ParamjitMahapatro
Updated
4
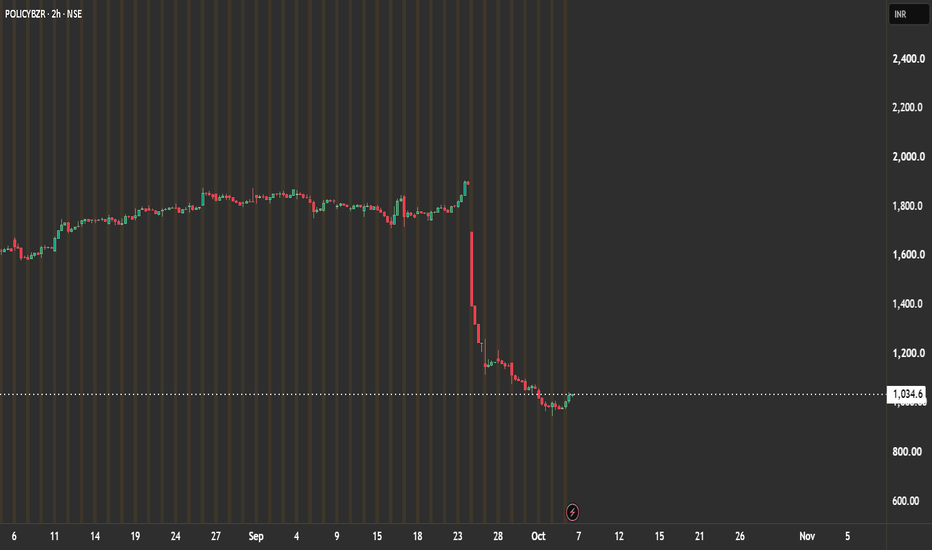
PB Tech | RISKY CE TRADEPOLICY BAZAAR 1180 CE Lot Size: 350 CMP: ₹13.25 Best Entry: Near ₹10 (Indicative) Stop Loss: ₹7 🎯 Targets T1: ₹21 T2: ₹28 T3: ₹31 ⚠️ TSL MUST BE FOLLOWED STRICTLY Risk Management : High-risk option trade. Trade only with an amount you can afford to lose. Do not average blindly. Disclaimer : Options trading involves substantial risk of loss. Past performance is not indicative of future results. SEBI Registered Research Analyst | Naresh G
NSE:POLICYBZRLong
by NareshG_SEBI_REGISTERED_RA
Updated
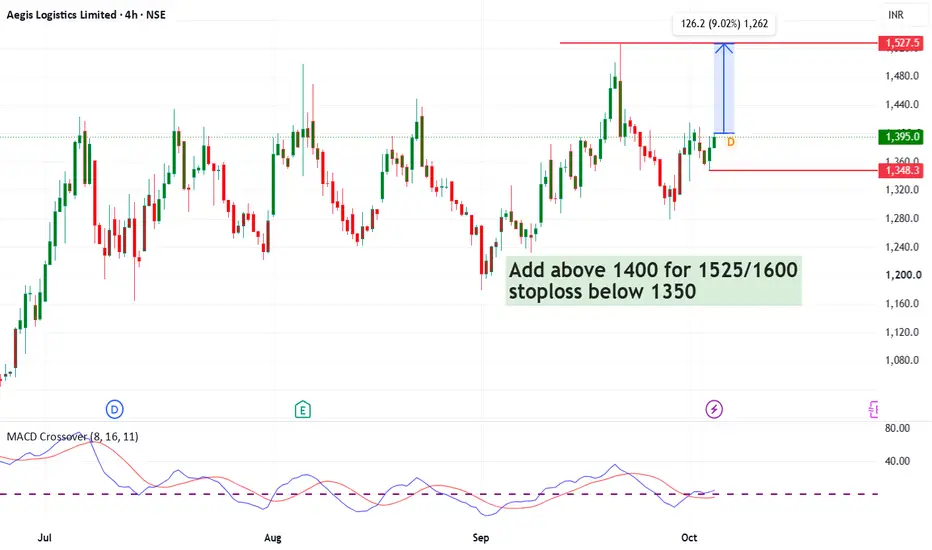
#aegislog for short term trading Add above 1400 for 1525/1600 strict stoploss below 1350 after that will review again
NSE:AEGISLOG
by AsheshBajpaiEsm
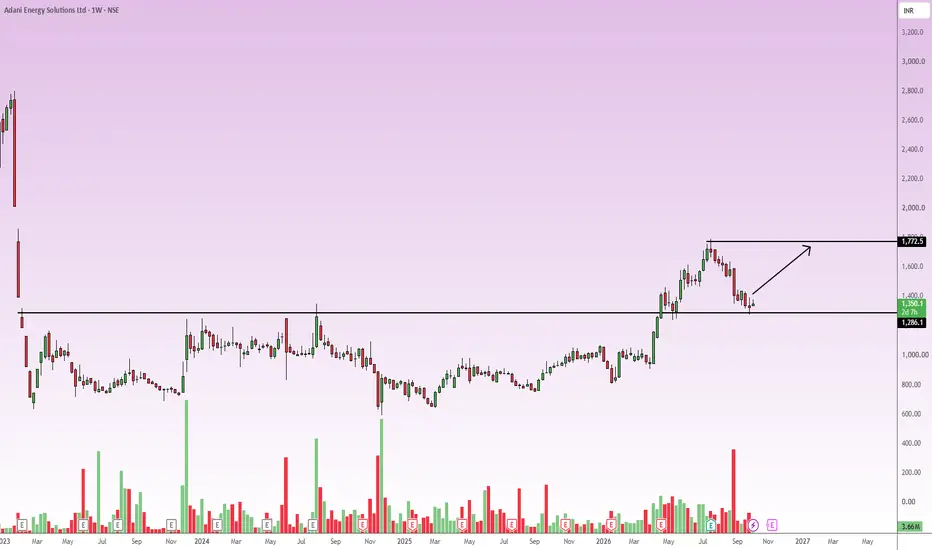
ADANIENSOL Bullish Breakout and Retest at Key SupportAdani Energy Solutions is showing a classic, high-probability bullish setup on the weekly timeframe. After an extended period of consolidation, the price successfully broke out above the heavy resistance level at 1,286. Currently, the stock has pulled back to retest this breakout level. This is a textbook "resistance-turned-support" technical pattern. The fact that this structure is forming on a weekly chart gives it significant weight. The combination of the multi-month base breakout and the
NSE:ADANIENSOL
by ParamjitMahapatro
NHPC High Risk:Reward Rebound from Major Horizontal SupportBased on the weekly timeframe NHPC is currently at a critical technical juncture, compressing within a large structure bounded by declining highs and a flat support base. Chart Analysis: Major Support: The stock has established a highly resilient horizontal support zone around the 71.50 - 72.00 level (marked by the black horizontal line at 71.58). The price has tested this floor multiple times over the past several months, and we are currently seeing a fresh bounce forming a bullish weekly can
NSE:NHPC
by ParamjitMahapatro
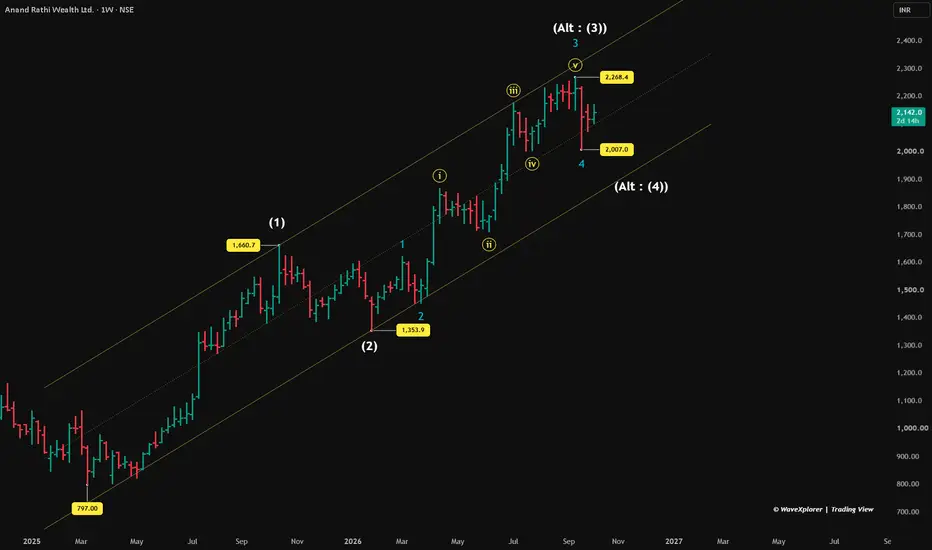
Anand Rathi Wealth: Wave 5 Ahead or Bigger Wave (4)?From the March 2025 low of 797, this stock has almost tripled. The move fits a clean Elliott Wave structure. Wave (1) and (2): Wave (1) ran from 797 to 1,660.7. Wave (2) fell to 1,353.9, taking back only 35.5% of wave (1). That's a shallow dip, which shows buyers stayed strong. Wave (3) so far: Inside wave (3), wave 1 topped at 1,620.5 and wave 2 fell to 1,451.5. Wave 3 then ran to 2,268.4, about 3 times the size of wave 1, in five smaller waves: ⓘ to ⓥ. Wave 4 ended at 2,007. Why the co
NSE:ANANDRATHI
by WaveXplorer
3
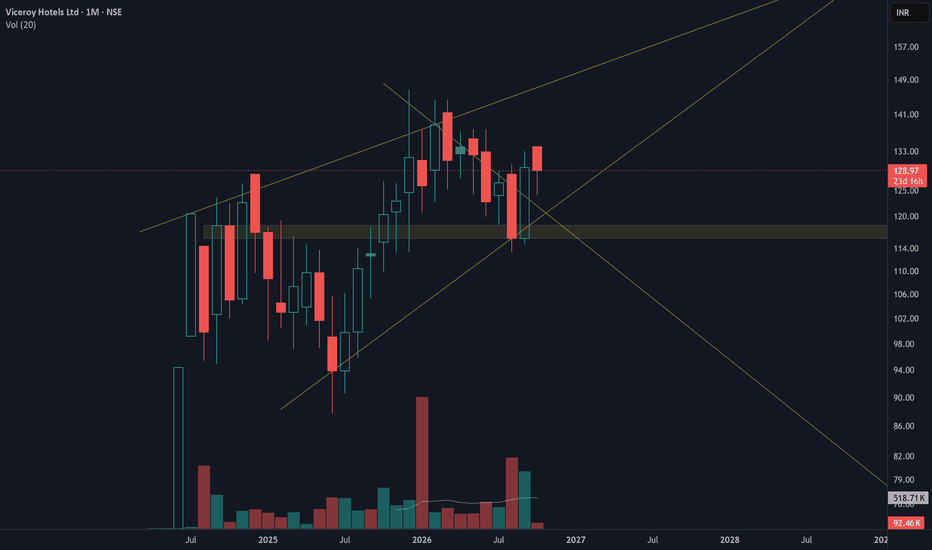
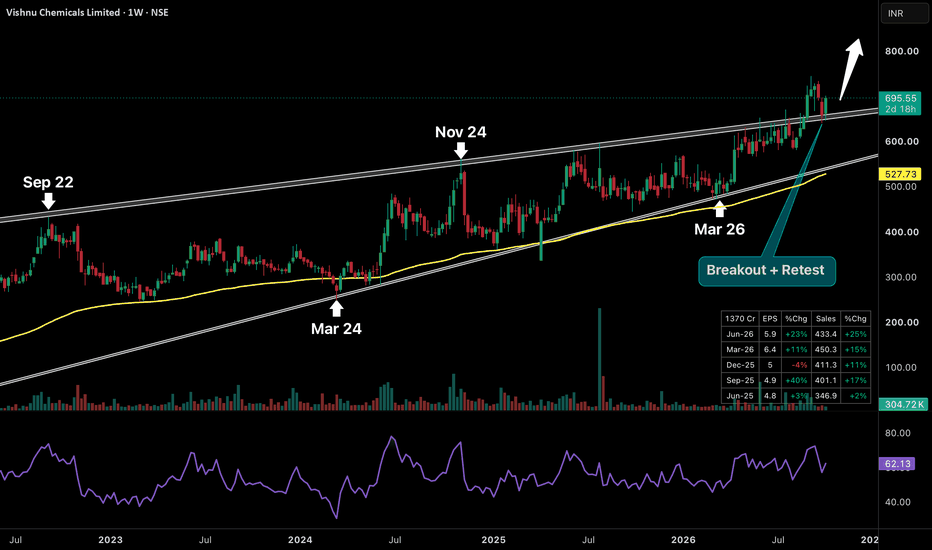
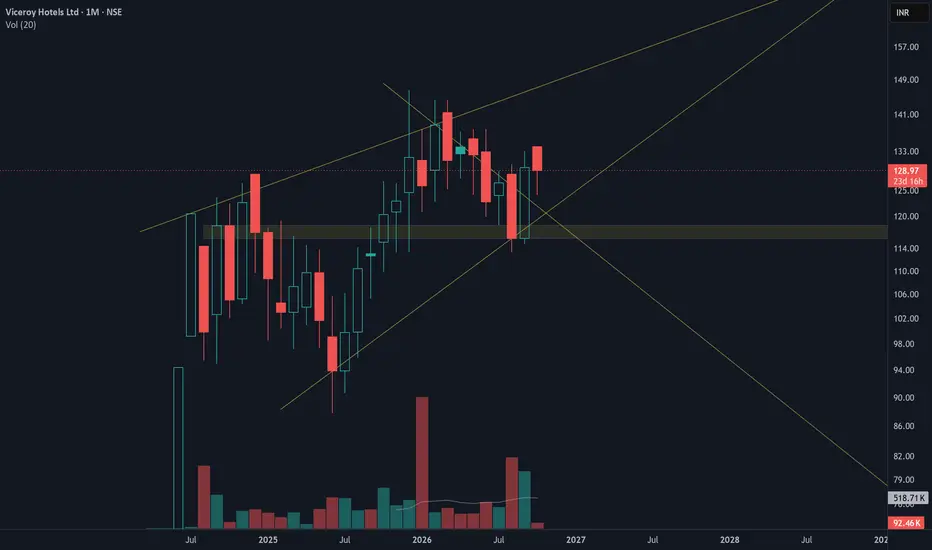
No Vacancy for Bearishness!Price Dynamics: The chart shows a solid pattern of higher highs and higher lows, culminating in a decisive breakout above the descending counter-trendline which signals bullish momentum. Volume Analysis: A notable surge in buying volume accompanies the breakout, confirming strong participant interest and validating the structural shift. Supply and Demand: A key flip has occurred where the previous overhead supply zone now successfully acts as a reliable support floor, indicating absorption of
NSE:VHLTDLong
by Knox1411
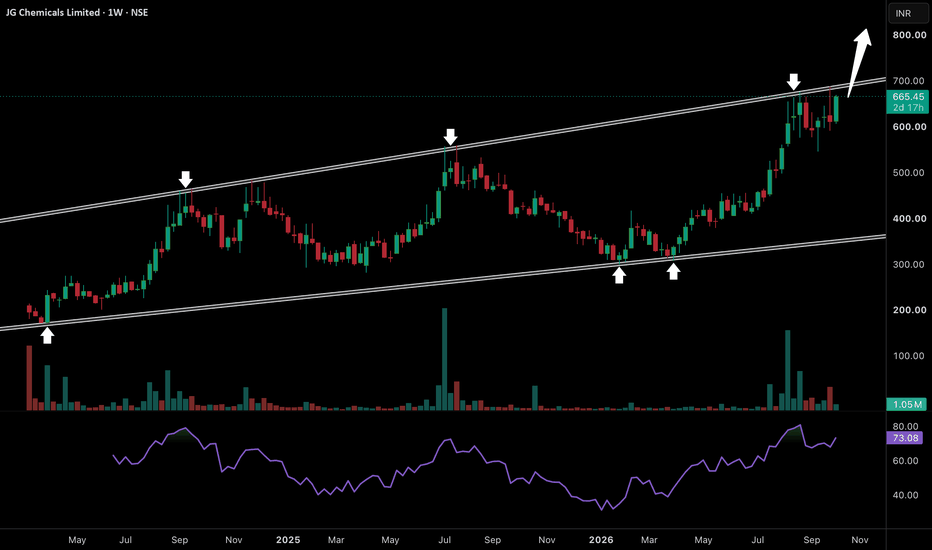
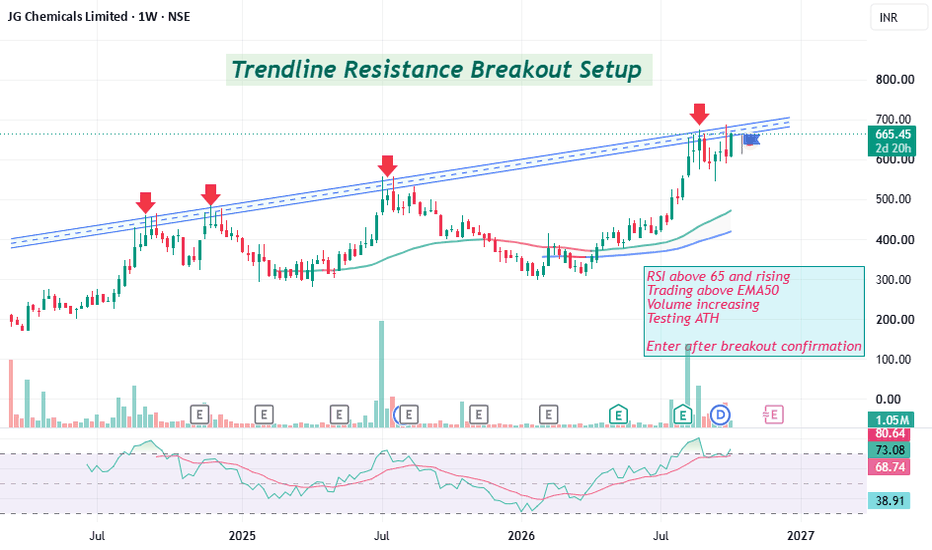
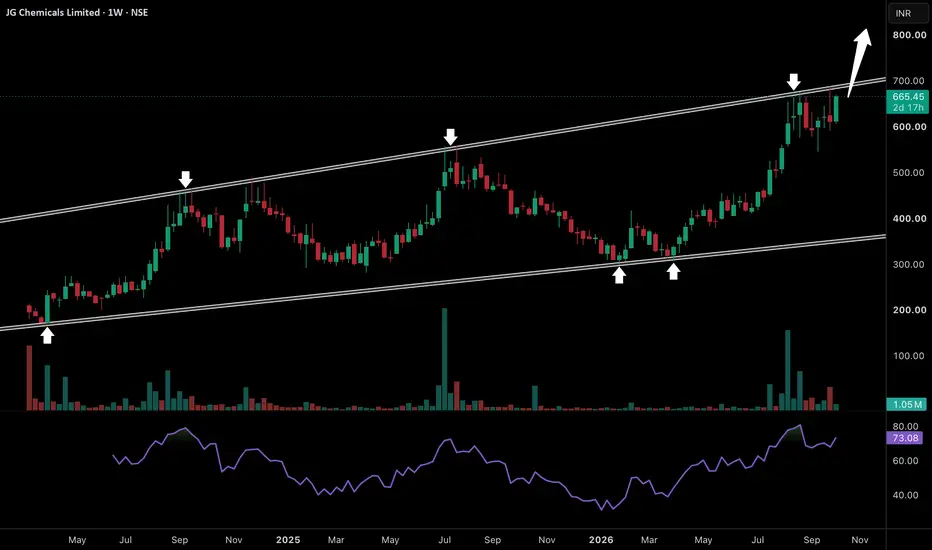
JG Chemicals Is Getting Ready For A Fresh All-Time HighJG Chemicals has been moving inside this large rising channel since listing and the reactions from both boundaries have been extremely clean. Every major test of the lower trendline has attracted buyers while the upper trendline has repeatedly created profit booking. But this time the structure looks much stronger. After bouncing from the lower channel near 300 the stock has almost doubled and returned to the 680–700 resistance zone with strong momentum. Even after the recent rejection buyers di
NSE:JGCHEMLong
by Marketik
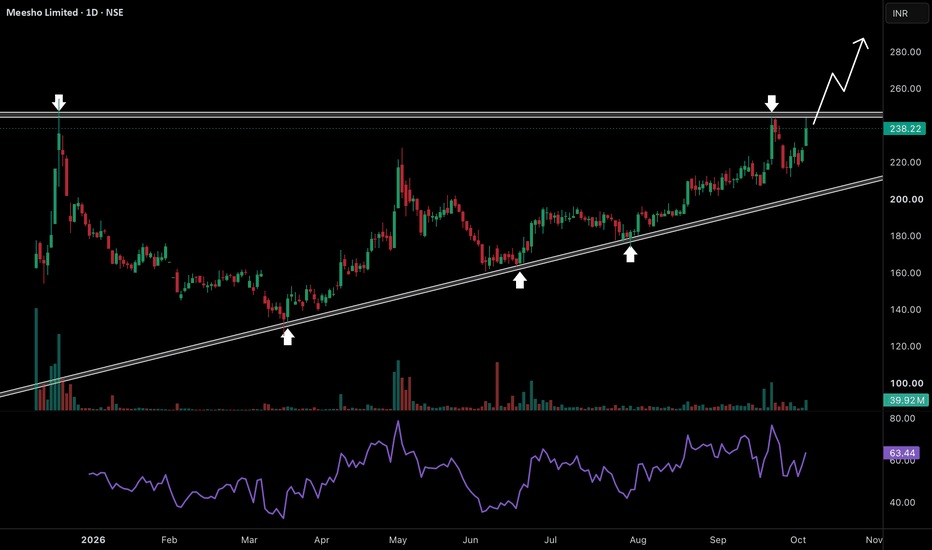
Meesho Is One Breakout Away From Entering Price DiscoveryMeesho is back near the 245–250 zone where the stock faced heavy selling soon after listing and again got rejected recently. But the structure underneath has changed completely. Since the March bottom price has consistently formed higher lows along the rising trendline and every correction towards this support has attracted buyers. Even the latest rejection from 250 failed to create any major weakness. Buyers absorbed the fall quickly and pushed price straight back towards the same resistance. T
NSE:MEESHOLong
by Marketik
1
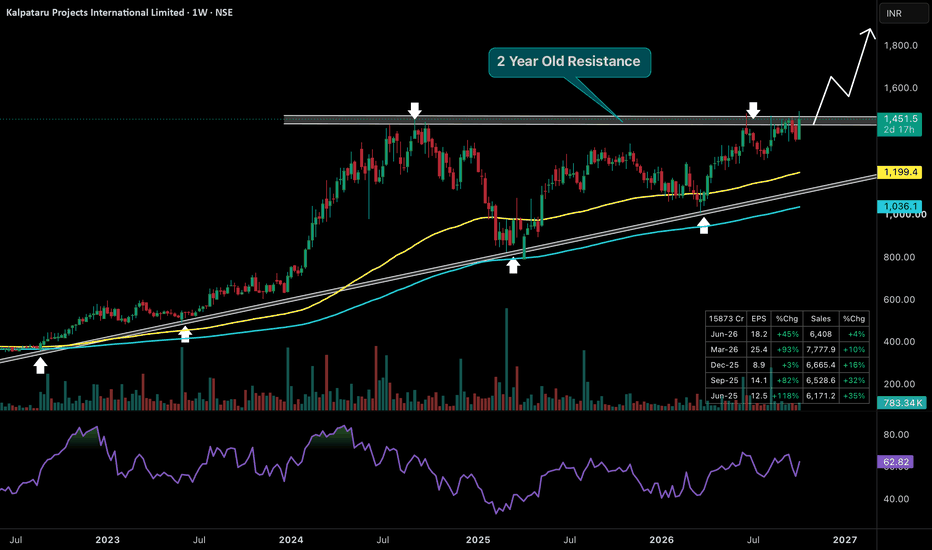
This 2-Year Breakout Can Start The Next Major RallyThe stock is again knocking at the 1400–1450 resistance zone that has capped the stock for almost two years. What makes this attempt different is the structure underneath. Every major correction has been bought near the rising trendline while price continues to form higher lows. The 100 EMA near 1200 and 200 EMA near 1035 are also rising strongly below price which keeps the larger trend firmly bullish. Even after repeated rejection from this resistance the stock has refused to break its structur
NSE:KPILLong
by Marketik
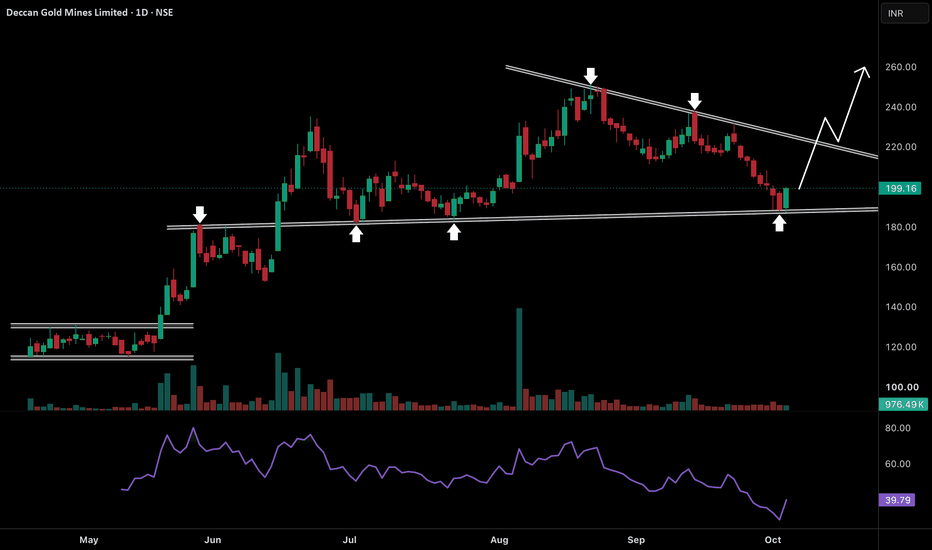
This Support Can Trigger The Next Strong ReversalThe stock is sitting at a very important support zone around 180–185. This level has already proved its strength multiple times. It first acted as resistance during the June breakout and after getting crossed the same area turned into support with buyers stepping in around July and August. Price has now returned to this zone once again after a steady correction from the 250 area and we are already seeing a strong rejection. This shows sellers are losing momentum exactly where buyers have histori
NSE:DECNGOLDLong
by Marketik
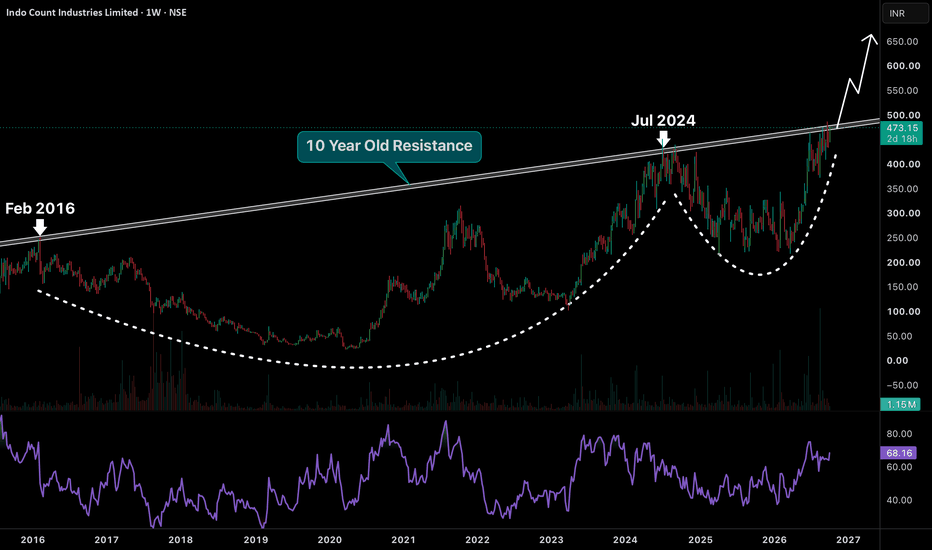
A 10-Year Breakout Can Start A Completely New CycleIndo Count is now testing a resistance that has controlled the stock for almost 10 years. The bigger structure makes this setup even more interesting. Price spent years forming a huge rounding base after the 2016 peak and then returned to the same long-term resistance in July 2024. That attempt failed but instead of entering another major downtrend the stock formed a much smaller rounded base and came back strongly. This shows the correction cycle is getting shorter while buyers are returning mu
NSE:ICILLong
by Marketik
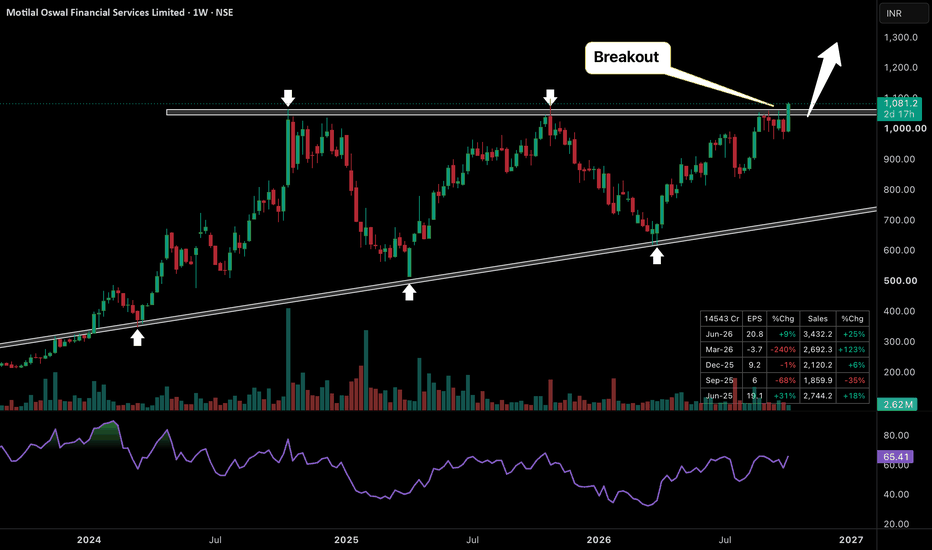
Motilal Oswal Is Entering A New Bullish PhaseThe stock has finally broken above the 1050–1070 resistance zone that stopped the stock multiple times over the last two years. Every major correction during this period was absorbed near the rising trendline and each important low formed higher than the previous one. This was a clear sign that buyers were not leaving the stock. Instead supply near the highs was slowly getting absorbed while the broader structure kept getting stronger. Now price has pushed through the same zone where previous ra
NSE:MOTILALOFSLong
by Marketik
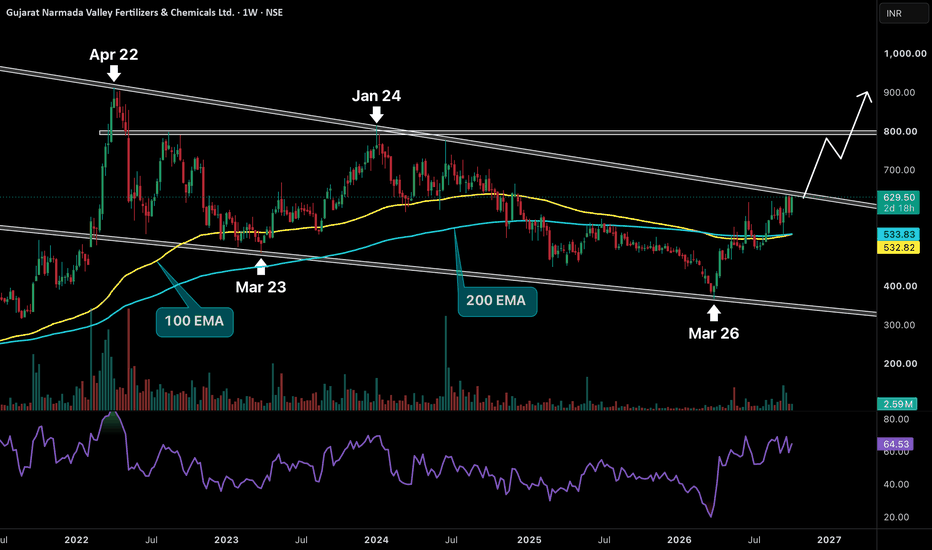
This 4-Year Downtrend Is Finally Running Out Of ControlGNFC is reaching one of its most important zones in years. Since the April 2022 peak the stock has remained inside a large falling channel with the upper trendline rejecting price again around Jan 2024. But the structure near the March 2026 bottom looks completely different. Price reversed sharply from the lower boundary and has now reclaimed both the 100 EMA and 200 EMA near 533. Both averages are also converging which shows the long-term weakness is fading while buyers are slowly taking contro
NSE:GNFCLong
by Marketik
A Multi-Year Breakout Is Now Turning Into Fresh MomentumThe stock has finally moved above a resistance line that controlled the stock for almost 4 years. The importance of this line is very clear from the chart. Price faced rejection around the same trendline in Sep 2022 and Nov 2024 while every major correction continued to form higher lows. At the same time the 100 EMA shown by the yellow line kept rising steadily and acted as the long-term trend support. This combination of rising support and repeated pressure on resistance shows that buyers were
NSE:VISHNULong
by Marketik
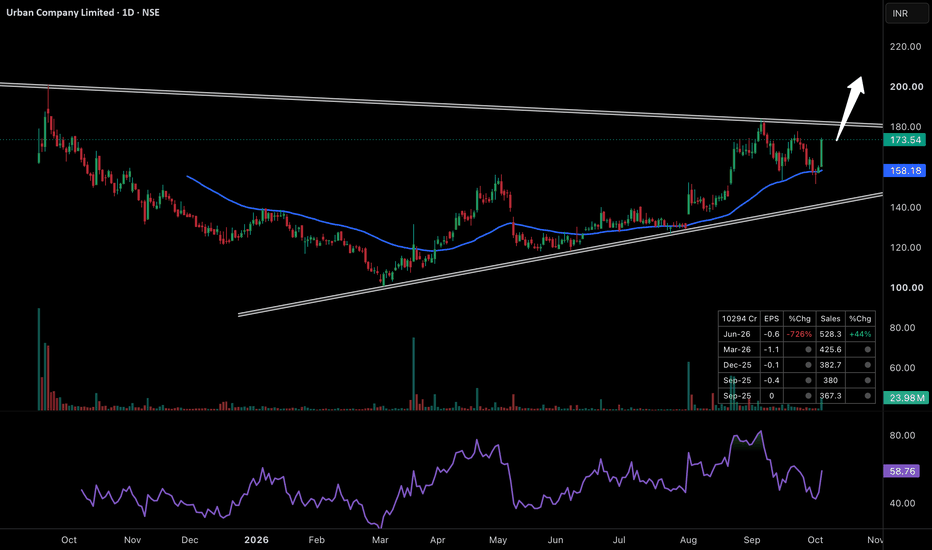
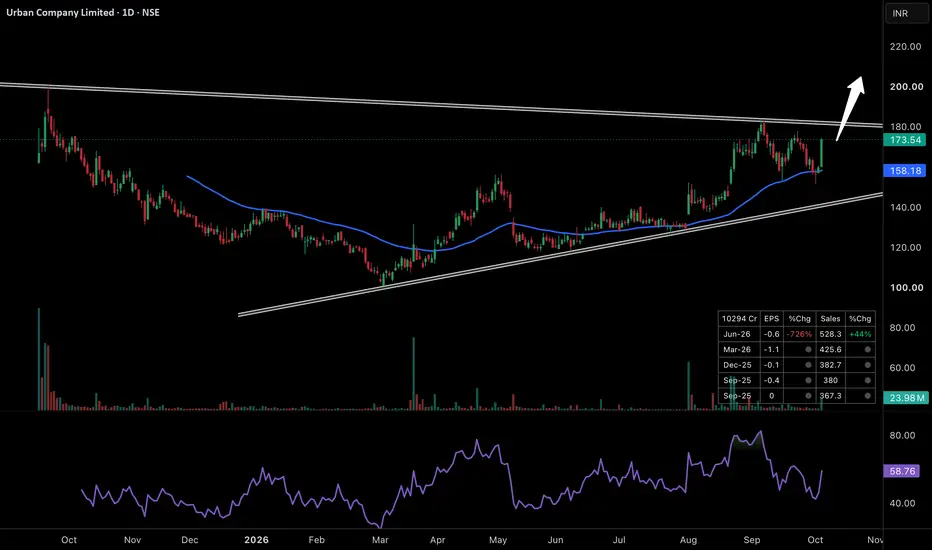
This Compression Is Building Pressure For A Bigger Expansion Urban Company is forming a large symmetrical triangle where price has been making higher lows while repeatedly facing supply from the falling trendline near the 178–182 zone. The important part is how the structure has changed internally. Buyers are now defending dips much higher than before and price has again bounced strongly from the rising support and moving average zone. Every rejection from the upper trendline has become smaller while price keeps coming back to test it. This usually show
NSE:URBANCOLong
by Marketik
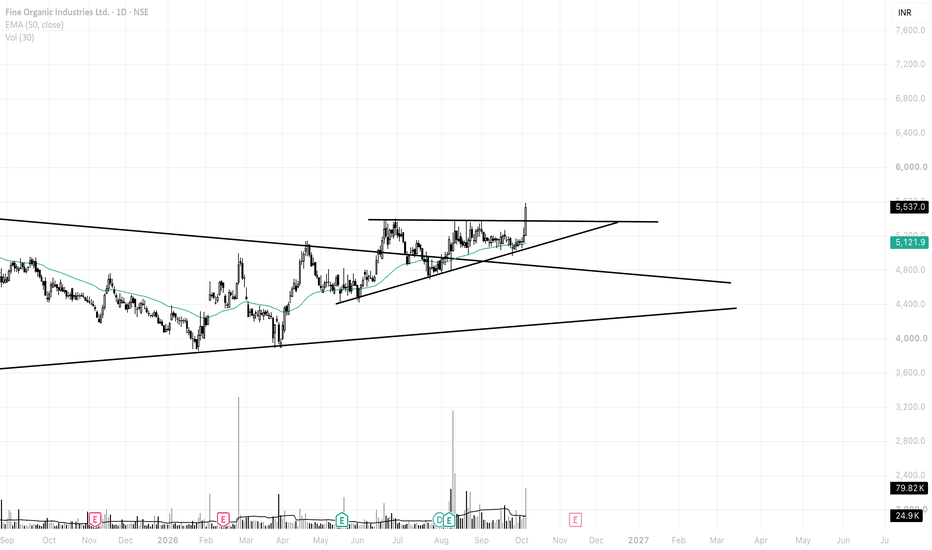
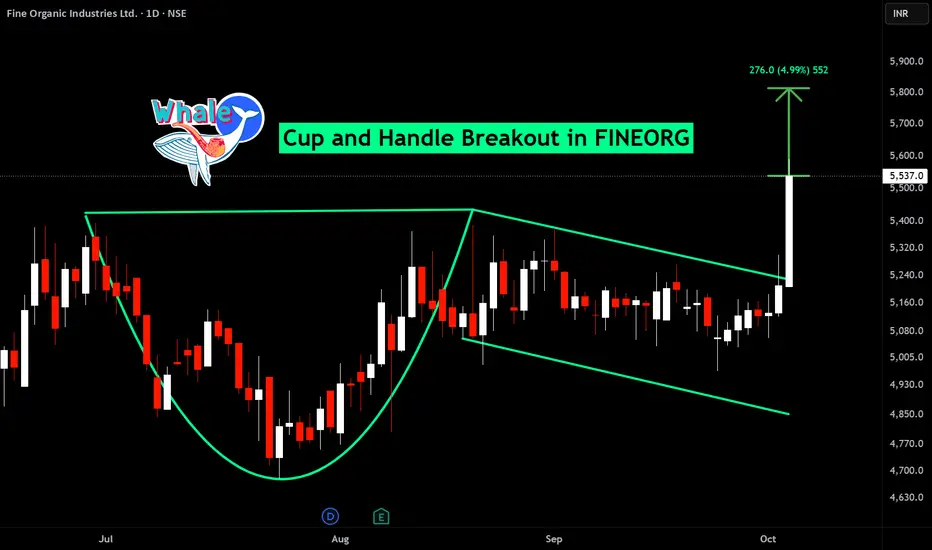
FINEORG - Big Move Started ??FINEORG has been forming symmetrical triangle pattern for 2 years. After breaking out from the symmetrical triangle pattern it formed as ascending Triangle pattern. It finally broke out from the resistance with clear volume. Keep the SL below 5000. Expect a minimum 30% target
NSE:FINEORGLong
00:44
by a_boy_has_no_name_
Breakout Soon in JG Chemicals Trendline Resistance Breakout Setup RSI above 65 and rising Trading above EMA50 Volume increasing Testing ATH Enter after breakout confirmation Disc: for study, not a recommendation
NSE:JGCHEMLong
by plus_charts
BUY TODAY SELL TOMORROW for 5%DON’T HAVE TIME TO MANAGE YOUR TRADES? - Take BTST trades at 3:25 pm every day - Try to exit by taking 4-7% profit of each trade - SL can also be maintained as closing below the low of the breakout candle Now, why do I prefer BTST over swing trades? The primary reason is that I have observed that 90% of the stocks give most of the movement in just 1-2 days and the rest of the time they either consolidate or fall Cup and Handle breakout in FINEORG BUY TODAY SELL TOMORROW for 5%
NSE:FINEORG
by Kapil-Mittal
2
BUY TODAY SELL TOMORROW for 5%DON’T HAVE TIME TO MANAGE YOUR TRADES? - Take BTST trades at 3:25 pm every day - Try to exit by taking 4-7% profit of each trade - SL can also be maintained as closing below the low of the breakout candle Now, why do I prefer BTST over swing trades? The primary reason is that I have observed that 90% of the stocks give most of the movement in just 1-2 days and the rest of the time they either consolidate or fall Roundbottom breakout in PARAGMILK BUY TODAY SELL TOMORROW for 5%
NSE:PARAGMILK
by Kapil-Mittal
2
Urban Company (D): PATTERN BREAKOUTTimeframe: Daily | Chart Scale: Linear Explosive +8.74% surge today backed by a massive 23.98M volume spike! 🔥 Technical Highlights: ✅ Chart Pattern: Decisive breakout from a descending triangle consolidation. ✅ Volume Reversal: Volume rising over the past couple of days, breaking a recent dry spell. ✅ Momentum: Weekly EMAs in positive crossover. MACD & RSI rising (Daily/Weekly). 🚀 Key Levels to Watch: 🎯 Target: 183 🛡️ Support / Pullback: 169 (Previous triangle resist
NSE:URBANCO
by Learn_with_Pth0mas
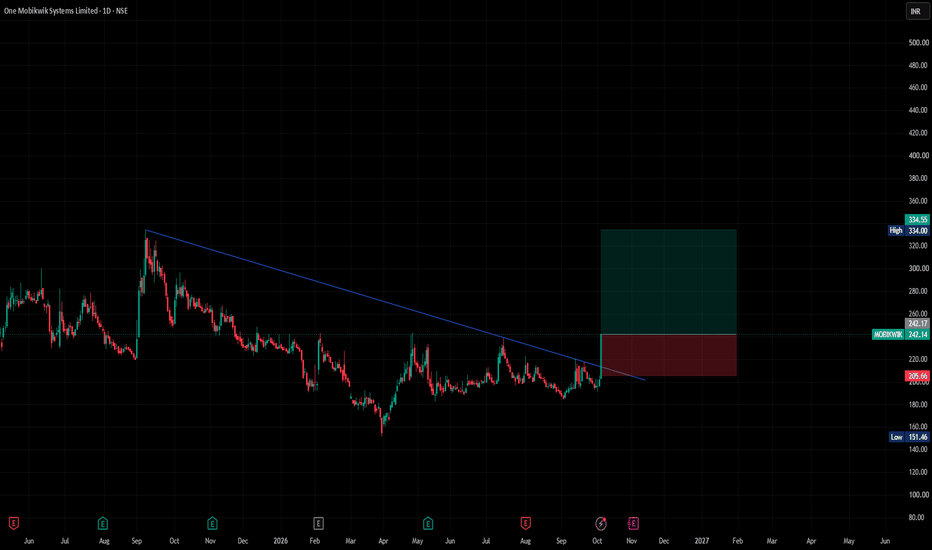
MOBIKWIKTechnical Analysis & Trade Setup Symbol: MOBIKWIK (One Mobikwik Systems Limited) — Daily Timeframe (NSE) Current Price: ₹242.14 (-1.61% intraday move) Market Structure: Following an extended corrective downtrend from prior highs down to the macro base low of ₹151.46, the stock completed a multi-month rounding bottom accumulation phase. Price logged a strong expansion candle, decisively breaking out above its long-term descending blue trendline slope resistance. Key Technical Trade Levels En
NSE:MOBIKWIKLong
by QuantumX-Pro
Reliance Shows Strong Short-Term RecoveryHighlights Reliance is trading around the ₹1,210–₹1,220 zone after a strong rebound. Short-term momentum has improved considerably, although the stock is still below its major 100-day and 200-day moving averages. - Immediate resistance is around ₹1,225–₹1,240. A sustained move above ₹1,240 could push the stock towards ₹1,260–₹1,280, which is the more important medium-term resistance zone. On the downside, ₹1,195–₹1,205 is the immediate support area, followed by stronger support around
NSE:RELIANCE
by yogeshwar
123456789101112131415161718192021222324252627282930313233343536373839404142
…999

Made by humans

Select market data provided by ICE Data Services. Select reference data provided by FactSet. Copyright © 2026 FactSet Research Systems Inc.Copyright © 2026, American Bankers Association. CUSIP Database provided by FactSet Research Systems Inc. All rights reserved. SEC filings and other documents provided by Quartr.© 2026 TradingView, Inc.

SOC 2 CompliantGDPR Compliant
More than a product
  • Supercharts
Screeners
  • Stocks
  • ETFs
  • Bonds
  • Crypto coins
  • CEX pairs
  • DEX pairs
  • Pine
Heatmaps
  • Stocks
  • ETFs
  • Crypto coins
Calendars
  • Economic
  • Earnings
  • Dividends
  • IPOs
More products
  • News Flow
  • Portfolios
  • Fundamental Graphs
  • Yield Curves
  • Options
  • Macro Maps
  • Pine Script®
  • MCP Server
Apps
  • Mobile
  • Desktop
Community
  • Social network
  • Wall of Love
  • Refer a friend
  • Creator program
  • House Rules
  • Moderators
Ideas
  • Trading
  • Education
  • Editors' picks
Pine Script
  • Indicators & strategies
  • Wizards
  • Freelancers
  • Marketplace
Tools & subscriptions
  • Features
  • Pricing
  • Market data
  • Gift plans
Trading
  • Overview
  • Brokers
  • Brokers comparison
  • The Leap
Special offers
  • CME Group futures
  • Eurex futures
  • US stocks bundle
About company
  • Who we are
  • Space mission
  • Blog
  • Help Center
  • Careers
  • Media kit
Merch
  • Tarot cards for traders
  • The C63 TradeTime
Policies & security
  • Terms of Use
  • Disclaimer
  • Privacy Policy
  • Cookies Policy
  • Accessibility Statement
  • Trust Center
  • Security tips
  • Bug Bounty program
  • Status page
Business solutions
  • Widgets
  • Charting libraries
  • Lightweight Charts™
  • Advanced Charts
  • Trading Platform
Growth opportunities
  • Advertising
  • Brokerage integration
  • Partner program
  • Education program
Community
  • Social network
  • Wall of Love
  • Refer a friend
  • Creator program
  • House Rules
  • Moderators
Ideas
  • Trading
  • Education
  • Editors' picks
Pine Script
  • Indicators & strategies
  • Wizards
  • Freelancers
  • Marketplace
Business solutions
  • Widgets
  • Charting libraries
  • Lightweight Charts™
  • Advanced Charts
  • Trading Platform
Growth opportunities
  • Advertising
  • Brokerage integration
  • Partner program
  • Education program
Look FirstLook First