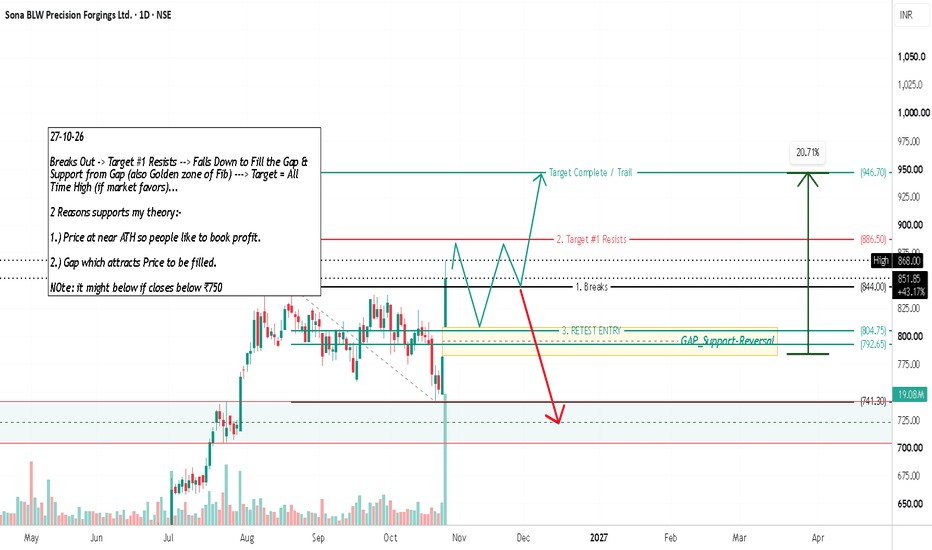

Sona BLW – Daily Analysis – Up to 20% UPSIDE Potential.NSE:SONACOMS
Breaks Out -> Target #1 Resists --> Falls Down to Fill the Gap & Support from Gap (also Golden zone of Fib) ---> Target = All Time High (if market favors)...
2 Reasons supports my theory:-
Price at near ATH so people like to book profit.
Gap which attracts Price to be filled.
Sona BLW Precision Forgings Ltd. is displaying strong bullish momentum on the daily chart following a sharp impulsive breakout move from its lower consolidation base at ₹741.30 . Currently t
Option TradingIntraday trading involves buying and selling financial instruments within the same trading session, with all positions closed before the market ends. Traders aim to take advantage of short-term price fluctuations using fast decision-making and technical analysis. Intraday trading is highly active and often relies on chart patterns, volume analysis, momentum indicators, and market news to identify quick trading opportunities.
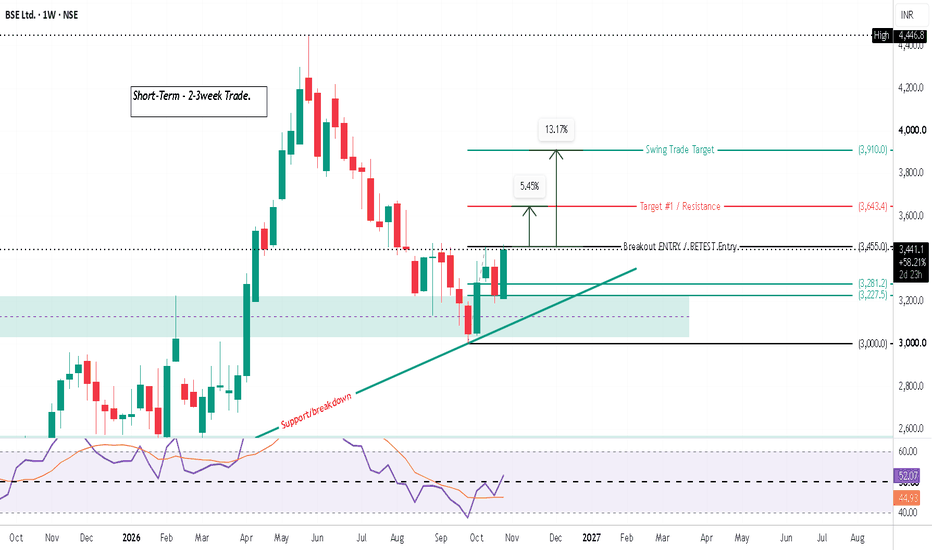
BSE Ltd. – Weekly Analysis – Up to 13.17% UPSIDE Potential..NSE:BSE
**BSE Limited** is exhibiting strong short-term momentum on the weekly chart, structured as a **Short-Term - 2-3week Trade** setup following a robust recovery off its ascending trendline support (). Currently trading at **₹3,441.10** (+6.51%), price has rallied past immediate support levels and is testing the critical **Breakout ENTRY / RETEST Entry** threshold at **₹3,455.00**.
---
### **🔹 PATTERN: ASCENDING TRENDLINE & BREAKOUT RETEST**
* **Ascending Trendline Support:** A strong
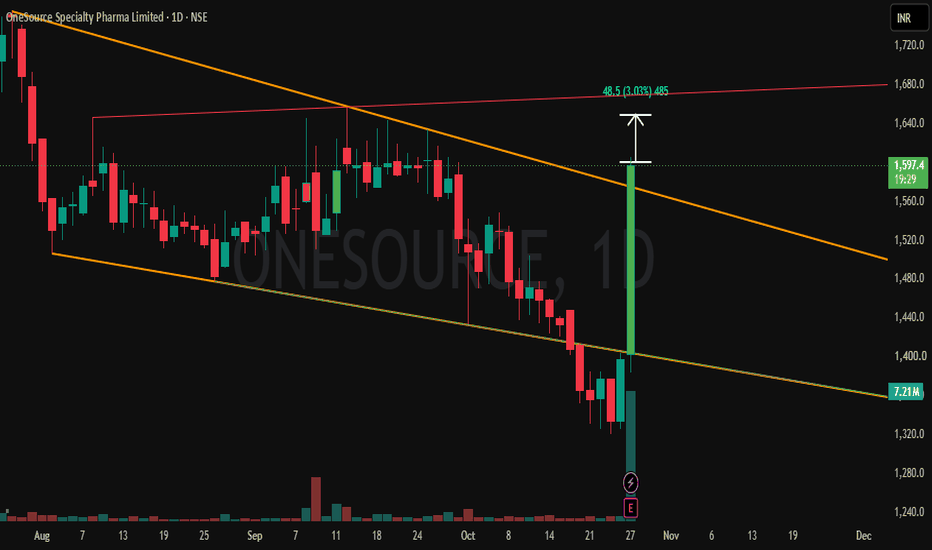
Buy Today, Sell Tomorrow for 3-5% - Daily Breakout SetupONESOURCE — BTST BREAKOUT SETUP
Entry, Stop Loss & Targets Are Clearly Defined — Helping You Plan Your Trade With Confidence.
A bullish breakout has appeared on the 1D timeframe with positive price action and strong volume expansion.
🔄 Trade Type: BTST
────────────────────
🎯 TRADE LEVELS
ENTRY: ₹1599
🛑 STOP LOSS
₹1545
🎯 TARGETS
3–5%
────────────────────
📈 VOLUME
Volume: 7.15M
Volume Strength: Good
────────────────────
⏱ Timeframe: 1 Day
📌 Trade Entry: Take the trade only after 3:15
COFORGE – Multi-Year Breakout Watch
Timeframe: Weekly (1W)
Coforge is retesting its multi-year resistance zone around ₹1,980–₹2,010. A decisive weekly close above this zone could signal a potential long-term breakout.
📈 **Trade Setup**
- Entry:Above ₹2,010 after a confirmed breakout and successful retest
- Stop Loss:** ₹1,880 (indicative; adjust to price structure)
- Target 1: ₹2,150
- Target 2: ₹2,300
- Target 3: ₹2,450
**Indicators & Confirmation**
- EMA 7, 14, 21, 50 and 200: Price is above all key EMAs.
- RSI (14): Around
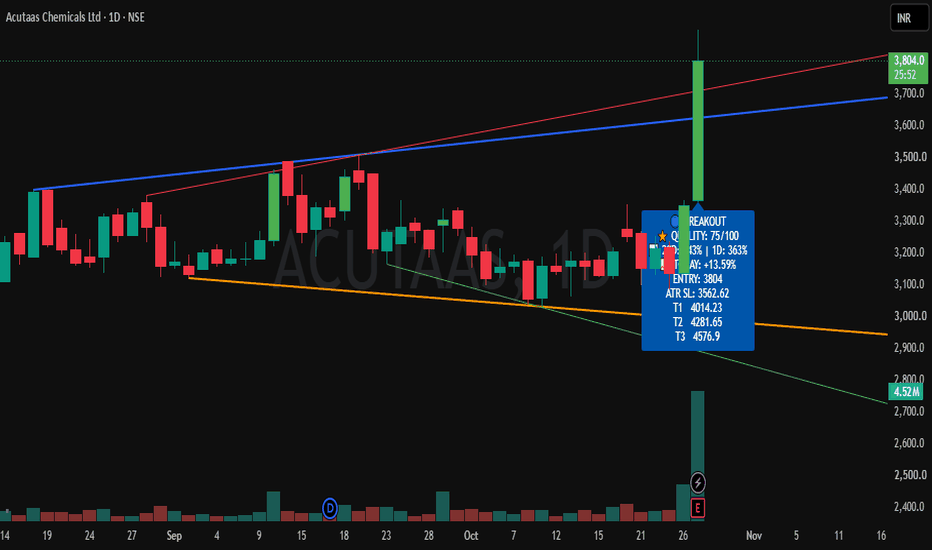
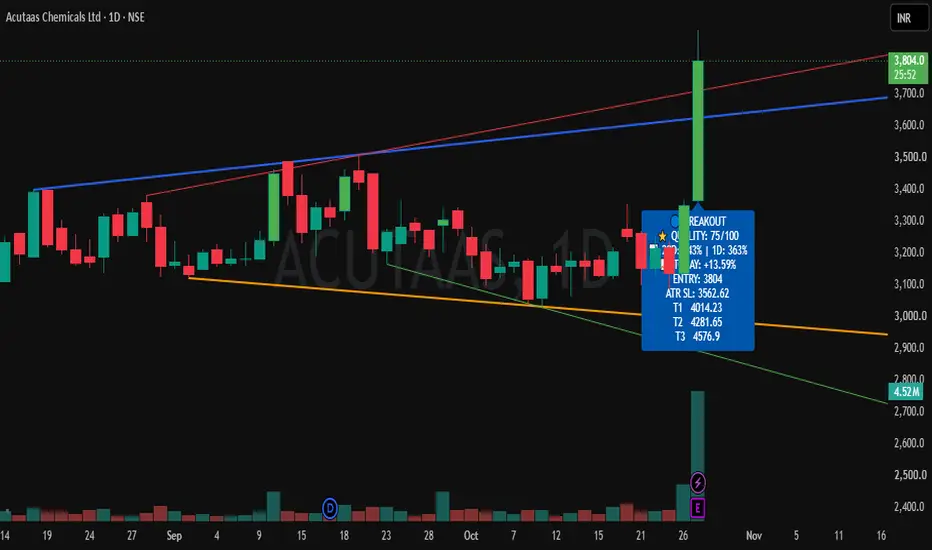
Buy Today, Sell Tomorrow for 3-5% - Daily Breakout SetupACUTAAS — BTST BREAKOUT SETUP
Entry, Stop Loss & Targets Are Clearly Defined — Helping You Plan Your Trade With Confidence.
📊 Stock Strength: 75/100
(Note: Higher score indicates stronger stock conditions, not guaranteed returns.)
A bullish breakout has appeared on the 1D timeframe with positive price action and strong volume expansion.
🔄 Trade Type: BTST
────────────────────
🎯 TRADE LEVELS
ENTRY: ₹3813
🛑 STOP LOSS
ATR SL: ₹3572
🎯 TARGETS
3–5%
────────────────────
📈 VOLUME
20D Volume:
Connecting the Signals!Pattern Structure: The chart displays a robust sequence of higher highs and higher lows, culminating in a decisive breakout above the descending counter-trendline.
Volume Analysis: A notable surge in buying activity accompanies this move, validating the strength of the reversal.
Supply and Demand: Previous resistance zones are actively shifting roles, with former supply levels now acting as a supportive foundation for further upside.
Risk Management: Capital preservation remains critical; imp
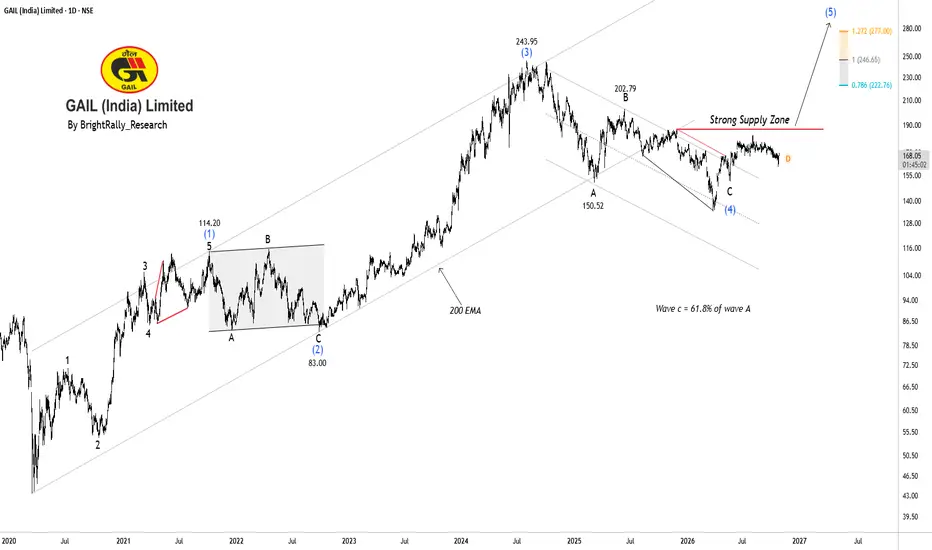
GAIL India: Bullish Breakout Ahead?GAIL (India) Limited is currently trading around ₹168 and appears to be in a correction after a strong rally to ₹244. The stock is showing signs of a possible recovery, but buying momentum remains weak. As per the Elliott Wave pattern, the correction may be nearing completion, opening the possibility of another upward move.
The key resistance is placed at ₹190. A sustained breakout above this level could push the stock towards ₹203, followed by ₹223 and ₹247 in the coming months. However, the s
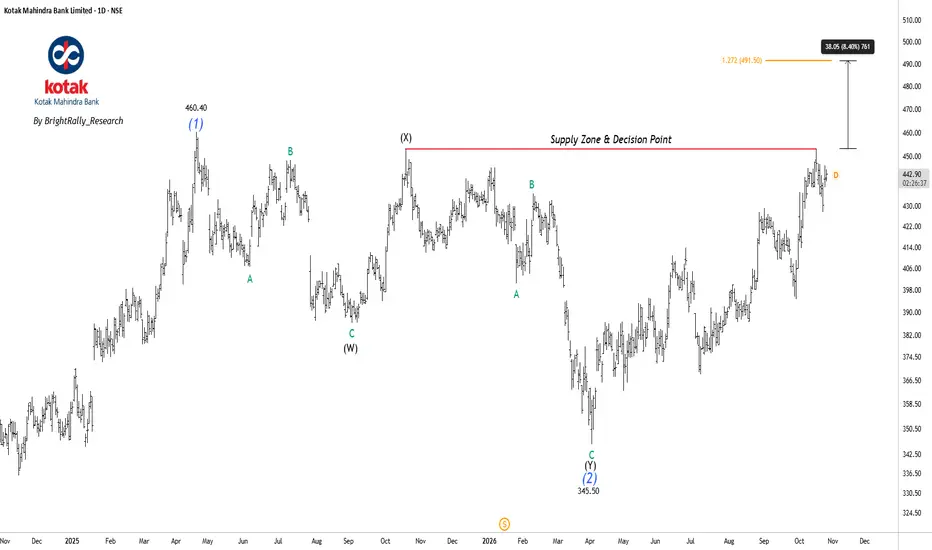
Kotak Mahindra Bank: Bullish Recovery SetupKotak Mahindra Bank is showing a strong recovery after finding support near ₹345.50. The stock has moved upward and is now approaching an important supply zone around ₹453, where selling pressure may emerge.
A breakout above ₹453 could strengthen the bullish momentum and open the possibility of a move toward the ₹491.50 target. However, if the stock faces rejection at this zone, it may consolidate before making another attempt. Traders should watch for a confirmed breakout before assuming furth
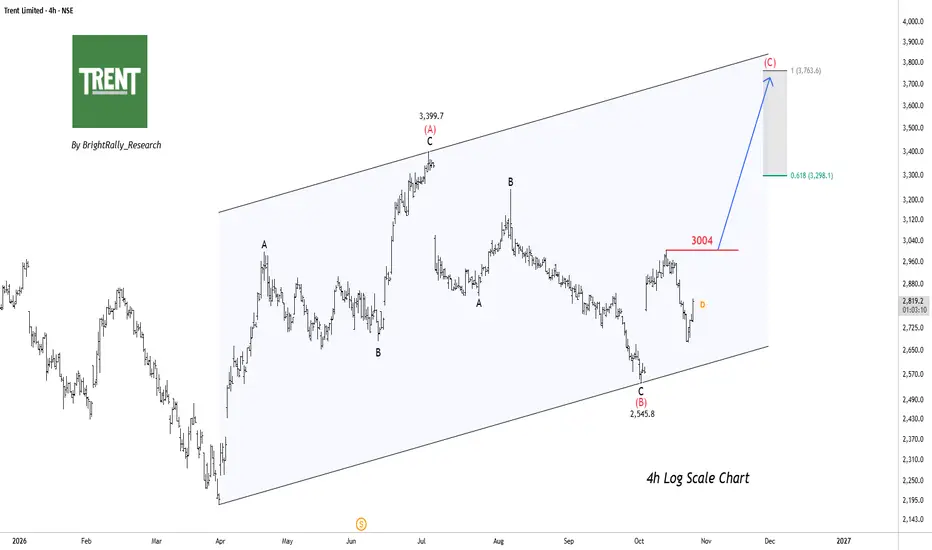
TRENT Limited: Bullish Recovery Setup With ₹3,763 TargetTrent Limited is trading within a rising parallel channel on the 4-hour log-scale chart, suggesting the broader structure remains bullish. The recent rebound from ₹2,545.8 indicates buying interest near the lower channel boundary, with the current price around ₹2,826.1.
The immediate resistance lies near ₹3,000, and a sustained breakout above this level could strengthen the recovery. If bullish momentum continues, the price may move toward the previous high of ₹3,399.7, although resistance alon
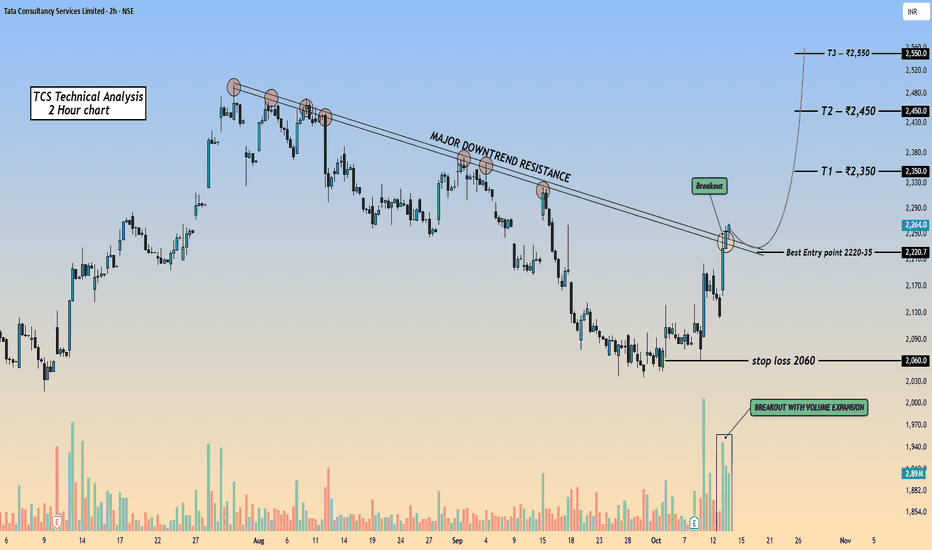
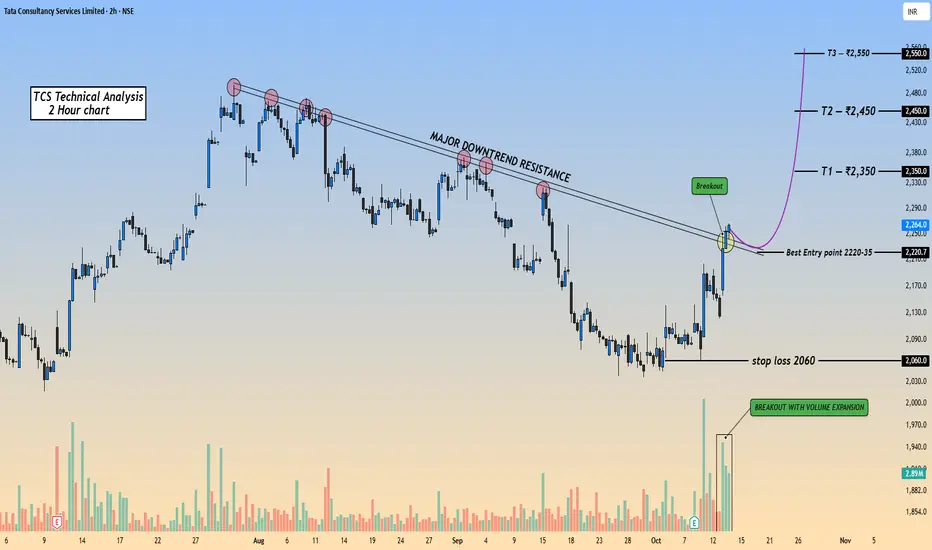
TCS Finally Breaking Its Downtrend? ₹2,350 Is The First TestTCS :— DOWNTREND BREAKOUT WATCH
TCS has been under pressure for quite some time, forming lower highs beneath a falling resistance trendline.
But now, price is attempting to break above that trendline, and the recent volume expansion makes this move worth watching.
I’m not calling it a confirmed long term reversal yet. The next important thing is to see whether TCS can hold the breakout zone on a retest.
WHY THIS SETUP IS INTERESTING 👀
Price is challenging a falling resistance that has
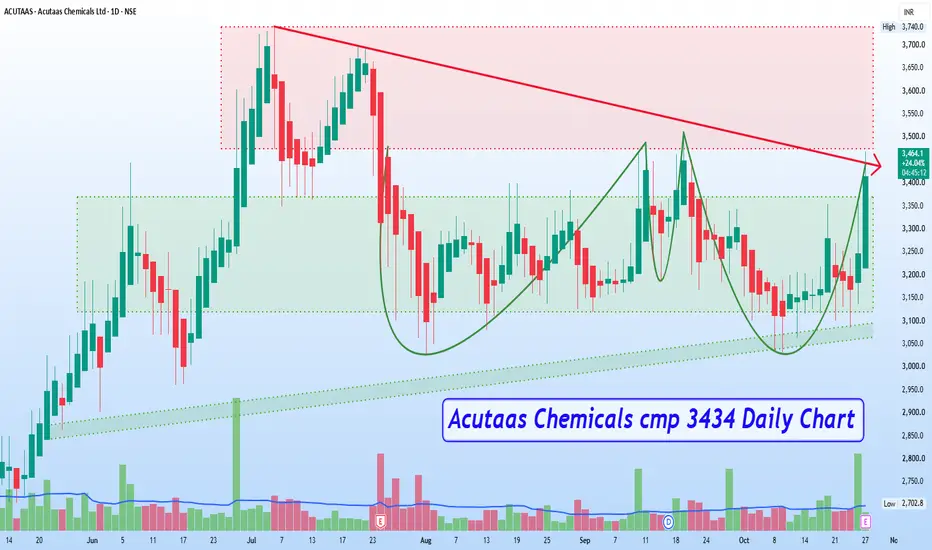
Acutaas Chemicals cmp 3434 Daily ChartAcutaas Chemicals cmp 3434 Daily Chart
- Support Zone 3120 to 3370 price band
- Resistance Zone 3475 to ATH 3740 price band
- Rising Support Trendline providing good shoulder
- Volumes spiking regularly by demand based buying
- Bullish Rounding Bottoms by Resistance Zone neckline
- Can we see a fresh upside breakout from Resistance Zone ???
MADHUSUDAN Daily Breakout Above Key Resistance ZoneThe daily chart for Madhusudan Masala reveals a significant technical breakout above a long-standing resistance level.
After a prolonged period of consolidation and a gradual recovery from the swing lows near 210, the stock has decisively cleared the critical resistance line marked around 258.90.
This breakout is accompanied by a strong bullish candle, indicating strong buyer interest.
Here is the technical breakdown for this setup:
Chart Analysis: The stock has formed a classic consolidation
KARURVYSYA Rounding Bottom Breakout Backed by Massive VolumeThe daily chart for Karur Vysya Bank Ltd. presents a strong bullish setup, having just completed a classic rounding bottom pattern.
The price action indicates a structural shift in momentum, shifting from a gradual accumulation phase into a decisive markup phase.
Key Chart Observations:
Pattern Breakout: The stock has successfully broken out and closed above the primary neckline resistance at 356.75.
Volume Confirmation: The breakout is heavily supported by a massive surge in volume over the
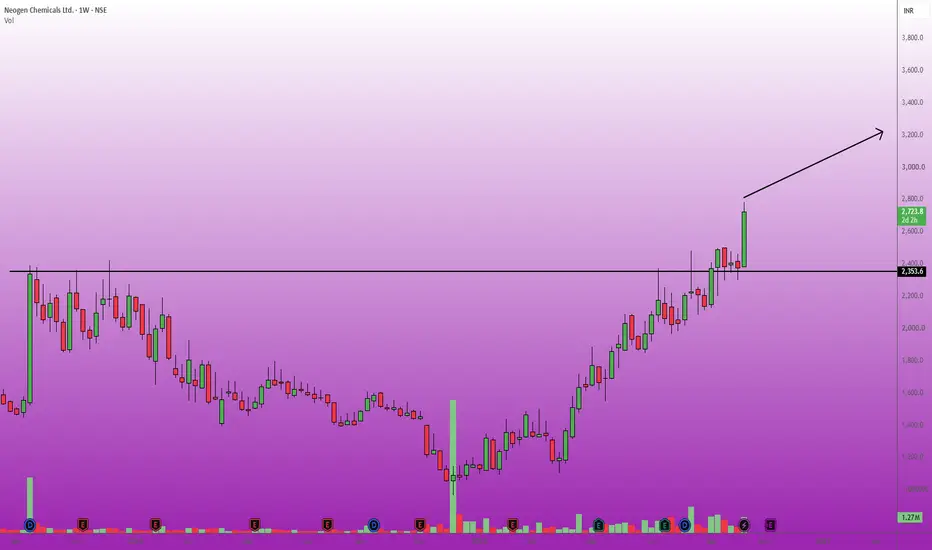
NEOGEN Strong Multi-Month Breakout Above Key ResistanceLooking at the weekly timeframe for Neogen Chemicals Ltd., the stock has demonstrated a powerful technical breakout.
The price has decisively crossed and closed above a major horizontal resistance line at 2,353.6.
This level previously acted as a strong ceiling, and overcoming it signifies a major shift in market structure from accumulation to markup.
The breakout is supported by a highly bullish weekly candlestick pushing the price to 2,723.4, marking a substantial gain of +14.52% for the pe
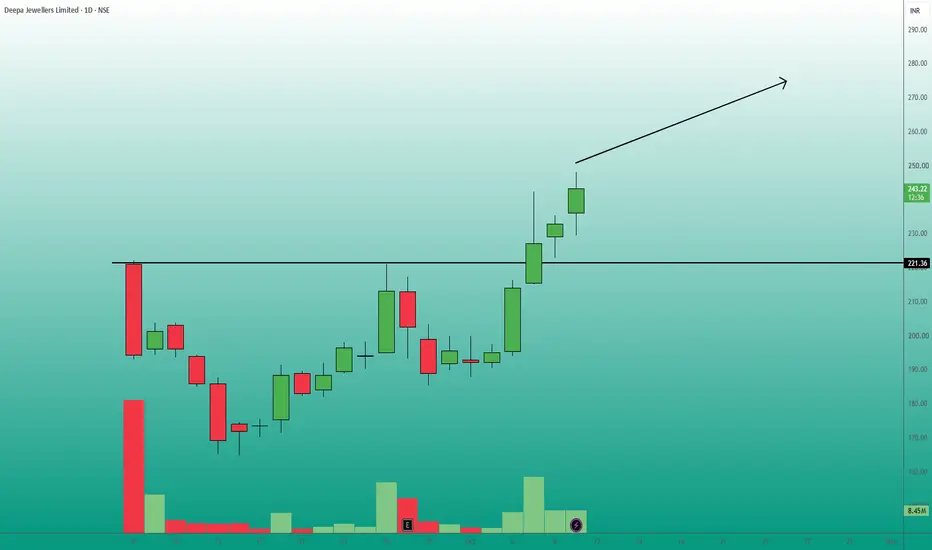
DEEPA Strong Bullish Breakout Above Key ResistanceLooking at the daily timeframe for Deepa Jewellers Limited, we are observing a compelling bullish setup.
The stock has successfully broken out of a consolidation phase, making it a strong candidate for a long position.
Technical Analysis & Reasoning:
To validate this setup, we are looking at two primary technical drivers:
Horizontal Resistance Breakout: The primary catalyst for this idea is the decisive breakout above the crucial resistance line at ₹221.20.
This level previously acted as a st
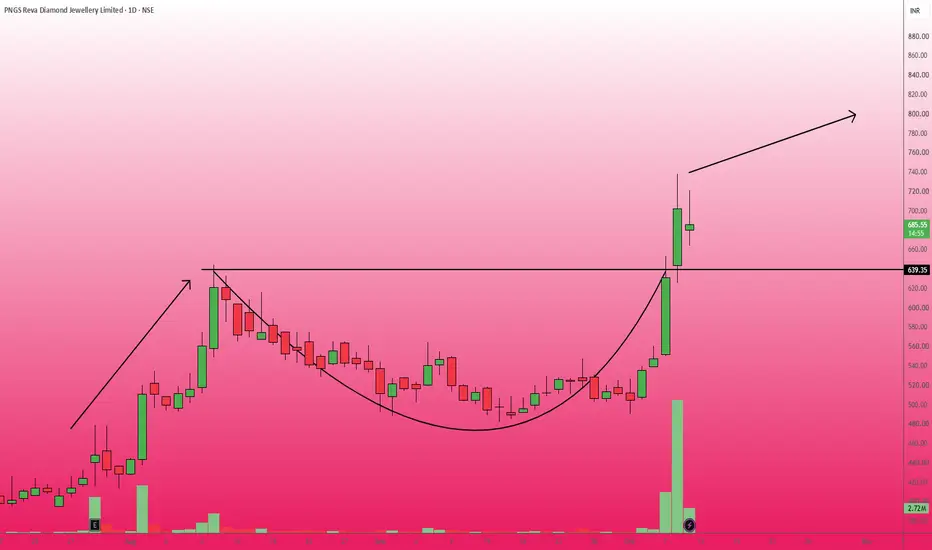
PNGSREVA Strong Volume Breakout from Rounding BottomChart Analysis & Reasoning:
As seen on the daily timeframe, PNGS has staged a powerful breakout from a multi-month rounding bottom (or "cup") pattern.
The neckline resistance was firmly established at the 639.35 level.
This recent breakout is highly significant because it is accompanied by a massive surge in buying volume (noted by the prominent green volume spike), signaling strong bullish conviction and market participation.
The price has comfortably cleared the resistance, transforming the 6
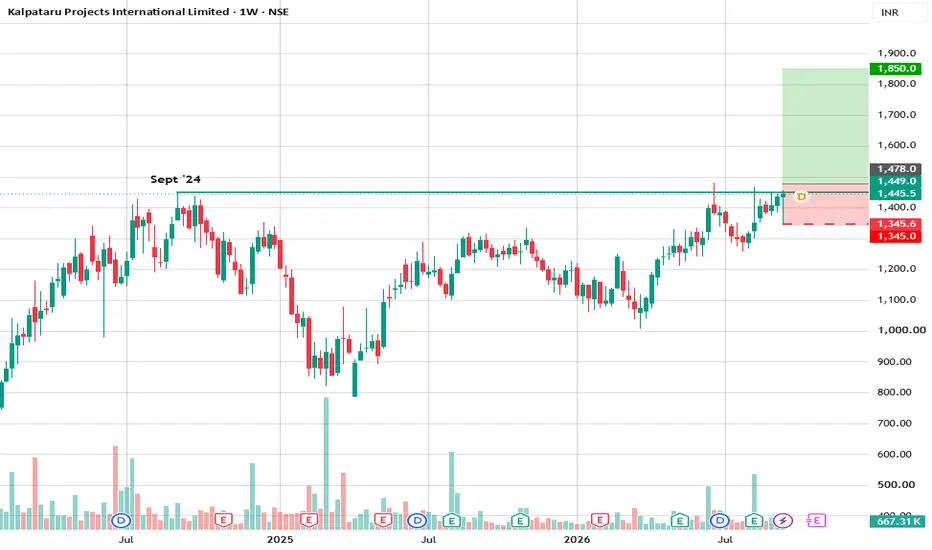
Testing ATH after 2 yearsIt is testing the ATH level once again after 2 years (a small attempt failed in June '26).
Considering the over all market conditions and the macro economic challenges we face, I would want the price to close above 1480 before me taking any position in this.
Also the SL in this case will be small (1345) and close by, since there is no point give it to much room to dance around. If it breaks out and sustains, then up is the only way forward.
Trailing the the price is best way forward, with pro
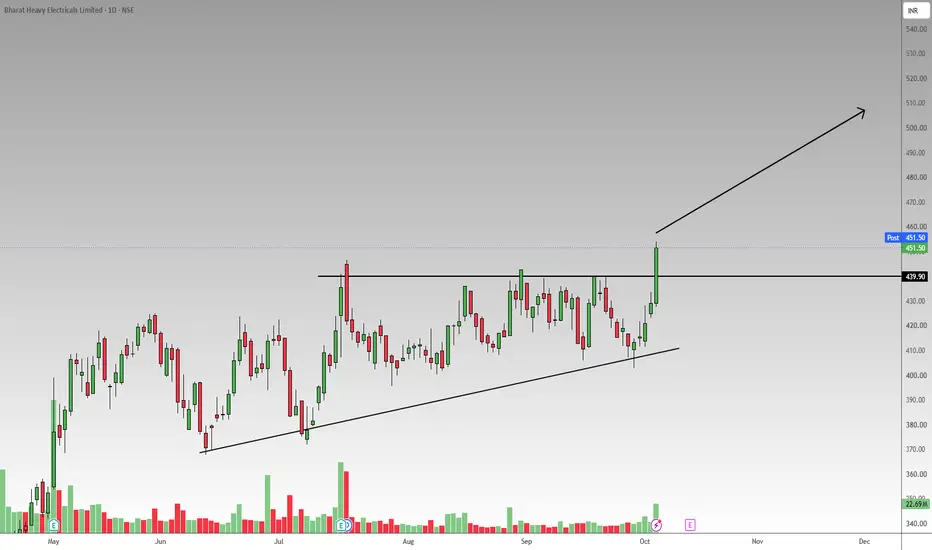
BHEL Strong Ascending Triangle BreakoutBased on the daily chart for Bharat Heavy Electricals Limited provided a clear bullish setup has materialized.
Technical Analysis & Reasoning:
Ascending Triangle Pattern: Since early June, the price action has steadily compressed, printing a series of higher lows along a well-defined, upward-sloping support trendline.
This accumulation pushed the price into a rigid horizontal resistance zone right at the 439.90 mark.
Confirmed Breakout: The most recent daily session resulted in a massive bulli
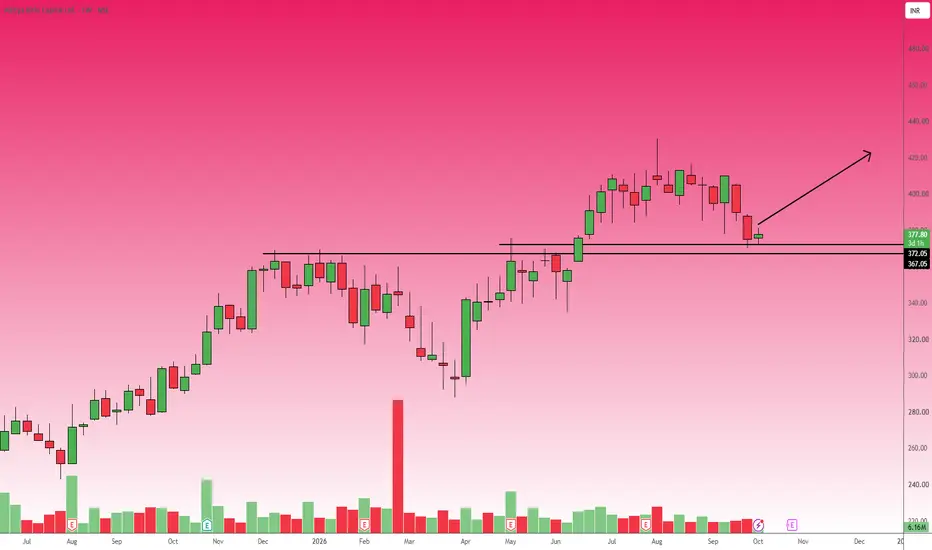
ABCAPITAL Retest of Previous Resistance as SupportThe weekly chart of Aditya Birla Capital Ltd. indicates a classic breakout and retest technical setup.
After a strong uptrend, the stock has experienced a pullback and is currently resting at a critical demand zone.
The horizontal black lines marked on the chart highlight a previous resistance area between 367.05 and 372.05, which is now acting as strong support based on the principle of polarity.
The current weekly candle shows the price stabilizing near 377.15, right above this key structura