• Products
  • Community
  • Markets
  • Brokers
  • More
Get started
  • Markets
  • /India
  • /Stocks
  • /Ideas
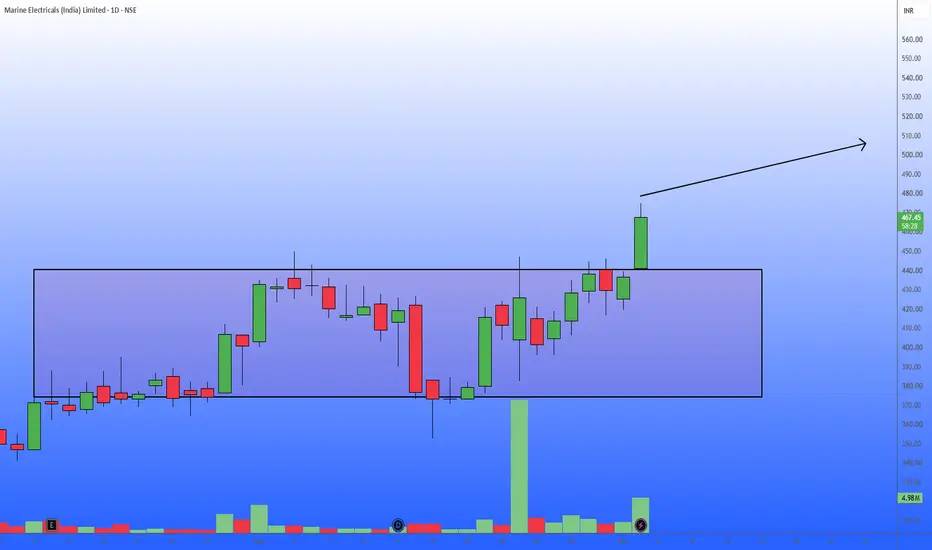
MARINE Bullish Breakout from Daily Consolidation ZoneMarine Electricals (India) Limited is showing a textbook breakout on the daily timeframe. For the past two months, the stock has been trading within a well-defined rectangular consolidation box, building a strong base between the ₹375 support and ₹440 resistance levels. Today's price action shows a decisive bullish breakout above the upper boundary of this box, closing near the day's high at ₹467.45. This move is backed by healthy volume, indicating strong buyer conviction. Additionally, the si
NSE:MARINE
by ParamjitMahapatro
Updated
LGEINDIA Bullish Breakout Above Multi-Month Resistance LevelLooking at the daily timeframe for LG Electronics India Limited, the stock has just staged a strong bullish breakout above a major horizontal resistance zone. For the past several months, the price has been consolidating, repeatedly testing the 1,740 level (notably in August and late September) but failing to sustain a move higher. Today, we are seeing a decisive breakout above the 1,740.6 mark, characterized by a strong bullish candle currently trading near 1,801. This price action confirms
NSE:LGEINDIA
by ParamjitMahapatro
Updated
AEQUS Weekly Breakout from Consolidation VolumeLooking at the weekly timeframe for Aequs Ltd., the stock has been trading within a clear rectangular consolidation phase for several months. The price has been oscillating between a solid support base near the 225-230 zone and facing recurring resistance around the 265-270 levels. In the most recent price action, we can observe a strong bullish breakout above the upper boundary of this consolidation box. Crucially, this breakout candle is accompanied by a significant spike in trading volume,
NSE:AEQUS
by ParamjitMahapatro
Updated
BHADORA Rounding Bottom Breakout Above Key ResistanceOn the weekly timeframe, Bhadora Industries Limited has demonstrated a classic rounding bottom recovery after a prolonged downtrend. The price action established a base near the 60.00 level earlier in the year before initiating a steady sequence of higher highs and higher lows. A major horizontal resistance level was established at 123.72, representing the previous structural high from last September. In the most recent price action, the stock has successfully broken out above this 123.72 nec
NSE:BHADORA
by ParamjitMahapatro
Updated
SEDEMAC High-Volume Breakout Above Key ResistanceThe daily chart for SEDEMAC Mechatronics Ltd. shows a strong bullish breakout. The price decisively cleared a major horizontal resistance level at 3,305.0, closing well above it at 3,444.9. This technical move is validated by a massive volume spike shown at the bottom of the chart, indicating high buying interest and strong momentum. Bias: Long Trade Plan Entry Point: Consider a long entry near the current market price of 3,444.9, or wait for a potential pullback to retest the 3,305.0 breako
NSE:SEDEMAC
by ParamjitMahapatro
Updated
IREDA Testing Crucial Horizontal Support Zone at 111About the Chart: Based on the weekly timeframe, Indian Renewable Energy Development Agency Ltd. is currently at a critical technical juncture. After a prolonged downtrend from its highs near 310, the stock has corrected significantly and is now hovering right above a major horizontal support line drawn at 111.20. The current price sits at 113.22, showing a tight consolidation near this floor. Because this is a weekly chart, this 111.20 level acts as a strong make-or-break zone; a successful de
NSE:IREDA
by ParamjitMahapatro
Updated
1
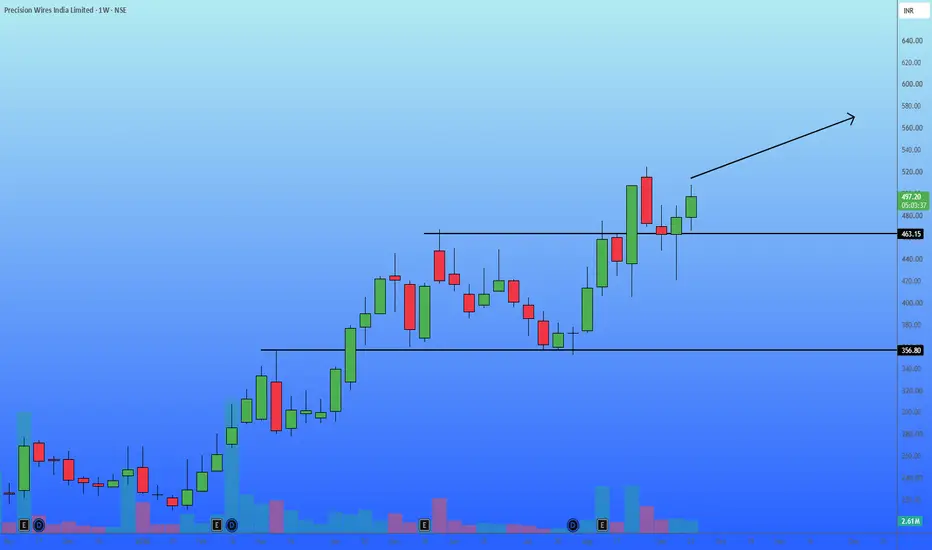
PRECWIRE Bullish Breakout & Retest of Resistance-Turned-SupportBased on the weekly chart for Precision Wires India Limited, the stock is demonstrating a textbook technical breakout setup. Chart Analysis Breakout & Retest: The price recently broke out above a major multi-month resistance ceiling at 463.15. Following the breakout, the stock experienced a healthy pullback, retesting the 463.15 level. This zone has now successfully flipped from resistance to strong support. Price Action: The latest weekly candle (currently at 498.15) shows a bullish bounce of
NSE:PRECWIRE
by ParamjitMahapatro
Updated
USHAMART Weekly Range Breakout with Volume ConfirmationUsha Martin Limited is currently demonstrating a strong bullish breakout on the weekly timeframe. After a steady uptrend earlier in the year, the stock entered a prolonged consolidation phase, trading within a well-defined rectangle pattern. The upper resistance boundary was established precisely at 519.05, while the lower support boundary held firm at 476.10. The most recent weekly candle shows a decisive breakout above the 519.05 resistance level, currently trading around 528.25. This struct
NSE:USHAMART
by ParamjitMahapatro
Updated
TI Strong Bullish Breakout Above Resistance ZoneBased on the technical structure shown in Tilaknagar Industries Limited is exhibiting a strong bullish setup on the weekly timeframe. The chart illustrates a decisive breakout above a major consolidation phase, signaling a potential continuation of the underlying uptrend. Chart Analysis: The stock has recently cleared a critical resistance zone marked by the horizontal levels at 516.30 and 534.75. Historically, this area acted as a strong supply zone, rejecting price advances earlier in the ye
NSE:TI
by ParamjitMahapatro
Updated
KTKBANK Bullish Momentum Post-ConsolidationBased on the technical structure shown in Karnataka Bank Ltd. on the daily timeframe has just staged a strong breakout from a prolonged rectangular consolidation zone. For the past several weeks, the price action has been tightly range-bound between support near the 314 level and resistance near the 338 level. The recent daily candles show a decisive push above this resistance box, closing near 343.55 with solid bullish momentum. The accompanying volume bars indicate healthy participation in th
NSE:KTKBANK
by ParamjitMahapatro
Updated
ICIL Weekly Breakout Above Key ResistanceIndo Count Industries Limited is exhibiting strong bullish momentum on the weekly timeframe, having successfully cleared multiple critical supply zones. About the Chart: The chart illustrates a classic long-term base breakout. After an extended period of consolidation, the stock staged a decisive move above the major historical resistance at 424.65, a level that previously acted as a strong structural ceiling. Following a brief pause, the price has now broken past the immediate secondary resis
NSE:ICIL
by ParamjitMahapatro
Updated
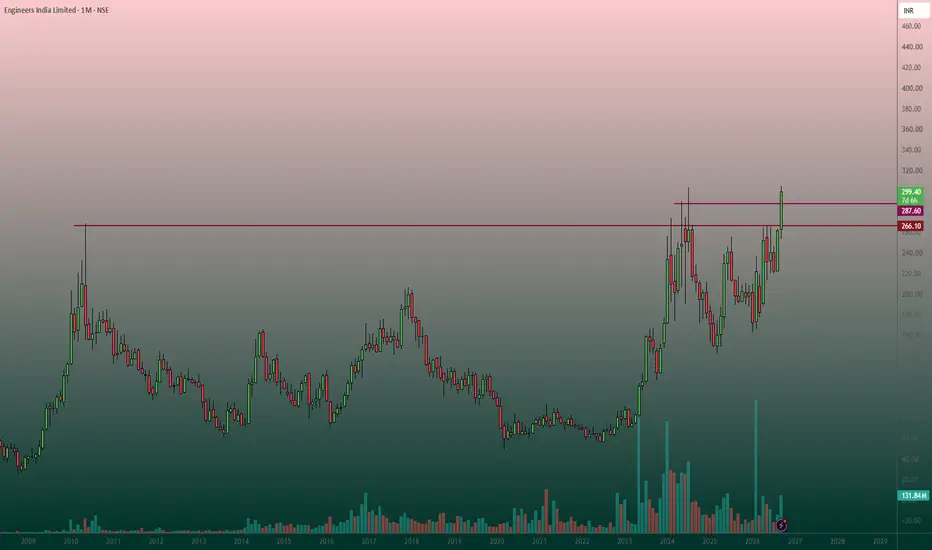
ENGINERSIN Multi-Year Structural Breakout on Monthly ChartThe monthly chart for Engineers India Limited presents a compelling long-term bullish setup following a significant structural breakout. Technical Analysis: The stock has spent several years consolidating below major historical resistance zones. As highlighted on the chart: Red Line (266.10): Represents a critical multi-year historical resistance level. Purple Line (287.60): Represents a more recent intermediate swing high resistance. Recently, the price action has demonstrated strong bullis
NSE:ENGINERSIN
by ParamjitMahapatro
Updated
4
VINTAGE Weekly Breakout & Key Resistance Turning to SupportLooking at the weekly timeframe for Vintage Coffee and Beverages Limited, the chart illustrates a textbook breakout and potential retest scenario. The stock previously established a strong resistance level around 173.43 (marked by the red horizontal line) late last year. Following a sustained accumulation phase and a steady higher-high, higher-low structure from the March lows, the price successfully breached this major resistance level a few weeks ago. Currently, the stock is pulling back to
NSE:VINCOFE
by ParamjitMahapatro
Updated
JSWINFRA Multi-Month Resistance Breakout on High VolumeThe Setup & Analysis: Looking at the weekly timeframe for JSW Infrastructure, we can observe a clear and decisive breakout from a prolonged consolidation phase. The stock has successfully breached a major horizontal resistance zone at the 354.35 level, a ceiling that has kept the price capped for several months. What makes this technical setup particularly strong is the accompanying volume. The breakout candle is supported by a noticeable surge in buying volume, indicating genuine institution
NSE:JSWINFRA
by ParamjitMahapatro
Updated
AEGISLOG: Bullish Breakout from Daily Consolidation.As shown in chart, Aegis Logistics Limited is exhibiting strong upward momentum on the daily timeframe. The price action reveals a well-defined rectangular consolidation zone, with a base support established near 1,200 and an upper resistance ceiling around 1,440. The most recent daily candle demonstrates a definitive bullish breakout, clearing the box and closing strongly at 1,479.9 (+4.56%). Here is the structural breakdown of the setup: Bias: Long. The decisive close above multi-week resist
NSE:AEGISLOG
by ParamjitMahapatro
Updated
1
TEGA : Multi-Year Symmetrical Triangle Breakout on Weekly.Chart Analysis & Rationale: As seen on the weekly chart, Tega Industries Ltd. has been consolidating within a massive symmetrical triangle pattern for over two years. The stock has respected both the descending resistance line and the ascending support line throughout this period. This week, the price delivered a decisive breakout above the upper resistance trendline. What makes this setup particularly compelling is the volume: the breakout is accompanied by a massive volume spike (visible at
NSE:TEGA
by ParamjitMahapatro
Updated
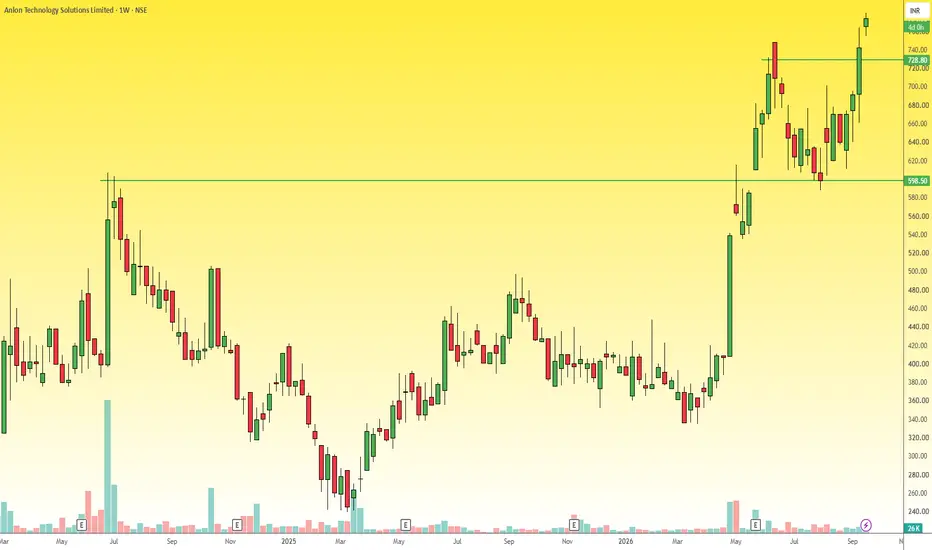
ANLON : Weekly Breakout ContinuationTrade Bias: Long Based on the weekly chart for Anlon Technology Solutions Limited shown the market structure displays strong bullish momentum. The price previously cleared a major resistance at 598.50 and has now decisively broken above the next key resistance level at 728.80. With the current price trading near 774.00, this price action confirms a solid continuation of the broader uptrend. Rationale: This setup follows a classic breakout and continuation strategy. The strong weekly price ac
NSE:ANLON
by ParamjitMahapatro
Updated
APARINDS : Strong Breakout from Multi-Week Consolidation.Chart Analysis & Reasoning: On the daily timeframe, APAR Industries (NSE: APARINDS) has been consolidating within a well-defined range (highlighted by the pink box) since early August. The price action formed a strong support base around the 16,715 level, while facing consistent resistance near the 18,250 mark. We can observe a massive bullish expansion candle that has decisively broken out above the upper boundary of this consolidation. This breakout is accompanied by a noticeable uptick in bu
NSE:APARINDS
by ParamjitMahapatro
Updated
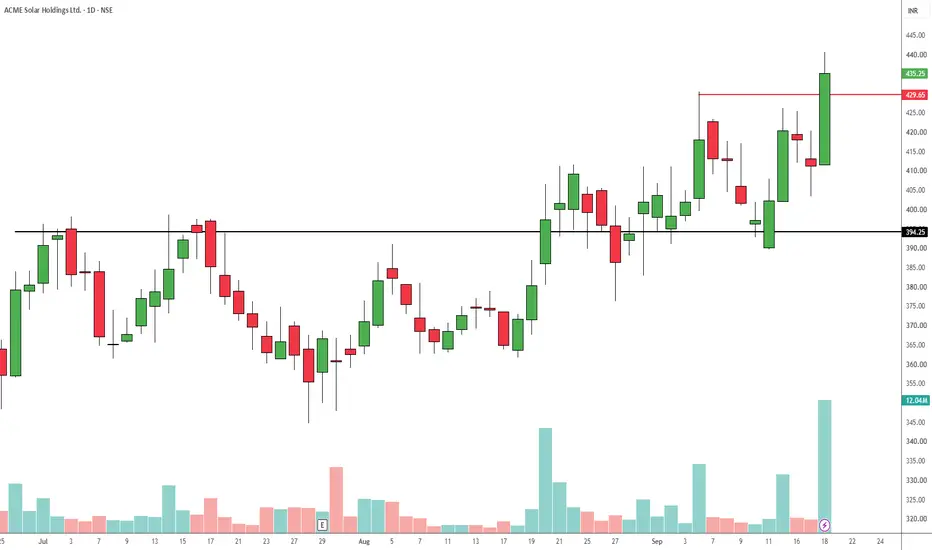
ACMESOLAR : High-Volume Bullish Breakout from Consolidation.Bias: Long Technical Analysis & Rationale: The daily chart for ACME Solar Holdings Ltd. presents a strong bullish setup. To align with sound technical analysis principles, this idea is supported by multiple chart confluences: Clear Resistance Breakout: The stock has decisively cleared the overhead resistance at 429.65, marked by the red horizontal line, and closed near the day's high at 435.25. Volume Confirmation: The breakout is validated by a significant surge in trading volume, visible o
NSE:ACMESOLAR
by ParamjitMahapatro
Updated
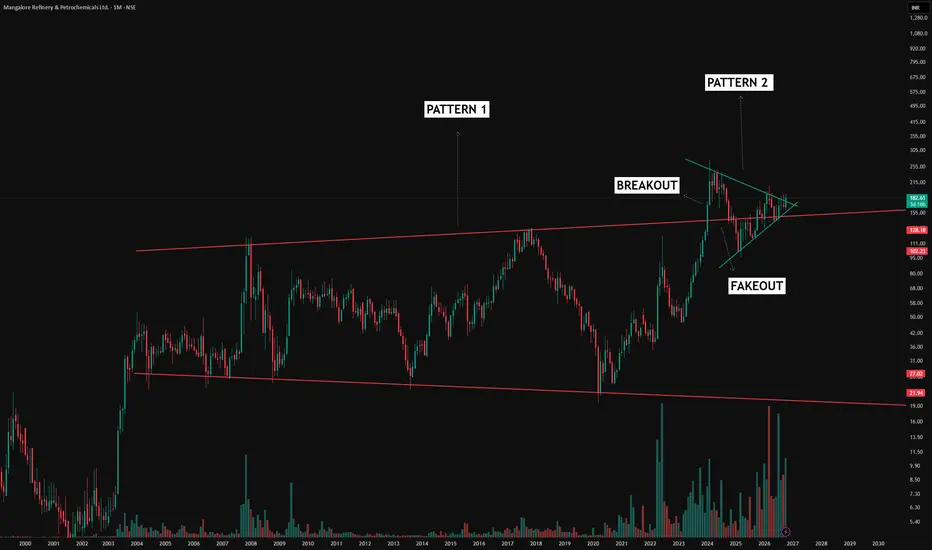
MRPL: From a Broadening Range to a Symmetrical TriangleApoorv Dubey | SEBI Registered Research Analyst Consolidation does not always look like a neat horizontal range. MRPL’s monthly chart illustrates how it can change in shape, size and duration. 1. The larger structure — expanding swings The red boundaries outline a multi-year broadening formation. Although price remained within a larger range, the movements inside it were substantial. A sideways market on a higher timeframe can still contain strong rallies and deep corrections. 2. The breakout
NSE:MRPLLong
by Apoorv-Dubey_SEBI-RA
ETERNAL – Swing Trade Setup-Golden Cross OverETERNAL: CMP: ₹315 Eternal is showing a constructive weekly Elliott Wave structure, with ₹212–213 as a major structural low. The current move suggests the beginning of a fresh bullish impulse. 📌 Additional Bullish Trigger: The stock is also showing a Golden Cross formation , with the shorter-term moving average crossing above the longer-term moving average, supporting the emerging medium-to-long-term bullish trend. Swing Setup: 🟢 Entry: ₹310–320 🎯 Target 1: ₹335 🎯 Target 2: ₹350 🎯 Target
NSE:ETERNALLong
by DrPrashantVerma
Updated
5
ICICI BANK – Positional Buy SetupICICI Bank is forming a potential inverse head-and-shoulders pattern on the 4-hour chart. The price has recovered from the ₹1,295–₹1,300 zone and is now testing the neckline resistance around ₹1,358–₹1,365. A sustained breakout above this zone, preferably with strong volume, may confirm the bullish reversal pattern and open the possibility of a move towards ₹1,429. The stop-loss is placed at ₹1,329, below the recent right-shoulder support. The trade offers a potential reward of approximately ₹5
NSE:ICICIBANKLong
by PowerOfTA
Updated
1
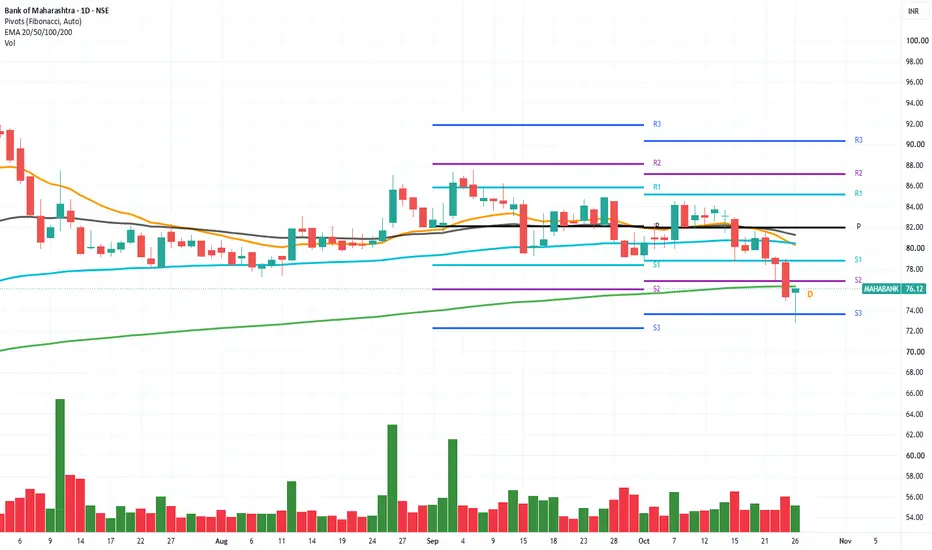
MAHABANK AT A CRITICAL SUPPORT ZONE! ₹73 OR RECOVERY TOWARDS ₹82# 🚨 MAHABANK AT A CRITICAL SUPPORT ZONE! ₹73 OR RECOVERY TOWARDS ₹82? 📉 **Bank of Maharashtra (NSE: MAHABANK) | Technical Analysis | 26 October 2026** Bank of Maharashtra is showing signs of short-term weakness after falling from its recent highs. The stock is trading at **₹76.12**, below its key short- and medium-term moving averages. However, today's candle shows a recovery from the intraday low of ₹72.77, suggesting buyers emerged at lower levels. **The key question: Is this the beginning
NSE:MAHABANK
by shanmurali
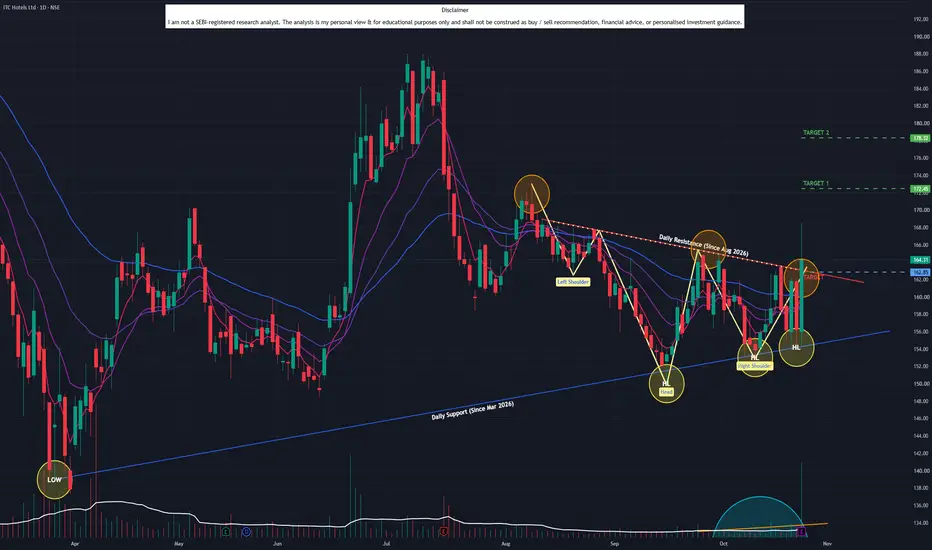
ITC Hotels (D): MAJOR REVERSAL & BREAKOUTTimeframe: Daily | Chart Scale: Linear Explosive +5.16% surge today backed by a massive 20.01M volume spike! 🔥 Technical Highlights: ✅ Reversal: Confirmed a classic Inverted Head & Shoulders pattern! ✅ Breakout: Cleared & closed above the IHS neckline AND an angular resistance (active since Aug '26). ✅ Volume: Surging volume confirms heavy buyer accumulation. ✅ Momentum: Daily EMA positive crossover. MACD & RSI rising. 🚀 Key Levels to Watch: 🎯 Target 1: 172 🎯 Target 2:
NSE:ITCHOTELSLong
by Learn_with_Pth0mas
123456789101112131415161718192021222324252627282930313233343536373839404142
…999

Made by humans

Select market data provided by ICE Data Services. Select reference data provided by FactSet. Copyright © 2026 FactSet Research Systems Inc.Copyright © 2026, American Bankers Association. CUSIP Database provided by FactSet Research Systems Inc. All rights reserved. SEC filings and other documents provided by Quartr.© 2026 TradingView, Inc.

SOC 2 CompliantGDPR Compliant
More than a product
  • Supercharts
Screeners
  • Stocks
  • ETFs
  • Bonds
  • Crypto coins
  • CEX pairs
  • DEX pairs
  • Pine
Heatmaps
  • Stocks
  • ETFs
  • Crypto coins
Calendars
  • Economic
  • Earnings
  • Dividends
  • IPOs
More products
  • News Flow
  • Portfolios
  • Fundamental Graphs
  • Yield Curves
  • Options
  • Macro Maps
  • Pine Script®
  • MCP Server
Apps
  • Mobile
  • Desktop
Community
  • Social network
  • Wall of Love
  • Refer a friend
  • Creator program
  • House Rules
  • Moderators
Ideas
  • Trading
  • Education
  • Editors' picks
Pine Script
  • Indicators & strategies
  • Wizards
  • Freelancers
  • Marketplace
Tools & subscriptions
  • Features
  • Pricing
  • Market data
  • Gift plans
Trading
  • Overview
  • Brokers
  • Brokers comparison
  • The Leap
Special offers
  • CME Group futures
  • Eurex futures
  • US stocks bundle
About company
  • Who we are
  • Space mission
  • Blog
  • Help Center
  • Careers
  • Media kit
Merch
  • Tarot cards for traders
  • The C63 TradeTime
Policies & security
  • Terms of Use
  • Disclaimer
  • Privacy Policy
  • Cookies Policy
  • Accessibility Statement
  • Trust Center
  • Security tips
  • Bug Bounty program
  • Status page
Business solutions
  • Widgets
  • Charting libraries
  • Lightweight Charts™
  • Advanced Charts
  • Trading Platform
Growth opportunities
  • Advertising
  • Brokerage integration
  • Partner program
  • Education program
Community
  • Social network
  • Wall of Love
  • Refer a friend
  • Creator program
  • House Rules
  • Moderators
Ideas
  • Trading
  • Education
  • Editors' picks
Pine Script
  • Indicators & strategies
  • Wizards
  • Freelancers
  • Marketplace
Business solutions
  • Widgets
  • Charting libraries
  • Lightweight Charts™
  • Advanced Charts
  • Trading Platform
Growth opportunities
  • Advertising
  • Brokerage integration
  • Partner program
  • Education program
Look FirstLook First