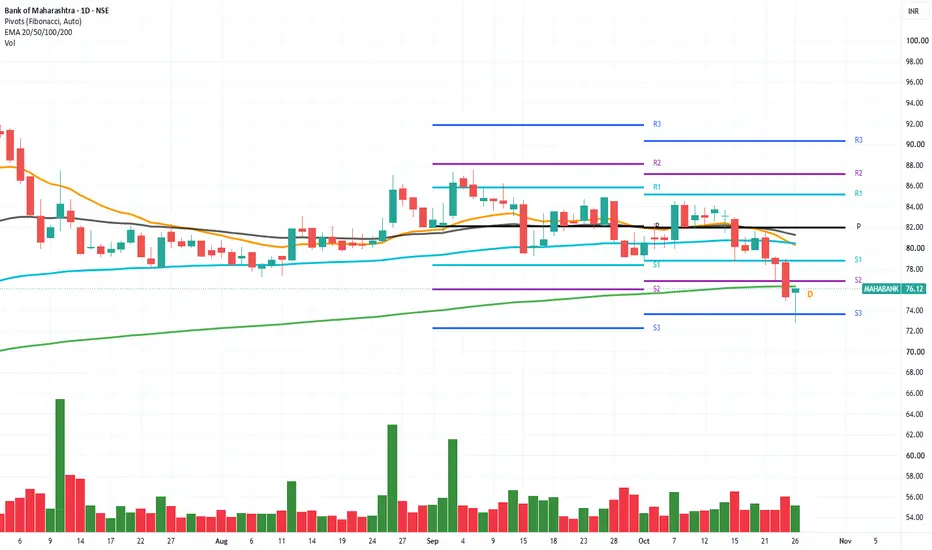
MAHABANK AT A CRITICAL SUPPORT ZONE! ₹73 OR RECOVERY TOWARDS ₹82# 🚨 MAHABANK AT A CRITICAL SUPPORT ZONE! ₹73 OR RECOVERY TOWARDS ₹82? 📉
**Bank of Maharashtra (NSE: MAHABANK) | Technical Analysis | 26 October 2026**
Bank of Maharashtra is showing signs of short-term weakness after falling from its recent highs. The stock is trading at **₹76.12**, below its key short- and medium-term moving averages. However, today's candle shows a recovery from the intraday low of ₹72.77, suggesting buyers emerged at lower levels.
**The key question: Is this the beginning
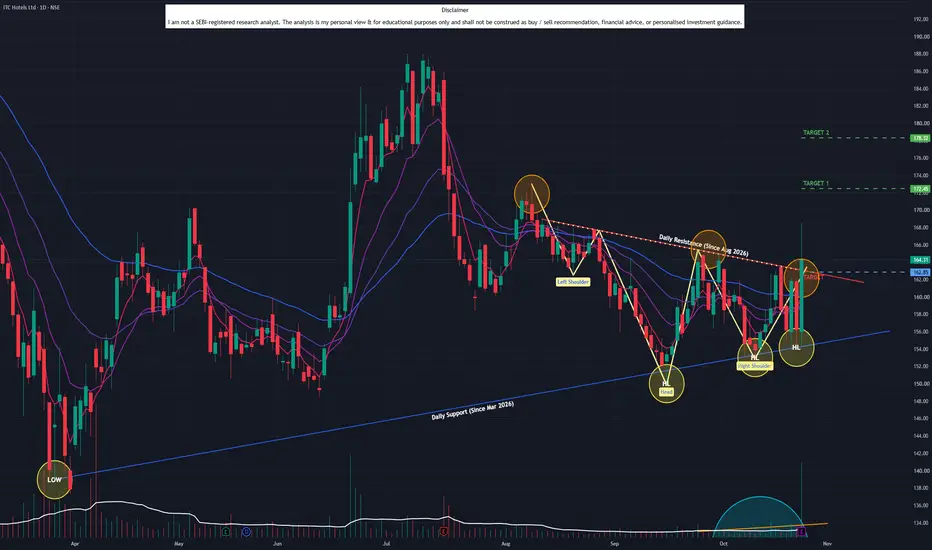
ITC Hotels (D): MAJOR REVERSAL & BREAKOUTTimeframe: Daily | Chart Scale: Linear
Explosive +5.16% surge today backed by a massive 20.01M volume spike! 🔥
Technical Highlights:
✅ Reversal: Confirmed a classic Inverted Head & Shoulders pattern!
✅ Breakout: Cleared & closed above the IHS neckline AND an angular resistance (active since Aug '26).
✅ Volume: Surging volume confirms heavy buyer accumulation.
✅ Momentum: Daily EMA positive crossover. MACD & RSI rising. 🚀
Key Levels to Watch:
🎯 Target 1: 172
🎯 Target 2:
WIPRO AT A CRITICAL TURNING POINT?🚨 WIPRO AT A CRITICAL TURNING POINT! ₹197 BREAKOUT OR ANOTHER PULLBACK? 📊
Wipro has staged a sharp recovery from its September low near ₹156.60, climbing towards ₹197.25 before facing selling pressure.
The stock is now consolidating near ₹188.
The big question: Can bulls reclaim ₹197, or will resistance trigger another correction?
📈 KEY TECHNICAL LEVELS
🟢 **Support Zones**
₹185–₹188: Immediate support
₹181–₹183: Crucial short-term support
₹174–₹177: Secondary support
₹169–₹17
Buy Today, Sell Tomorrow for 3-5% - Daily Breakout SetupDRREDDY — BTST BREAKOUT SETUP
Entry, Stop Loss & Targets Are Clearly Defined — Helping You Plan Your Trade With Confidence.
📊 Stock Strength: 72/100
(Note: Higher score indicates stronger stock conditions, not guaranteed returns.)
A bullish breakout has appeared on the 1D timeframe with positive price action and strong volume expansion.
🔄 Trade Type: BTST
────────────────────
🎯 TRADE LEVELS
ENTRY: ₹1318
🛑 STOP LOSS
ATR SL: ₹1269
🎯 TARGETS
BTST 3-5% (Best)
🎯 SWING
T1: ₹1400
─────────
Buy Today, Sell Tomorrow for 3-5% - Daily Breakout SetupHILINFRA — BTST BREAKOUT SETUP
Entry, Stop Loss & Targets Are Clearly Defined — Helping You Plan Your Trade With Confidence.
📊 Stock Strength: 72/100
(Note: Higher score indicates stronger stock conditions, not guaranteed returns.)
A bullish breakout has appeared on the 1D timeframe with positive price action and strong volume expansion.
🔄 Trade Type: BTST
────────────────────
🎯 TRADE LEVELS
ENTRY: ₹63
🛑 STOP LOSS
ATR SL: ₹58
🎯 TARGETS
3–5%
────────────────────
📈 VOLUME
20D Volume: 52
Eternal Limited: Ready for New HighsEternal Limited is doing very well right now. While its competitors are struggling, Eternal's sales are going up, its assets and extra income have increased, and its sister businesses are growing fast.
The Setup:
The stock is currently trading at 326.75. Looking at the daily chart, the price recently bounced off a strong support floor (the solid blue line near 300). Now, it is breaking above the falling trendline and moving higher.
Trade Plan:
Entry: Buy the stock as it moves up. It is gettin
ICICI Bank Shows Positive Momentum Following Strong Q2 ResultsHighlights
ICICI Bank closed around ₹1,398–₹1,400 on October 22, showing renewed buying interest following its Q2 FY27 results announced on Saturday, October 17.
Immediate resistance is around ₹1,400–₹1,420. A sustained breakout above ₹1,420 could push the stock towards ₹1,445–₹1,480.
On the downside, ₹1,375–₹1,385 is the immediate support zone, followed by stronger support around ₹1,350–₹1,365. Holding these levels would preserve the positive structure.
Momentum is improving, with RSI ar
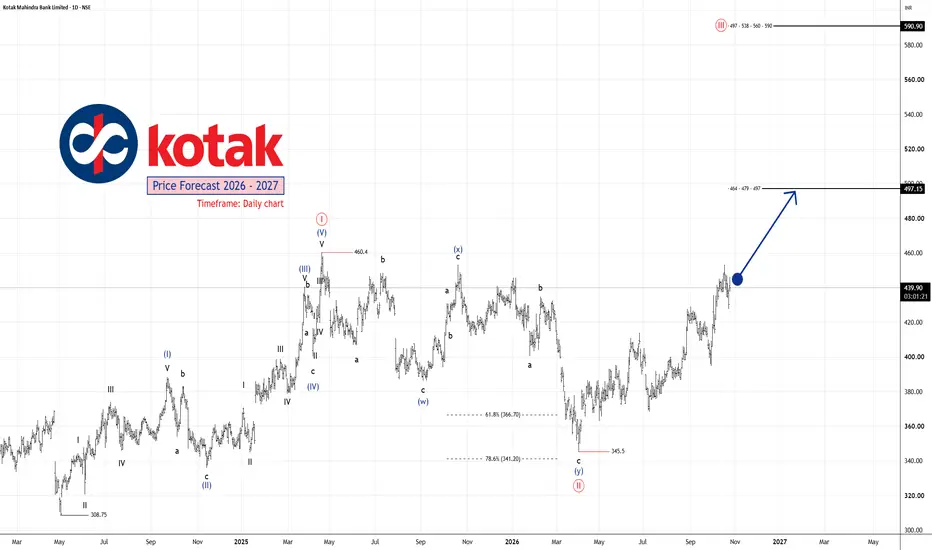
NSE KOTAKBANK - 2027 Price TargetsNSE:KOTAKBANK Wave ((III)) Developing?
Kotak Mahindra Bank appears to have completed a significant corrective phase at 345.50 , potentially marking the end of Wave ((II)) .
The subsequent recovery supports the possibility that Wave ((III)) is now developing. The internal subdivisions also suggest that Waves I and II of ((III)) may be complete, potentially setting the stage for the next advance.
If Wave ((III)) extends, the upside could exceed the initial projections.
🎯 Price
CDSL | Daily chart triangle formationCDSL is currently multi-year symmetrical triangle on its daily chart, systematic volatility compression and diminishing trading volume as price converges toward the 1,189.8. From an auction market perspective, a symmetrical triangle does not represent mere consolidation; rather, it reflects an ongoing structural balance between passive buyers and retreating sellers. Over the course of the 2024 to 2026 cycle, every recovery rally toward the upper descending boundary has faced institutional suppl
Cyient: A Confluence Zone, Volume Expansion & CT TestApoorv Dubey | SEBI Registered Research Analyst
Cyient’s monthly chart offers a useful example of combining historical price structure, Fibonacci retracement and trendlines.
Supply turning into demand
The yellow band marks a historical supply area that subsequently acted as support. This change in role is what we call a flip zone.
The Fibonacci confluence
The marked 38.2%–50% Fibonacci retracement region broadly overlaps this same band. Two different analytical references highlighting a simil
Should u book profits in IT?TCS CMP 2530
Elliott- this is a zig zag corrective pattern. This is the only pattern where the A and C wave both have five waves. Not easy to catch coz even the impulse waves too have 5 waves. This is corrective.
Conclusion - book ur profits here...coz one more leg of down fall is on its way.
IDBI Bank – Trendline Tooti, Ab Next Move MattersIDBI Bank has taken a sharp hit on the weekly chart, closing down over 9% with a noticeable jump in volume.
The rising trendline that supported the recovery has now been breached and retested. The stock has also slipped below the ₹80 zone, putting the recent bullish structure under pressure.
Ab dekhna yeh hai: Can the stock reclaim the broken trendline, or will it struggle to get back on its feet?
A quick recovery above the broken support could change the picture. Until then, caution is warra
Can UTTAMSUGAR give some 'Mithaas' to its investors?Uttam Sugar has seen a sharp rally from the ₹250 zone, supported by a noticeable pickup in volume. The stock is now correcting within a descending price channel, and the lower part of this channel is an important area to watch.
Price is currently around ₹352, close to the 0.382 Fibonacci level. If channel support holds and price starts moving back toward the upper boundary, a fresh upward move could develop. A breakdown below the channel would weaken this view, with ₹339 and ₹326 as the next su
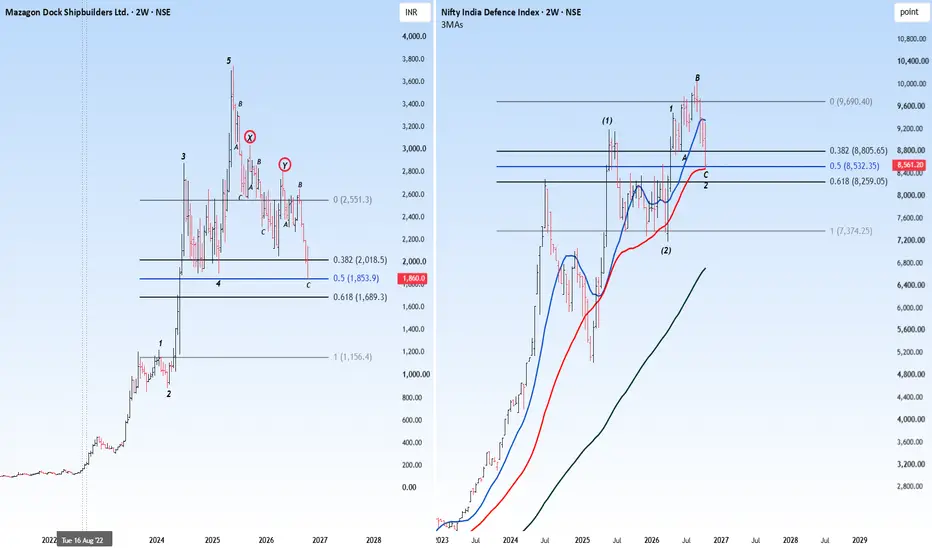
Can u still bet on Defence?Mazdock CMP 1860
Nifty Def CMP 8561
Mazdock
Elliott- the stock has a complex corrective pattern and hence the deep correction. Corrections tend to cluster around the vicinity of the 4th wave. This chart is a good example of the same. To me this zone is a high prob reversal zone. At the same time Nifty def formed an expanded flat corrective pattern and is over.
Conclusion - this sector has given deep correction and is offering a very good opportunity to enter. So here is another sector show
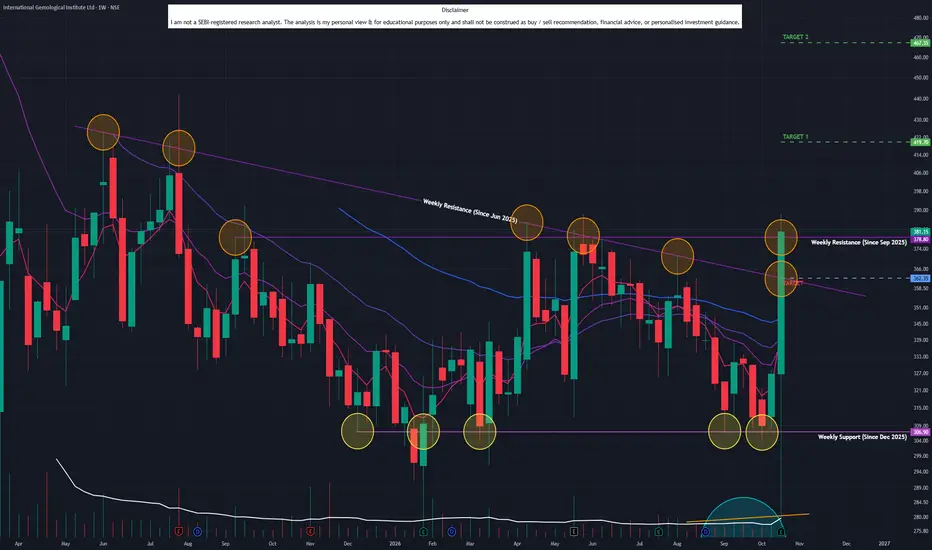
International Gemological Instit (W): DUAL RESISTANCE BREAKOUTTimeframe: Weekly | Chart Scale: Logarithmic
Explosive +16.67% weekly surge backed by a huge 29.73M volume spike! 🔥
Technical Highlights:
✅ Breakout: Cleared & closed above BOTH a horizontal (Sep '25) AND angular (Jun '25) resistance!
✅ Volume: Surging volume confirms heavy buyer accumulation after weeks of failed breakout attempts.
✅ Momentum: Daily EMAs in positive crossover (Weekly soon). MACD & RSI rising . 🚀
Key Levels to Watch:
🎯 Target 1: 420
🎯 Target 2: 467
🛡️ S
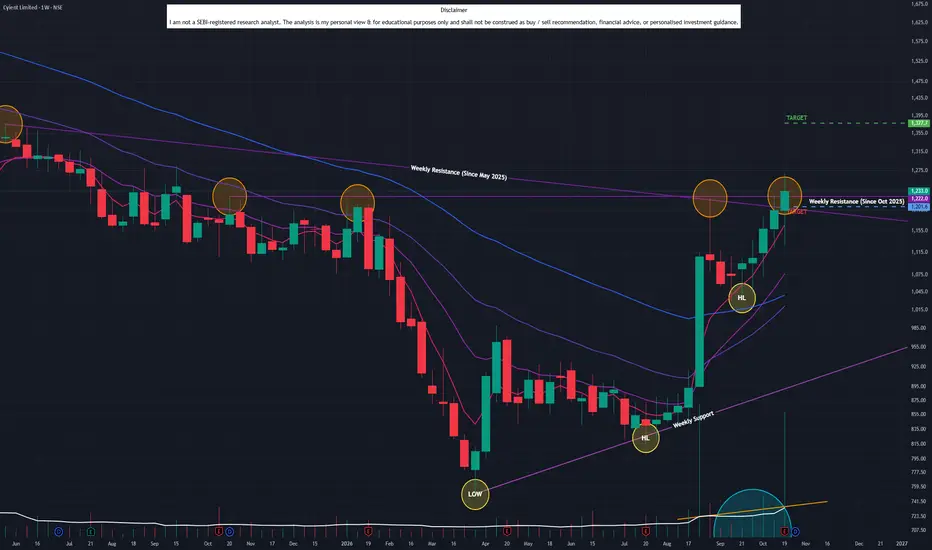
Cyient Ltd (W): DUAL RESISTANCE BREAKOUTTimeframe: Weekly | Chart Scale: Logarithmic
Constructive +3.22% weekly surge backed by a huge 21.11M volume spike! 🔥
Technical Highlights:
✅ Breakout: Cleared & closed above BOTH an angular (May '25) AND horizontal (Oct '25) resistance!
✅ Price Action: Weekly hammer candle + forming Higher Lows = Extremely Bullish!
✅ Volume: Surging volume confirms heavy buyer accumulation.
✅ Momentum: Short-term EMAs in positive crossover (Daily/Weekly). MACD & RSI rising. 🚀
Key Levels t
Jindal Poly Films (W): MAJOR RESISTANCE BATTLETimeframe: Weekly | Chart Scale: Logarithmic
Constructive +5.81% weekly surge backed by a huge 8.38M volume spike! 🔥
Technical Highlights:
✅ Breakout: Cleared & closed above long-term horizontal resistance (active since May '23).
⚠️ The Final Hurdle: Testing a stubborn angular resistance (Feb '22) but couldn't secure the close.
✅ Volume: Historic volume surge confirms heavy buyer accumulation.
✅ Momentum: Short-term EMAs in positive crossover (Daily/Weekly/Monthly). 🚀
Key Leve
Ideal Pattern of Wave Theory , Corrective PatternMarkets tend to move in high rate of change in the price then pause ,
In Wave theory its refered as Impulse behaviour , when Price move makes significant move
relative to time they enter an price & time correction ,
which are refered as Corrective Patterns as ideally accepted by Traders
Here is one of the Classic Chart pattern that suggest the Correction in The stock is about to end
make reversal on specified measured move level
all of these methods are known as Market patterns or
5 Trading Lessons for Volatile Markets | 5 Years of ExperienceApoorv Dubey | SEBI RA
Five lessons from my five years of trading through different market conditions:
1. Follow higher timeframes to put short-term price moves into context.
2. Adapt stop-loss distances to volatility, reduce position size accordingly, and assess potential reward.
3. Focus on your trading plan instead of constantly watching your P&L.
4. Understand IPO trading nuances; 5. Recognise that large-cap, mid-cap and small-cap trading require different approaches.
Disclaimer: Shared by
From Novice to Pro: Navigating Support & Resistance Like a BossGreetings to all. I trust that you are all thriving in both your personal lives and trading endeavors. Today, I present educational content aimed at understanding the concepts of support and resistance in chart analysis.
Support and resistance are key concepts in technical analysis used to identify potential price levels where an asset's price might reverse, stall, or consolidate. They are often visualized on a price chart and are critical for traders making decisions about entry, exit, and sto
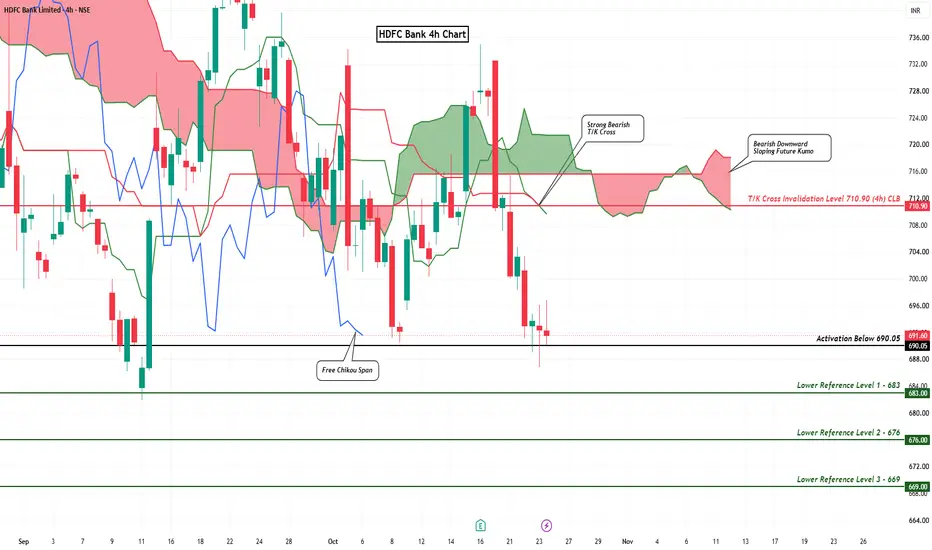
HDFC Bank (4h): Index Heavyweight Poised for Another Leg of CorrHDFC Bank(4h) price action has formed a strong bearish T/K cross below the Kumo.
A free Chikou Span and a bearish Future Kumo further strengthens the bearish bias
The setup activates below 690.05 with downside reference levels at 683 -> 676 -> 669.
Invalidation is on a strong 4h close above 710.90
Will this heavyweight(~10% weightage) pull down Nifty in the coming days?
Comments/thoughts welcome