GU BULLISH IDEAPrice has taken in the liquidity which is previous day low and also prices mitigating 4h order block and it’s also Wednesday, so I am expecting price to reverse from this point and go take the high that I have marked as target!
IT CAN GO DEEPIN NYO SO MANAGEACCORDINGLY I MIGHT ADD MORE POSITIONS!
Forex market
GBP/USD Continues to Under Pressure Due to UK FundamentalsGBP/USD traded with a negative bias below 1.3550 during today's Asian session.
The combination of political turmoil in London and higher-than-expected US inflation data has created a perfect storm for the pound, leaving it vulnerable to a retest of the psychological 1.3500 level.
✅ UK Politics: Keir Starmer's Leadership on the Roar
The pound is under intense selling pressure due to domestic uncertainty:
- Internal Rebellion: More than 80 Labour MPs have publicly called for the resignation of Prime Minister Keir Starmer. This comes after a poor local election result, triggering a severe leadership crisis in Downing Street.
- Market Impact: Political uncertainty often triggers capital flight from British assets as investors worry about the stability of fiscal and economic policy going forward.
----------------------------------------------------------------------------------------------
✅ Macroeconomics: Hot US CPI & Interest Rate Speculation
The US Dollar (USD) regained strength after the release of surprising inflation data:
- Inflation Surprise: US headline CPI jumped to 3.8% YoY, its highest level since 2023. Core inflation, which remained stubbornly at 2.8% YoY, shows that price pressures have not abated.
- Fed Pivot: The market responded by increasing the probability of an interest rate hike by 25 basis points in December 2026 to 35%. This "Higher for Longer" outlook provided a significant boost to US Dollar yields.
- Geopolitics: President Trump's statement that a ceasefire with Iran is on the "brink of collapse" strengthens the USD's status as a safe-haven reserve amid the failure of nuclear negotiations.
----------------------------------------------------------------------------------------------
✅ GBP/USD Technical Analysis (Intraday)
Technically, the market structure supports a continuation of the downtrend:
- Psychological Support (1.3500): This is the last level of resistance. A close below this level would open the door to deeper weakness towards the structural base at 1.3420.
- Supporting Resistance (1.3550): Any intraday recovery attempt will likely be stalled in this area. As long as the price remains below this level, the bias remains bearish.
- Tonight's Catalyst: The US Producer Price Index release (7:30 PM WIB) will be in focus. If inflation at the producer level also shows an increase, selling pressure on GBP/USD will accelerate.
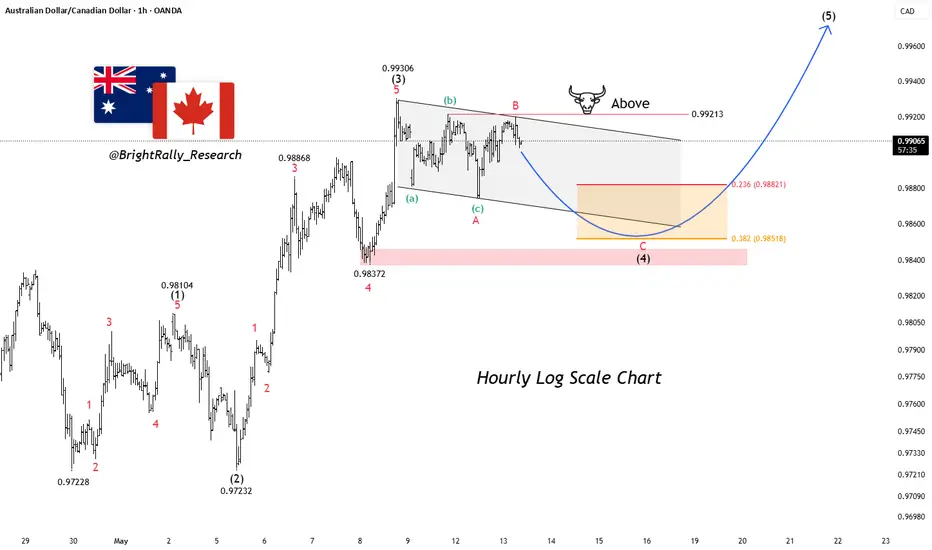
AUDCAD: Corrective Dip May Fuel Next Rally
AUDCAD on the 1H chart is still trading within a corrective structure after the strong rally to the 0.9930 high. Instead of continuing higher immediately, the price began moving within a falling channel, indicating that momentum has slowed in the short term. The current structure looks more like a controlled pullback rather than aggressive selling.
At the moment, price is struggling to reclaim the upper boundary of the channel, while sellers continue defending the resistance zone near 0.9921 . As long as the pair remains inside the channel, the correction phase is still active, and wave 4 may need more time to complete.
The downside support levels to watch during this correction are 0.98821 and 0.98518 . Those areas could act as the completion zone for the current pullback before buyers attempt to regain control.
If wave 4 completes successfully and AUDCAD breaks back above resistance, the next upside targets come in at 0.99213, 0.99650, and 1.00240 .
We will update further information soon.
GBPUSD Tests Key Dynamic Support Near EMA89• GBPUSD is undergoing a healthy short-term correction after an extended bullish move from early May.
• Price has already broken below EMA34 and is now testing EMA89 support.
• EMA89 remains a critical dynamic level for maintaining the medium-term bullish trend.
Although momentum has weakened, the overall bullish structure remains intact as higher lows continue to hold above major support.
Repeated rejection from the 1.3640–1.3660 resistance region signals growing exhaustion from buyers and increasing profit-taking activity.
The 1.3520–1.3500 area is currently the most important zone to monitor. A successful defense above EMA89 could trigger a rebound toward 1.3600, while a stronger bullish continuation may later push the pair back toward 1.3650.
From a macro perspective:
GBP continues receiving support from expectations that the Bank of England will maintain restrictive monetary policy due to sticky inflation.
USD is stabilizing as US Treasury yields recover and the Fed keeps a cautious stance regarding inflation risks linked to higher energy prices.
As long as EMA89 continues trending upward and price avoids a full structural breakdown, the broader bullish outlook for GBPUSD remains valid.
EURUSD: Bearish Orderflow Continuing From PremiumPrice continues to respect bearish orderflow after reacting from premium arrays and internal liquidity.
Current framework:
Clear H1 bearish displacement
Retracement into imbalance and premium zone completed
Price rejecting lower-timeframe supply
Sell-side liquidity resting below current structure
Discount targets aligned beneath current lows
My expectation:
As long as price remains below the marked premium zone, continuation towards the sell-side liquidity and lower discount arrays remains the higher probability scenario.
Bearish expansions often retrace into inefficiencies before continuing in the direction of delivery.
GBPUSD: Weekly Range Sweep Into NWOG RepricingThe market is sitting inside compression… but the liquidity map is becoming obvious.
GBPUSD is currently forming a weekly inside candle, trading near the upper boundary of the previous week’s range and directly inside NWOG territory. That combination usually signals one thing:
A liquidity event is loading.
What stands out here:
Previous week’s highs remain vulnerable
Price trading in premium conditions
Daily equal lows resting below as major draw on liquidity
Weekly gap sitting beneath current price action
My expectation:
A sweep of the previous week’s highs first to complete the buy-side raid… followed by a deeper repricing move lower into the equal lows and weekly gap.
That blue path isn’t random volatility.
It’s how liquidity often gets delivered during inside-week conditions.
Key idea:
Inside candles create trapped positioning on both sides.
The market usually takes one side’s liquidity before expanding into the other.
Most traders will become aggressively bullish after the high gets swept.
That’s exactly where reversals become dangerous.
Let the raid complete.
Then watch the delivery shift.
EURUSD Weekly Outlook: Selling the NWOG Liquidity Grab📊 EURUSD | H1 Timeframe | Week of May 12–16
Price is currently sitting inside the New Week Opening Gap (NWOG) at the 1.1780–1.1800 zone, which is acting as a significant resistance pocket.
🔍 My Bias: Bearish
Here's what I'm watching:
⚡ Step 1 — Liquidity Grab at H1 Equal Lows (1.1730 zone)
Price may dip to sweep the H1 equal lows before any continuation. Equal lows = liquidity magnet.
📉 Step 2 — Rejection into Daily FVG (~1.1720)
After the sweep, I'm expecting a short-term bounce into the Daily Fair Value Gap before sellers step in aggressively.
🎯 Step 3 — Drop into Daily Low at 1.1650
The higher-timeframe target sits at the daily low around 1.1650, sitting right on the lower NWOG boundary — a clean institutional target.
📌 Key Levels to Watch:
• Resistance: 1.1800 NWOG / 1.1790 daily high
• H1 Equal Low: ~1.1730 (liquidity target)
• Daily FVG: ~1.1720
• Daily Low target: 1.1650
• Extended target: 1.1640 NWOG low
⚠️ Invalidation: Clean break and hold above 1.1820 flips bias bullish.
This is not financial advice. Do your own analysis.
Drop a 🚀 if you're bearish this week — let's see where the community stands!
USDCAD: H4 Bearish CRT Retracement PlayThe displacement already happened.
Now the market is deciding whether this is reaccumulation… or redistribution.
USDCAD printed a clear H4 Bearish CRT, shifting the short-term narrative and establishing a defined dealing range between the candle’s high and low. Right now, price is rotating lower after the impulse, and the focus shifts toward how it reacts around the equilibrium.
Current framework:
H4 Bearish CRT established
Price expected to retrace toward the 50% equilibrium of the CRT candle
Midpoint acting as key decision zone
High and low of the CRT candle defining the active range
My expectation:
Price taps into the 50% level and attempts to find support. If buyers fail to defend equilibrium, then the probability increases for a continuation lower toward the low of the H4 CRT candle.
That’s the important part:
The midpoint reaction determines the next bias.
Key idea:
Strong displacement candles create ranges that institutions respect.
The equilibrium becomes the battlefield.
Most traders focus only on direction.
But the real edge comes from watching how price behaves inside the range.
Acceptance above equilibrium keeps recovery alive.
Failure opens the door for another leg lower.
EURUSD Rejection From Resistance ZoneEURUSD is approaching a key resistance area near 1.1790 after a strong bullish recovery, but price is now showing signs of exhaustion inside the premium zone. Multiple rejections near resistance suggest buyers are struggling to maintain momentum while sellers begin stepping into the market.
The ascending trendline remains the key support for short-term structure. A confirmed breakdown below this trendline could trigger a bearish pullback toward the 1.1740 and 1.1720 support areas. Current price action also hints at a possible liquidity sweep near highs before downside continuation.
As long as EURUSD remains below the resistance zone, the market may face short-term selling pressure with increased probability of corrective movement.
AUD/USD Breaks Trendline and Potential for CorrectionAUD/USD faced selling pressure in today's trading session, after failing to maintain its position above the 0.7250 level.
The strengthening of the US Dollar (USD), fueled by concerns about military escalation in the Middle East and anticipation of US inflation data, has forced the pair to fall near the psychological level of 0.7200.
------------------------------------------------------------------------------------------
✅ Fundamental Dynamics: RBA vs. Fed Tug-of-War
AUD/USD is currently caught between two equally aggressive central bank policies:
- ⚡Safe-Haven Sentiment in the USD: President Trump's impatience with Iran and threats of "major combat operations" have fueled capital flows into the USD. Furthermore, the market is now pricing in a 25% chance of a Fed rate hike by the end of the year if tonight's CPI data is positive.
- ⚡RBA Resilience: Meanwhile, the Reserve Bank of Australia (RBA) has maintained its hawkish stance, providing a cushion for the AUD. This divergence has prevented the AUD/USD from falling further than other commodity currencies.
- ⚡US CPI Focus: Tonight's inflation data at 7:30 PM WIB is a key catalyst. If US inflation spikes due to energy prices, the USD will strengthen further and push the AUD beyond its current support level.
------------------------------------------------------------------------------------------
✅ Key Levels to Watch
- ⚡Intraday Resistance (0.7250): This level must be broken again to fully restore the bullish bias.
- ⚡Key Support (0.7184): This is the last line of defense for intraday buyers.
- ⚡Lower Zone (0.7110): Target for a deeper correction if the US CPI data triggers an explosive USD rally.
When Your Brain Starts Trading Against You...Introduction:
The Silent Shift Most Traders Never Catch
Most traders believe their biggest enemy is the market.
But many times, the real problem starts inside their own mind.
The dangerous part is that this shift does not happen suddenly.
A trader can begin the day focused, disciplined, and patient. Then one emotional moment slowly changes everything. The charts still look the same, but decision-making becomes different.
The trader starts reacting emotionally instead of thinking clearly.
And once that happens, even simple market movement can become dangerous.
1. The Mind Stops Thinking Clearly:
♦️ Patience Slowly Disappears
Good trading requires waiting.
But after emotional pressure builds up, waiting starts feeling painful.
The trader begins checking charts more often, watching every small candle, hoping something will happen.
Silence starts feeling uncomfortable.
That discomfort pushes the brain toward action, even when there is no real opportunity available.
♦️ Average Setups Start Looking Attractive
Normally, weak setups are easy to ignore.
But frustration changes standards.
A setup that once looked unclear suddenly feels “good enough.” The trader starts convincing himself that small confirmations are enough to justify an entry.
The decision is no longer fully logical.
Emotion quietly enters the process.
♦️ The Brain Starts Searching for Certainty
Trading always involves uncertainty.
But emotional traders struggle to sit comfortably with uncertainty for long periods.
So the brain starts searching for extra reassurance:
> more indicators
> more analysis
> more confirmations
> more opinions
The trader feels productive while doing this.
But often, the mind is simply trying to escape emotional discomfort by creating a false sense of certainty.
2. Emotion Slowly Replaces Discipline:
♦️ Small Emotional Decisions Begin Appearing
Most emotional trading does not start with huge mistakes.
It starts with tiny changes in behavior:
> entering slightly early
> risking a little more
> ignoring hesitation
> moving stop losses
> forcing another trade
Each action feels small individually.
But together, they slowly destroy discipline.
♦️ The Trader Starts Reacting to Every Move
Calm traders observe the market.
Frustrated traders react to it.
Every candle suddenly feels important. Every move creates emotional tension. Small pullbacks feel dangerous. Fast candles create urgency.
The market begins controlling the trader’s emotions instead of the trader controlling his decisions.
That emotional attachment creates impulsive behavior very quickly.
♦️ Overthinking Creates Confusion
The more emotional a trader becomes, the harder simple decisions feel.
The trader starts changing bias constantly.
One minute, he feels bullish. The next minute, he feels bearish.
Instead of following a clear process, the mind keeps reacting emotionally to short-term movement.
This creates mental exhaustion.
And exhausted traders rarely make clean decisions.
3. Why Traders Keep Falling Into This Trap:
♦️ The Brain Wants Emotional Relief
After frustration builds up, trading stops being only about money.
Now the brain wants relief.
Relief from losses.
Relief from stress.
Relief from feeling wrong.
That emotional pressure creates dangerous behavior because the trader starts chasing emotional comfort instead of quality execution.
♦️ Activity Starts Feeling Productive
Many traders struggle with doing nothing.
They feel that sitting still means wasting time.
So they continue watching charts, searching for movement, trying to stay involved.
But trading rewards patience, not constant activity.
The market does not pay traders for being busy.
It pays traders for making high-quality decisions.
♦️ Emotional Momentum Builds Very Fast
One emotional decision usually creates another.
A rushed entry creates frustration.
Frustration creates impatience.
Impatience creates more impulsive trades.
This cycle becomes stronger after every mistake.
And eventually, the trader is no longer following a system at all.
He is simply reacting emotionally moment by moment.
4. Professional Traders Understand This Difference:
♦️ They Protect Their Mental State
Experienced traders know emotional control is part of their edge.
If emotions become too strong, they reduce size, step away, or stop trading completely.
Not because they lack confidence.
Because they understand that emotional decision-making becomes expensive very quickly.
♦️ They Do Not Need Constant Action
Professional traders are comfortable waiting.
They understand that missing bad trades is just as important as catching good ones.
They do not feel pressure to always participate.
Because they know another opportunity will eventually come.
That patience protects both capital and mental energy.
♦️ They Respect Mental Fatigue
Trading for long hours weakens focus.
The brain becomes slower, more emotional, and less objective.
Experienced traders recognize this quickly.
Instead of forcing more trades, they step away before emotional fatigue starts affecting decisions.
Final Word by us:
Most traders think losing begins with a bad strategy.
But many times, losing begins when emotions slowly take control of perception.
The charts may remain the same.
But the trader is no longer seeing them clearly.
Patience disappears. Discipline weakens. Emotional pressure increases. Small mistakes begin stacking on top of each other.
And eventually, the trader is no longer trading the market objectively.
He is trading his emotions.
by @BrightRally_Research on @TradingView platform
We will update further information soon.
NZDJPY - Consolidation May Be Fueling the Next RallyNZDJPY on the daily chart still looks structurally bullish despite the recent consolidation near the highs. After the strong rally from the 85.35 low, the price pushed into the resistance area and has since been moving sideways inside a tightening structure. Instead of seeing a sharp rejection, the pair continues to hold higher lows, which usually signals that buyers are still active in the bigger trend.
The current consolidation also looks like a potential contracting pattern before continuation. Price keeps respecting the rising support trendline while sellers struggle to force a deeper breakdown. That balance between higher lows and capped resistance often builds pressure for a stronger directional move later.
At the moment, the structure remains constructive as long as the price continues holding above the rising support zone. Momentum has slowed slightly, but buyers are still defending dips instead of allowing a deeper correction.
If NZDJPY starts breaking higher from the current structure, the next upside targets come in at 94.97, 96.14, and 97.85. Until then, the pair may continue consolidating before the next expansion move begins.
We will update further information soon.
@BrightRally_Research
EURUSD: CPI GameplanPrice has shifted into bearish orderflow with a clean H1 expansion to the downside.
Current framework:
Clear bearish displacement on H1
Swing high and swing low established
Premium arrays above the 50% range remain valid
Breakaway gap likely to stay open
Retracement expected into imbalance / premium zone
My expectation:
Price retraces into the marked gaps and premium arrays before continuing delivery towards the sell-side liquidity below.
The market often retraces into premium after expansion before continuing in the direction of the displacement.
GBPUSD Reversal Zone In FocusThe market is currently approaching an important reversal zone where I am waiting for a strong positive candle confirmation. A clean bullish reaction from this area could trigger a solid upside move.
Looking at the structure, the previous high was successfully broken first. After the breakout, I copied the supply zone located below the high and projected the same structure from the breakout area. This created the current reversal zone where price is now reacting.
At this point, I want to see a strong bullish candle or positive price action confirmation inside this zone. If buyers step in with momentum, the market could continue moving higher from here.
I also marked a “VOL BURST” level below the zone. This area represents possible liquidity activity, meaning price can still sweep lower before reversing. The market may either react directly from the reversal zone or form a bullish setup somewhere between the reversal zone and the VOL BURST level.
For now, the focus remains on bullish confirmation inside the marked area.
The Illusion of Productivity in Trading
1. Watching Charts All Day Feels Productive
Many traders believe that spending more hours in front of charts automatically makes them better. It creates the feeling of hard work because they are constantly checking candles, indicators, and price movements. But in trading, more screen time does not always mean better performance. In many cases, it simply increases stress and emotional involvement.
2. Overanalysis Slowly Replaces Clarity
At the beginning of the session, the market often looks simple and understandable. But after watching every movement for hours, traders start overthinking small details. They begin seeing setups where none exist and complicate decisions that were originally clear.
3. Emotional Fatigue Builds Without Notice
Continuous chart watching slowly drains mental energy. Traders may not realize it immediately, but reacting to every candle creates emotional exhaustion over time. As fatigue increases, patience becomes weaker, and impulsive decisions become more common.
4. Boredom Pushes Traders Into Bad Trades
One of the biggest hidden problems in trading is boredom. When markets become slow, many traders feel uncomfortable doing nothing. Instead of waiting for proper setups, they begin forcing trades simply to stay active. Most unnecessary losses come from this need for constant action.
5. Lower Timeframes Create More Noise
When traders cannot find opportunities on higher timeframes, they often switch to lower ones, looking for excitement. This usually creates confusion instead of clarity. Smaller timeframes contain more random movements, making emotional reactions and poor entries more likely.
6. Activity Starts Feeling Like Improvement
Many traders mistake constant market involvement for growth. They believe analyzing charts all day means they are improving their skills. But trading performance is measured by disciplined execution, not by how busy someone looks.
7. Emotional Attachment to Price Develops
The more time traders spend watching charts, the more emotionally connected they become to every market movement. Small fluctuations begin affecting confidence and decision-making. This emotional attachment often leads to fear, greed, hesitation, and unnecessary adjustments.
8. Long Hours Reduce Discipline
Mental exhaustion slowly lowers trading standards. After spending too much time watching charts, traders become impatient and start accepting weak setups they would normally avoid. This is why many bad trades happen later in the trading session.
9. Stepping Away Often Improves Decisions
Many traders notice that the market looks clearer after taking a short break. Distance helps remove emotional pressure and allows traders to think more objectively. Sometimes stepping away from the screen is more valuable than continuous analysis.
10. Professional Traders Understand the Value of Waiting
Experienced traders know they do not need to trade every market movement. They focus only on high-quality opportunities and avoid unnecessary screen time. They understand that patience and mental clarity are often more important than constant activity.
By @BrightRally_Research
AUDUSD SHOWING A GOOD UP MOVE WITH 1:10 RISK REWARD AUDUSD SHOWING A GOOD UP MOVE WITH 1:10 RISK REWARD
DUE TO THESE REASON
A. its following a rectangle pattern that stocked the market
which preventing the market to move any one direction now it trying to break the strong resistant lable
B. after the break of this rectangle it will boost the market potential for break
C. also its resisting from a strong neckline the neckline also got weeker ald the price is ready to break in the outer region
all of these reason are indicating the same thing its ready for breakout BREAKOUT trading are follws good risk reward
please dont use more than one percentage of your capitalfollow risk reward and tradeing rules
that will help you to to become a bettertrader
thank you
USD/CHF Tries to Rebound, But Trend Remains WeakUSD/CHF attempted to rebound from a two-month low around 0.7760, but the movement remained stuck below the psychological level of 0.7800.
Although the US Dollar (USD) is gaining strength from geopolitical tensions and expectations of hawkish Federal Reserve policy, the pair's technical structure remains strongly tilted to the downside.
✅ Fundamental Dynamics: Safe-Haven Tug-of-War
Current global factors are contributing to mixed sentiment for this pair:
- Diplomatic Deadlock: Iran's rejection of US nuclear demands (as reported by the WSJ) has dashed hopes for an imminent peace deal. This has rekindled demand for the USD as a major reserve currency.
- Inflation & Fed Expectations: The deadlock in the Strait of Hormuz has raised energy prices, rekindling inflation concerns. Coupled with Friday's solid Nonfarm Payrolls (NFP) data, the market is starting to price in the possibility of a 25 basis point Fed rate hike later in the year. This outlook provides support for the US Dollar against the Swiss Franc (CHF).
- Swissie Status: Despite the strengthening USD, the CHF remains in demand as a pure safe haven amidst rising war risks, which explains why today's USD/CHF rally appears "struggling" and lacks strength.
✅ Key Levels to Watch
- Key Resistance (0.7926): A daily close above this level is needed to ease selling pressure and shift the bias to neutral/bullish.
- Psychological Barrier (0.7800): Intraday resistance currently being tested. Failure to break this level will invite renewed selling.
- Support: Technically, there is no clear price support level near the current area. If the 0.7760 level is breached again, the pair is vulnerable to deeper losses towards last year's structural bottom.
Symmetrical Triangle Market Structure🔺 Overview
This chart highlights a symmetrical triangle market structure where price is consolidating between converging trendlines. The pattern reflects compression in volatility before a potential breakout.
⸻⸻⸻⸻⸻⸻⸻⸻⸻
📉 Key Price Action
• Lower highs and higher lows indicate tightening price structure.
• Price continues to react within both support and resistance boundaries.
• Market equilibrium near the apex may lead to a breakout in either direction.
⸻⸻⸻⸻⸻⸻⸻⸻⸻
📊 Chart Explanation
• The upper trendline acts as dynamic resistance.
• The lower trendline continues to provide support.
• Price compression inside the triangle reflects reduced volatility and indecision between buyers and sellers.
⸻⸻⸻⸻⸻⸻⸻⸻⸻
🧠 Observation
• Repeated reactions from both trendlines validate the triangle structure.
• The breakout probability generally increases as price approaches the apex.
• Candle closing behavior near the boundaries can provide additional confirmation.
⸻⸻⸻⸻⸻⸻⸻⸻⸻
📌 Summary
The market is currently trading inside a symmetrical triangle consolidation phase. Traders often monitor this structure for breakout confirmation before anticipating the next directional move .
⸻⸻⸻⸻⸻⸻⸻⸻⸻
⚠️ Disclaimer
📘 For educational purposes only.
🙅 Not SEBI registered.
❌ Not a buy/sell recommendation.
🧠 Purely a learning resource.
📊 Not Financial Advice.
USDJPY: Failed Weekly Breakdown Setting Up Buy-Side ExpansionUSDJPY swept the previous week’s low inside NWOG territory but failed to close below it, creating a classic liquidity grab instead of true bearish acceptance. Daily price action echoed the same behavior, taking liquidity beneath lows before reclaiming the range.
Current framework:
Previous week’s low swept and reclaimed
NWOG acting as discount support
Daily bearish FVG still overhead
H4 FVG below price acting as reaction zone
H1 sell-side liquidity resting beneath current structure
H1 equal highs and H4 highs acting as upside magnets
My expectation:
Price engineers one more move into nearby sell-side liquidity and the H4 FVG, forms support, then begins repricing higher.
Why this matters:
If sell-side liquidity gets cleared first, the path toward the H1 equal highs becomes much cleaner. And once those highs are taken, the market has room to expand toward the H4 highs above.
EURJPY Long – Discount Reversal Into Premium TargetsEntry: 182.773
Stop-Loss: 107.5 pips
Take-Profit: 211.5 pips
Risk-to-Reward: ~1:1.96
🧠 Trade Thesis
Price tapped into a deep discount zone, reacting strongly from a marked strong low inside a higher-timeframe demand region. This rejection aligns with the internal structure shift and confirms buyers defending the discounted area after a clean sweep of liquidity.
We also have:
A strong break of structure after sweeping lows
A retest back into equilibrium, respecting the ascending trendline
Premium inefficiencies above still unmitigated
Weak highs sitting above acting as liquidity magnets
This creates a clear narrative for long continuation toward the next premium zone.
🎯 Target & Invalidations
TP: +211.5 pips → targeting the premium range and weak highs above 184.900
SL: –107.5 pips → below the structure low that invalidates the demand reaction
Invalidation: A clean break and close below 182.00 discount zone
📈 Why This Trade Makes Sense
This is a textbook discount-to-premium rotation, where price sweeps the lows, finds strong displacement upward, and then retests into equilibrium for a continuation. As long as structure remains intact, bullish flow should carry price into higher liquidity levels.
💡 Summary
This trade captures:
✔ Premium-side inefficiency fill
✔ Strong imbalance + BOS confirmation
✔ Reaction from a protected low
✔ High RR with clear directional intent
Looking for continuation into premium as long as demand levels continue to hold.