USD/CAD Could Move Towards Strong Resistance AreaUSD/CAD moved with a slight negative bias around 1.3660 during today's trading session.
The market is stuck in an observation phase as investors balance hopes for peace in the Middle East with falling oil prices, while preparing for the release of crucial economic data tonight.
--------------------------------------------------------------------------------------------
✅ Fundamental Dynamics: Geopolitical & Oil Push-and-Pull
Contradictory factors are currently limiting directional movement in this pair:
- Peace Hopes: Optimism regarding the potential for a permanent peace deal between the US and Iran has reduced demand for the US Dollar (USD) as a safe haven, exerting mild downward pressure on USD/CAD.
- Oil Weakening: Conversely, easing geopolitical tensions have actually driven down crude oil prices. As a commodity currency, oil weakness has dragged down the Loonie (CAD), which acts as a support for this pair.
- Dual Data Focus: Tonight at 7:30 PM WIB, the market will receive the US Nonfarm Payrolls (NFP) report and Canadian Labor Data simultaneously. The divergence between these two data points will be a key directional indicator for USD/CAD.
--------------------------------------------------------------------------------------------
✅ Technical Analysis: Bullish Bias Remains
Technically, the market structure suggests that bulls remain in control in the short term:
- Immediate Resistance (1.3708): 38.2% Fibonacci level. A break above this level would open the way to the next psychological targets at 1.3757 (50.0% Fib) and 1.3807 (61.8% Fib).
- Crucial Support (1.3648 - 1.3653): The confluence of the 100-day moving average (SMA) and the 23.6% Fib. This is the "stronghold" that must be held to maintain the bullish structure.
- Distant Downside Target (1.3550): If Canadian data is very strong while the US NFP misses significantly, USD/CAD risks sliding to this structural bottom.
Forex market
The Day Ananya Finally Followed Her Trading PlanWelcome, @TradingView members. We are back with the next part of our trading mistakes series, where we continue exploring the psychological habits and decisions that silently destroy traders.
Before continuing further, make sure to visit the previous part of the article for a better understanding and context.
1. She stopped looking for the perfect strategy
For months, Ananya believed her losses came from a weak strategy. Every bad week pushed her to search for new indicators, better entries, and different systems. But no matter how much she changed, the results stayed inconsistent. Eventually, she realized the issue was not the strategy itself, but her inability to follow it with discipline.
2. She waited instead of forcing trades
One morning, Ananya opened her charts with a different mindset. Instead of trying to make money quickly, her only goal was to follow her trading plan exactly. Several trades looked tempting, but they did not fully match her setup. Normally, she would have entered anyway out of fear of missing out, but this time she waited patiently.
3. She learned that missing a trade is better than taking a bad one
A setup almost met her conditions, and she felt the urge to enter early. However, one important confirmation was missing. She stayed out of the trade and watched the setup fail minutes later. For the first time, she understood that discipline is not just about entering good trades, but also about avoiding unnecessary ones.
4. She accepted the risk before entering
Later, a clean setup finally appeared. The entry was valid, the stop loss was planned, and the risk was clear. Before entering, she accepted the possibility of losing the trade. This changed her mindset completely because she no longer felt the need to control every small market movement.
5. She respected her stop loss
After entering the trade, the price started moving slightly against her. Usually, this was the moment she would move her stop loss out of fear. This time, she did nothing. She let the trade play out exactly as planned instead of reacting emotionally to every candle.
6. She took a loss without revenge trading
The trade eventually hit her stop loss. In the past, this would have triggered frustration and emotional trading. She would immediately try to recover the money through random entries. But this time she stayed calm and accepted the loss as part of the process.
7. She trusted the process instead of her emotions
Another setup was formed later in the session. She followed her rules again without hesitation. As the trade moved into profit, fear returned in a different form. She wanted to close early and secure small gains before the market could reverse.
8. She let the winning trade reach its target
Instead of exiting early, Ananya trusted her plan and held the trade patiently. The setup eventually reached its full target. She realized that many of her past struggles came from cutting winners too early while allowing losses to grow too large.
9. She understood the difference between good losses and bad losses
That day taught her something important. A losing trade is not automatically a mistake. If the setup followed her rules and risk was controlled, the loss was acceptable. The real mistakes came from emotional decisions, not from normal market outcomes.
10. She realized consistency comes from discipline
By the end of the day, Ananya understood that consistency does not come from predicting the market perfectly. It comes from repeating the same disciplined process without letting fear, greed, or impatience take control. The strategy had not changed. The charts had not changed. She had.
To be continued...
By @BrightRally_Research
GBPCHF: Trend Shift UnderwayGBP/CHF appears to be forming a major bottom after completing a long corrective decline near 1.0290 . The chart suggests the pair may have finished a five-wave bearish structure, signaling a possible shift toward a new bullish cycle. Price is now attempting to stabilize above 1.0500, while recent buying pressure shows momentum is gradually improving. The first bullish confirmation level stands at 1.0800 , and a sustained breakout above it could trigger a stronger recovery phase. This is only a breakout setup.
The projected upside targets are 1.1075, 1.1065, and 1.1426 in the medium term. On the downside, 1.0290 remains the key support and the main invalidation level for the bullish outlook. As long as the price holds above that low, the broader structure favors recovery rather than continuation of the previous downtrend.
We will update further information soon.
@BrightRally_Research
EUR/USD m15Continue following the M15 bearish trend with confirmation on the lower timeframe (LTF), targeting the H1 key level. Always manage risk properly as the market moves according to expectations.
I entered this trade earlier. At the start of the London session, the price still hasn’t moved far from the entry point.
EURUSD Dual Scenario Setup — Trend Continuation + Mean ReversionCurrent EURUSD structure is presenting two clean opportunities on opposite sides of the range. One setup follows momentum continuation into premium supply, while the second looks for a deeper pullback into higher timeframe demand for a reversal long.
The market is currently trading inside an expansion phase after a strong bullish impulsive move. That creates room for both a short-term bearish reaction and a larger bullish continuation if deeper support gets tapped.
🔴 Scenario 1 — Mean Reversion Sell
Entry: 1.8051
Stop Loss: 22.1 pips
Take Profit: 52.7 pips
This short setup is based on price pushing into a premium resistance zone after an aggressive bullish expansion. The idea here is not trend reversal, but a temporary retracement back toward equilibrium after liquidity has been swept on the upside.
Reasons supporting the short:
• Price extended aggressively into supply
• Potential liquidity sweep above recent highs
• Mean reversion toward fair value imbalance
• Strong RR with controlled downside risk
As long as price remains below the upper resistance zone, sellers may step in for a corrective move lower.
🟢 Scenario 2 — Trend Continuation Buy
Entry: 1.6944
Stop Loss: 1.6720
Take Profit: 1.7397
This long setup represents the higher timeframe directional bias. The pullback into demand aligns with the rising trendline and offers a potential continuation entry within the broader bullish structure.
Reasons supporting the long:
• Bullish market structure remains intact
• Pullback into discounted demand zone
• Trendline support confluence
• Opportunity to rejoin momentum after correction
The expectation is for price to retrace into support, absorb liquidity, and continue the broader upside expansion.
📌 Overall Outlook
This is a clean example of how both mean reversion and trend continuation can coexist inside the same market structure.
The short setup targets temporary weakness after an overextended move, while the long setup prepares for continuation once price returns into value.
Patience is key here:
• Sell the premium
• Buy the discount
• Let price come into the levels instead of chasing candles
Risk management remains the priority on both setups.
NZDUSD – Short Setup from Premium Supply ZoneEntry: 0.59331
Stop Loss: 22.3 pips
Take Profit: 50.4 pips
NZDUSD has reacted from the premium zone after forming a clear change of character. Price tapped into the supply area sitting above the weak high and immediately rejected, signaling exhaustion in the recent bullish corrective move.
The short entry aligns with the retest of the mitigation zone, where sellers previously stepped in with strong displacement. The stop loss is positioned safely above the rejection wick to avoid noise from liquidity sweeps. The take profit targets the discount zone, where demand previously created a strong push upward—this offers a clean 1:2.2 risk-to-reward ratio.
As long as price continues to trade below the premium and maintains bearish order flow from the rejection, the expectation is for a continuation move back into the deeper discount levels.
disclaimer: For educational purpose only.
EURUSD Buy Setup from Trendline & Order Block Support
EURUSD is holding a constructive bullish structure after reacting strongly from the order block + FVG zone, aligned with ascending trendline support. The series of higher lows signals strengthening buying pressure, with price stabilizing above the near-term support region.
Currently, price is approaching the 1.1745–1.1760 resistance zone. A clean break and sustained hold above this area would confirm bullish continuation, opening the path toward the higher resistance around 1.1820–1.1835.
However, if price faces rejection at resistance, a pullback toward the 1.1700–1.1720 support/order block region is likely. This zone will be critical for maintaining the bullish bias—any breakdown below the trendline and major support could weaken momentum and shift structure.
EURUSD: Discount Reaction Targeting External HighsEURUSD traded straight into a key discount zone after a clean bearish leg, tapping into an area where smart money typically starts paying attention. Notice how price immediately responded once sell-side liquidity was pressured.
That’s the clue.
Current framework:
Bearish move into discount pricing
Reaction from demand / imbalance
Weak continuation lower
External liquidity resting above the highs
GBPUSD SELL SETUP🚨 GBPUSD SELL SETUP 🚨
📍 Zone-Based Entry Strategy
🎯 Strong Supply Zone Identified
⏳ Waiting for Confirmation Entry
❌ No Overtrading
✅ One Strategy – High Discipline
💡 Plan:
➡️ Price enters zone
➡️ Wait for rejection candle
➡️ Enter SELL with confidence
📊 Risk Management:
⚖️ Risk: 1–2% per trade
🎯 Target: Clean RR Setup
🧠 “I don’t chase trades. I wait for my zone.”
USDCAD: Premium Rejection Setting Up Sell-Side RaidUSDCAD delivered a sharp displacement lower, then retraced straight back into a premium supply zone and prior inefficiency. Now price is stalling exactly where it should if the bearish narrative is still intact.
This is the key:
The market already showed aggressive selling intent.
Retracements after displacement are often rebalancing moves… not reversals.
Current framework:
Strong bearish impulse established
Price retracing into premium / supply
Weak acceptance near highs
Sell-side liquidity resting below current range
My expectation:
A rejection from this zone followed by expansion lower into the resting liquidity beneath the lows.
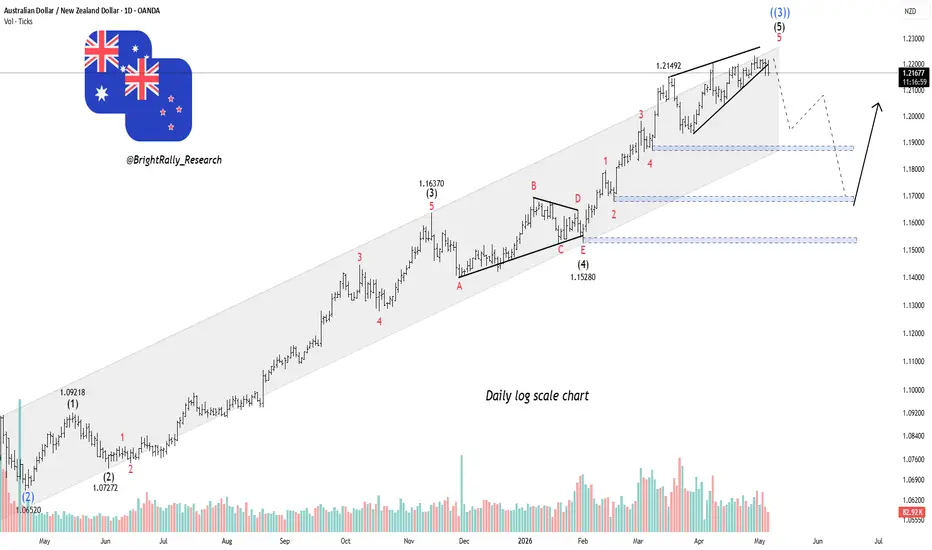
AUDNZD: Breakout or Bull Trap?AUD/NZD remains in a strong long-term uptrend, but the chart suggests the pair is likely completing the final stage of its bullish Elliott Wave structure near 1.2200 . Price is still holding inside the rising channel, showing buyers remain active, yet the recent slowing momentum and wedge formation indicate the rally may be running out of strength. If buyers manage to break above 1.2200 , the next upside target stands near 1.2300 , where the current bullish cycle could fully mature.
The projection on the chart points to a corrective decline after the top is formed. The first downside level to watch is 1.1900 , where temporary support may appear. A deeper pullback could then extend toward 1.1700 , which is the key support level for the medium-term trend. From there, the chart suggests buyers may return and attempt another recovery wave toward the 1.2000 area. As long as the price stays above 1.1528 , the broader bullish structure remains intact despite any short-term correction.
We will update further information soon.
BrightRally_Research
GBP/USD Medium-Term ReboundGBP/USD managed to build recovery momentum for the second consecutive day. The sudden shift in White House rhetoric has triggered a sell-off in the US Dollar (USD) and provided a breather for the British pound.
-------------------------------------------------------------------------------------------
✅ Geopolitics: Temporary Ceasefire for 'Project Freedom'
Market sentiment turned optimistic following signs of de-escalation from Washington:
- ⚡Trump's Strategic Pause: President Donald Trump announced a temporary halt to the "Project Freedom" initiative in the Strait of Hormuz. This step was taken to provide space for diplomatic negotiations to see if a permanent peace agreement with Iran can be reached.
- ⚡Defense Secretary Hegseth's Statement: Defense Secretary Pete Hegseth confirmed that the ceasefire remains in place and that the US has no intention of escalating the conflict. These comments eased fears of an all-out war that had previously triggered a flight of capital to the USD.
-------------------------------------------------------------------------------------------
✅ Policy Divergence: BoE Remains Vigilant
The Pound Sterling enjoys solid fundamental support:
- ⚡BoE Rate Hike Signals: Contrary to expectations of a Fed tapering off, the Bank of England (BoE) continues to signal that it is ready to raise interest rates if domestic inflationary pressures prove persistent.
- ⚡Capital Flows: The combination of a weaker dollar and a relatively hawkish pound creates a clear path of strength for GBP/USD towards the psychological level of 1.3600.
-------------------------------------------------------------------------------------------
✅ GBP/USD Technical Analysis (Intraday)
Technically, the current path of least resistance for the pair is upwards:
- ⚡Immediate Resistance (1.3600): A key psychological barrier. A break above this level would pave the way for further gains towards 1.3650.
- ⚡Strong Support (1.3510 - 1.3515): The weekly low that now serves as a basis for structural support.
- ⚡Momentum Indicators: The rise from the low indicates healthy buying interest. Today's market focus will be on tonight's release of ADP private sector employment data as a leading indicator for Friday's NFP.
USDCAD SHOWING A GOOD UP MOVE WITH 1:10 RISK REWARDUSDCAD SHOWING A GOOD UP MOVE WITH 1:10 RISK REWARD
DUE TO THESE REASON
A. its following a rectangle pattern that stocked the market
which preventing the market to move any one direction now it trying to break the strong resistant lable
B. after the break of this rectangle it will boost the market potential for break
C. also its resisting from a strong neckline the neckline also got weeker ald the price is ready to break in the outer region
all of these reason are indicating the same thing its ready for breakout BREAKOUT trading are follws good risk reward
please dont use more than one percentage of your capitalfollow risk reward and tradeing rules
that will help you to to become a bettertrader
thank you
April Month Trade ReportApril 2026 Performance Summary :
This month our system generated 20 trade ideas , all with a strict 1% risk per position, and all trades are publicly tracked on my this TradingView profile.
Monthly Performance Highlights
Total R: +12.18R
Win Rate: 50%
Total Trades: 20
Average Win: +2.35R
Average Loss: -1.00R
Despite a 50% win rate, the asymmetric R-multiple structure allowed the system to produce double-digit R in April.
Trade Logs:
DATE PAIR RISK RESULT OUTCOME
01 Apr GBP/USD 1% +3R WIN
01 Apr USD/CHF 1% +2R WIN
02 Apr XAU/USD 1% +3R WIN
10 Apr NASDAQ 1% -1R LOSS
13 Apr XAU/USD 1% +2R WIN
14 Apr USD/JPY 1% +2.6R WIN
15 Apr GBP/USD 1% +2.5R WIN
15 Apr XAU/USD 1% +2R WIN
15 Apr EUR/USD 1% -1R LOSS
15 Apr NASDAQ 1% -1R LOSS
17 Apr NASDAQ 1% -1R LOSS
20 Apr XAU/USD 1% -1R LOSS
21 Apr CAD/JPY 1% -1R LOSS
23 Apr XAU/USD 1% Entry not filled NEUTRAL
27 Apr USD/JPY 1% Breakeven NEUTRAL
27 Apr EUR/JPY 1% -1R LOSS
28 Apr XAU/USD 1% -1R LOSS
28 Apr GBP/JPY 1% +2.08R WIN
28 Apr GBP/USD 1% +2R WIN
All trades executed with strict 1% risk per trade. Results are in R-multiples.
Track record is publicly verifiable on TradingView. Past performance does not guarantee future results.
📌 What Worked This Month
High-quality setups in XAU/USD, GBP/USD, and JPY pairs delivered most of the edge.
R-multiple-based structure kept the losses uniform and small.
Tight execution around session timings prevented overtrading.
⚠️ What Needs Improvement
NASDAQ trades underperformed — reconsidering timing + volatility filter.
Need stricter avoidance of choppy gold conditions (multiple –1R sequences).
📈 Final Notes
All trades are publicly verified on TradingView.
Past performance does not guarantee future results.
This report is part of my systematic tracking and transparency for PCON Research & Strategy.
USD/ACD Potential to Weaken FurtherUSD/CAD moved within a narrow range around 1.3620 during today's Asian session.
The pair is caught between two major forces: surging oil prices, which are strengthening the Loonie (CAD), and a strengthening US Dollar (USD), driven by safe-haven sentiment and expectations of hawkish Federal Reserve policy.
----------------------------------------------------------------------------------------
✅ Fundamental Dynamics: Oil vs. Safe-Haven Sentiment
Contradictory factors are currently keeping the pair in an oscillatory phase:
- ⚡Escalation in the Persian Gulf: Missile and drone attacks on the port of Fujairah (UAE) and the US "Project Freedom" initiative have triggered a surge in crude oil prices. As a commodity currency, the CAD has found significant support, limiting USD/CAD's gains.
- ⚡USD Strength: On the other hand, President Trump's threat to "wipe Iran off the face of the earth" reinforces the USD's status as a primary safe-haven asset. Furthermore, markets are now starting to price in the possibility of a Fed rate hike later in the year, providing a boost to the greenback.
- ⚡Lack of Direction: This combination discourages traders from placing aggressive bets, causing the spot price to become trapped in a sideways pattern.
----------------------------------------------------------------------------------------
✅ Technical Analysis (H4): Selling Pressure Begins to Fade
Technically, the market structure indicates weakening bearish momentum, but a trend reversal has not yet been confirmed:
- ⚡Determination Zone (1.3650): This is a crucial confluence area consisting of the 100-period SMA and the 23.6% Fibonacci Retracement. As long as the price remains below this level, the short-term bias remains mildly bearish.
- ⚡Key Resistance (1.3650): The threshold for a broader bullish recovery.
- ⚡Crucial Support (1.3553): The most recent swing low. A decline below this level would pave the way for a deeper decline towards the 1.3500 area.
EURUSD NEXT MOVE POSSIBLE#EURUSD UPDATE...!!!
Sell limited - 1.17250-1.17300
If price stay below 1.17600, then next target 1.17000,1.16600 and above that 1.18000
Plan;If price break 1.17250-1.17300 area,and stay below 1.17600 ,we will place sell order in EURUSD with target 1.17000,16600 & stop loss should be placed at 1.17600