USDJPY Trade Idea — Short SetupPair: USDJPY
Bias: Sell / Rejection from resistance
Entry: 159.496
Stop Loss: 159.736 (24 pips)
Take Profit: 158.831 (66.5 pips)
Risk-to-Reward: 1 : 2.77
Trade Thesis:
USDJPY is pushing into a key intraday resistance zone after an aggressive upward move. Price is now testing a supply area where previous reactions occurred, making it a favorable location for a short-position fade. The setup aligns with mean reversion potential after short-term exhaustion.
Confirmation Factors:
Price trading into marked resistance / supply zone
Extended bullish impulse into overhead liquidity
Favorable RR with nearby invalidation
Potential retracement toward lower demand zone
Invalidation:
A clean break and hold above 159.736 would invalidate the bearish rejection idea and suggest continuation higher.
Management Plan:
At +24 pips, consider moving SL to breakeven
Partial profits around 159.10 area if momentum stalls
Hold runner toward full TP at 158.831
Execution Mindset:
This is a location-based short. Edge comes from disciplined execution and respecting the stop, not prediction.
Professional Note: Clean setups like this with nearly 1:3 RR are how traders compound over time—small risk, asymmetric reward.
Forex market
EURJPY MTFAHello traders , here is the full multi time frame analysis for this pair, let me know in the comment section below if you have any questions , the position will be taken only if all rules of the strategies will be satisfied. wait for more price action to develop before taking any position. I suggest you keep this pair on your watchlist and see if the rules of your strategy are satisfied.
🧠💡 Share your unique analysis, thoughts, and ideas in the comments section below. I'm excited to hear your perspective on this pair .
💭🔍 Don't hesitate to comment if you have any questions or queries regarding this analysis.
USDJPY MTFAHello traders , here is the full multi time frame analysis for this stock , let me know in the comment section below if you have any questions , the position will be taken only if all rules of the strategies will be satisfied. wait for more price action to develop before taking any position. I suggest you keep this pair on your watchlist and see if the rules of your strategy are satisfied.
🧠💡 Share your unique analysis, thoughts, and ideas in the comments section below. I'm excited to hear your perspective on this pair .
💭🔍 Don't hesitate to comment if you have any questions or queries regarding this analysis.
USDCAD MTFAHello traders , here is the full multi time frame analysis for this stock , let me know in the comment section below if you have any questions , the position will be taken only if all rules of the strategies will be satisfied. wait for more price action to develop before taking any position. I suggest you keep this pair on your watchlist and see if the rules of your strategy are satisfied.
🧠💡 Share your unique analysis, thoughts, and ideas in the comments section below. I'm excited to hear your perspective on this pair .
💭🔍 Don't hesitate to comment if you have any questions or queries regarding this analysis.
USDCHF MTFAHello traders , here is the full multi time frame analysis for this stock , let me know in the comment section below if you have any questions , the position will be taken only if all rules of the strategies will be satisfied. wait for more price action to develop before taking any position. I suggest you keep this pair on your watchlist and see if the rules of your strategy are satisfied.
🧠💡 Share your unique analysis, thoughts, and ideas in the comments section below. I'm excited to hear your perspective on this pair .
💭🔍 Don't hesitate to comment if you have any questions or queries regarding this analysis.
NZDUSD MTFA Hello traders , here is the full multi time frame analysis for this stock , let me know in the comment section below if you have any questions , the position will be taken only if all rules of the strategies will be satisfied. wait for more price action to develop before taking any position. I suggest you keep this pair on your watchlist and see if the rules of your strategy are satisfied.
🧠💡 Share your unique analysis, thoughts, and ideas in the comments section below. I'm excited to hear your perspective on this pair .
💭🔍 Don't hesitate to comment if you have any questions or queries regarding this analysis.
AUDUSD MTFAHello traders , here is the full multi time frame analysis for this stock , let me know in the comment section below if you have any questions , the position will be taken only if all rules of the strategies will be satisfied. wait for more price action to develop before taking any position. I suggest you keep this pair on your watchlist and see if the rules of your strategy are satisfied.
🧠💡 Share your unique analysis, thoughts, and ideas in the comments section below. I'm excited to hear your perspective on this pair .
💭🔍 Don't hesitate to comment if you have any questions or queries regarding this analysis.
EURUSD MTFA Hello traders , here is the full multi time frame analysis for this stock , let me know in the comment section below if you have any questions , the position will be taken only if all rules of the strategies will be satisfied. wait for more price action to develop before taking any position. I suggest you keep this pair on your watchlist and see if the rules of your strategy are satisfied.
🧠💡 Share your unique analysis, thoughts, and ideas in the comments section below. I'm excited to hear your perspective on this pair .
💭🔍 Don't hesitate to comment if you have any questions or queries regarding this analysis.
AUDUSD price breakes 0.8686 then will hit 0.8703 and price breakBased on your parameters and the current market data as of Sunday, April 26, 2026, here is a technical analysis of the AUDUSD pair.
Currently, the price is hovering around 0.7145, consolidating after a period of volatility driven by geopolitical developments in the Middle East and shifting expectations for RBA and Fed interest rates.
Technical Analysis & Scenarios
The levels you’ve identified align closely with the current "breakout vs. correction" setup observed on the H4 and Daily charts.
Scenario 1: Bullish Breakout (The 0.7193 Level)
Trigger: A clean break and consolidation (H4 close) above 0.7193.
Target: 0.7221 (Recent multi-year high).
Analysis: This level acted as a major rejection point in mid-April. Breaking above it would confirm that the primary uptrend has resumed.
Momentum: The RSI is currently near 60, suggesting there is still "room to run" before reaching overbought conditions (70+).
Catalyst: Stronger-than-expected Australian Trimmed Mean CPI data (due this Wednesday) could provide the fundamental "fuel" for this move.
Scenario 2: Bearish Correction (The 0.7110 Level)
Trigger: Price breaks and sustains below 0.7110.
Target: 0.7080 (20-day EMA and key psychological support).
Analysis: 0.7110 has served as a 10-day low and immediate support. If this fails, the pair is likely to test the 0.7080 region, which is reinforced by the 20-period Exponential Moving Average (EMA).
Downside Risk: If 0.7080 fails to hold, the next major structural support sits much lower, around 0.6945.
Key Market Drivers for the Week
Australian Inflation: The RBA is watching trimmed mean inflation closely. If it remains high, a May rate hike becomes almost certain, supporting the AUD.
FOMC & US Data: The Federal Reserve's rate decision and US GDP/PCE data this week will determine the Greenback's strength. A hawkish Fed could trap the AUD below your 0.7193 resistance.
Risk Sentiment: As a "risk-on" currency, AUD remains sensitive to geopolitical headlines. Any further escalation in the Middle East would likely trigger the bearish scenario toward 0.7080.
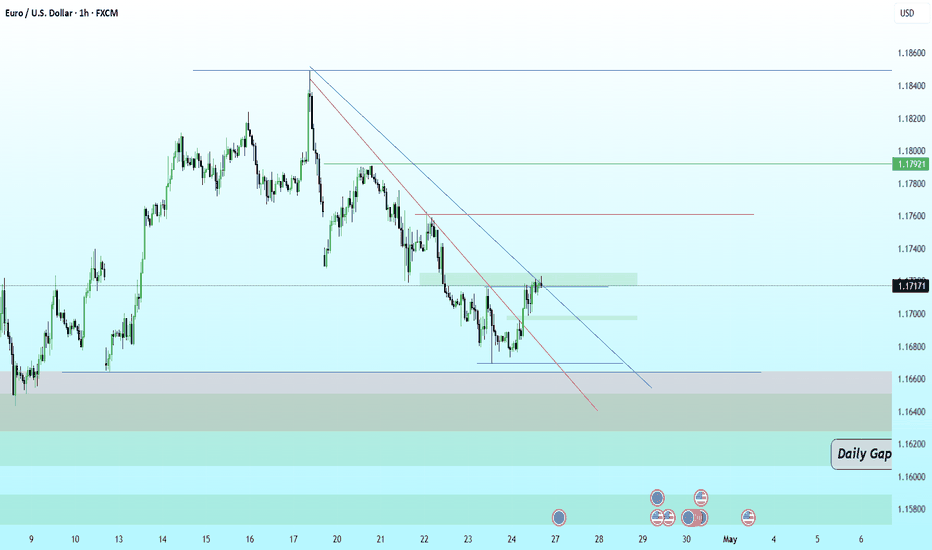
EURUSD Weekly Outlook (27th April to 1st May)In this video I have discussed about the possible move which can happen in the upcoming week. I am also discussed what situation may occur depending upon the Monday open being Gap up/Gap down/Neutral. What possible move may occur on which day of the week and which side will show a stronger delivery have been discussed too. Hope you will find this informative.
EURUSD – Liquidity Setup & Bearish Continuation From Supply
EURUSD is currently trading within a clear bearish structure, respecting a descending trendline and forming consistent lower highs. Price is hovering around a mid-range equilibrium zone, suggesting a temporary consolidation phase before the next impulsive move.
A short-term move above the trendline remains possible, but this is likely to act as a liquidity grab rather than a true reversal. Any upside push into the marked supply zone can form a lower high, offering a high-probability sell opportunity. Rejection from this area would confirm continued bearish intent.
The overall draw on liquidity remains to the downside, with sell-side liquidity resting below recent lows acting as the primary target. As long as price stays below the major supply region, the bearish bias remains intact.
Traders should watch for confirmation signals such as rejection wicks, lower timeframe structure breaks, or weak bullish momentum before entering positions.
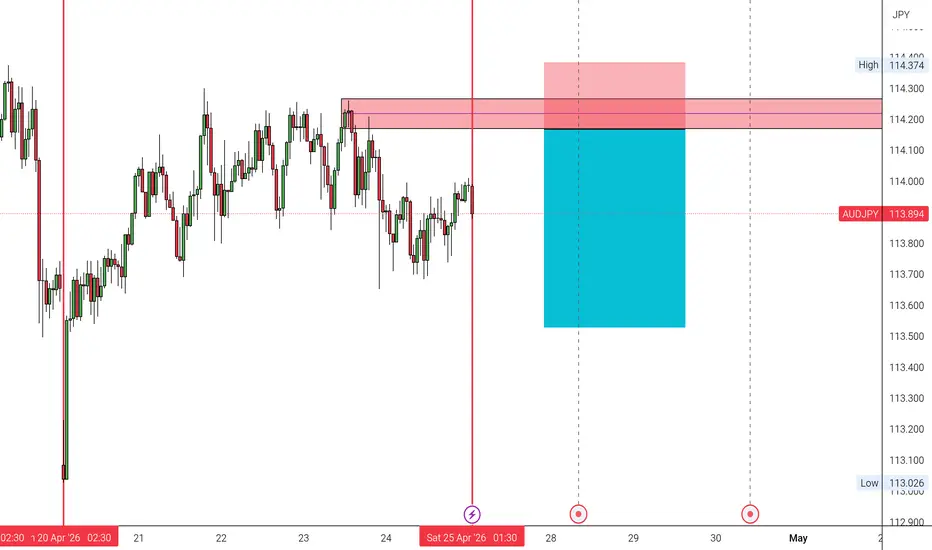
AUDJPY – Rejection at Key Supply ZoneAUDJPY – Rejection at Key Supply Zone 🔴📉
Price has tapped into a strong supply zone (114.20–114.30) and showing clear rejection signs.
Market structure is still ranging, but this zone has historical selling pressure.
Plan: • Waiting for confirmation (bearish rejection / weak retest)
• Entry after confirmation only – no impulsive trades
• Targeting downside liquidity
• Risk managed above the zone
Key Idea:
Rejection + Key Level = High probability move ⚡
Patience is the edge. Let the market confirm.
EURUSD_M15Price delivered a clean impulsive move, tapped into a supply / imbalance zone, and immediately started printing weaker candles. Momentum is fading right where it should if distribution is underway.
What’s on the table:
Displacement into premium (inefficiency created)
Reaction from supply zone
Early signs of loss of bullish strength
Game plan:
📍 Wait for a lower high / micro structure shift
📍 Target the imbalance + sell-side liquidity below
Invalidation: clean acceptance above the supply.
EURUSD – Sell Side Delivery Loading…Price has tapped into a 4H/1D supply (premium zone) after a clean displacement from the lows, forming a classic buy-side liquidity draw → mitigation → distribution setup.
The recent push up looks like nothing more than a retracement into inefficiency (FVG + OB confluence) rather than genuine bullish intent.
Read the tape, not the candles:
Buy-side liquidity resting above recent highs has been engineered ✔️
Price delivered into supply / bearish order block ✔️
Structure still printing lower highs on HTF ✔️
As long as the daily high remains intact, the narrative stays simple:
👉 This is a sell in premium, not a buy in hope.
Expectation:
Short-term choppiness or a minor inducement higher to trap late buyers, followed by aggressive sell-side expansion targeting:
Internal liquidity first
Then external range lows / equal lows
Final draw: discount zone imbalance fill
Invalidation:
Clean break and acceptance above the marked daily high → narrative shifts, no ego trades.
Execution mindset:
Don’t chase the move. Let price confirm displacement from supply, then ride the delivery.
AUDUSD_D📊 AUDUSD – Daily Elliott Wave Analysis
On the daily timeframe, based on Elliott Wave Theory, the overall structure suggests that the market is still developing a larger Wave 5 to the upside, supported by the strength of buyers.
The current Wave 5 appears to be subdividing into five smaller waves, and at the moment, price is likely forming Wave 4 within the larger Wave 5.
🔄 Correction Scenario (Wave 4):
The expected corrective zone for Wave 4 is between 0.70573 – 0.70383.
⚠️ However, considering a regular bullish divergence on the 4-hour timeframe, there is a possibility that price may not fully reach this correction zone and could resume its upward movement earlier.
🚀 Bullish Target (Wave 5 Completion):
The projected target zone for the completion of the larger Wave 5 is 0.72826 – 0.72961.
❌ Invalidation Level:
A move below 0.69815 would invalidate this wave count and the bullish outlook.
🌍 Fundamental Perspective (Aligned with Bullish View)
From a fundamental perspective, several factors may support further upside in AUD/USD:
* Commodity Strength: The Australian dollar is closely tied to commodity exports; rising commodity prices can support AUD.
* Monetary Policy Outlook: If the Reserve Bank of Australia maintains a relatively hawkish stance compared to the Federal Reserve, this could favor AUD strength.
* Risk Sentiment: A positive global risk environment tends to benefit risk-sensitive currencies like AUD.
That said, any unexpected strengthening of the US dollar or shifts toward risk aversion could delay or weaken the bullish scenario.
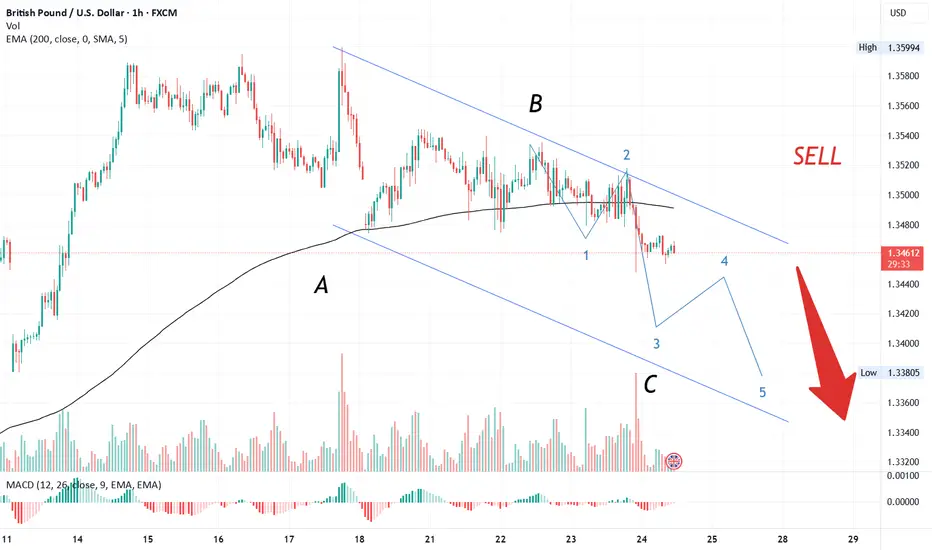
#GBPUSD getting weaker dollar rises💷💵📈📉🔥 GBPUSD Zig‑Zag in Motion 🚀💹
From 17 April, GBPUSD entered a zig‑zag correction:
🔹 A wave: Formed on 20 April 📊
🔹 B wave: Rose but stayed below 61.8% retracement 📉
🔹 C wave: Now unfolding with its 5 sub‑waves 📈
👉 Currently, price is in the 3rd sub‑wave of C, showing strong momentum ⚡.
🎯 Projection: Possible drawdown toward 1.33700 💵📉.
---
💡 Trader’s Insight:
C waves often deliver powerful moves — GBPUSD could extend lower before stabilizing 🧐📊.
EURUSD Retest Zone – Continuation or BreakdownEURUSD recently showed a strong bullish move, forming a clear structure of higher highs and higher lows. However, after reaching the recent highs, the market started showing signs of weakness with lower highs forming in the short term.
This indicates that the market is currently in a pullback phase rather than a complete reversal.
Price is now approaching an important confluence zone where the ascending trendline support aligns with previous structure support. This area becomes crucial because it represents where buyers have stepped in before.
If this support holds, we can expect the market to resume its bullish trend and potentially move back toward the key resistance zone above.
However, if price breaks below this level, it may indicate deeper correction before any continuation.
For now, the focus remains on how price reacts at this support zone.
Disclaimer:
This analysis is for educational purposes only and not financial advice. Trading involves risk. Always manage your risk properly before taking any trade.
— @TraderRahulPal
SCA Registered Financial Influencer (Dubai, UAE)
GBPUSD_M15Clean sell-side sweep → immediate rejection → structure shift brewing.
This isn’t strength out of nowhere. It’s engineered.
What the chart is whispering:
Liquidity below 1.3480 taken efficiently
Sharp reaction confirms demand sitting right under price
Internal structure starting to flip bullish
Execution narrative:
Price taps the mitigation block, shakes out late sellers, and now holds above it like a floor just got installed.
Game plan:
Small pullback into the OB / imbalance zone
Hold above the swept low
Expansion targeting:
1.3505 (internal liquidity)
1.3520+ (external range highs)
Invalidation:
Clean break and acceptance below 1.3480 → setup collapses.
EURUSD SHOWING A GOOD DOWN MOVE WITH 1:8 RISK REWARDEURUSD SHOWING A GOOD DOWN MOVE WITH 1:8 RISK REWARD
DUE TO THESE REASON
A. its following a rectangle pattern that stocked the market
which preventing the market to move any one direction now it trying to break the strong resistant lable
B. after the break of this rectangle it will boost the market potential for break
C. also its resisting from a strong neckline the neckline also got weeker ald the price is ready to break in the outer region
all of these reason are indicating the same thing its ready for breakout BREAKOUT trading are follws good risk reward
please dont use more than one percentage of your capitalfollow risk reward and tradeing rules
that will help you to to become a bettertrader
thank you
GBPUSD_M15Price has been compressing inside a clear intraday range, respecting both sides like it’s under contract. Liquidity has been building above equal highs while downside inefficiencies remain partially filled.
Current positioning suggests a classic sell-side raid before expansion.
Read the tape, not your emotions:
Recent lows look engineered → weak hands already flushed
Internal structure shifting from bearish momentum to absorption
Price hovering near a discount zone within the range
Game plan:
Expect a minor dip to sweep liquidity below the recent low, followed by displacement to the upside targeting:
Internal range highs
External liquidity resting above 1.3530–1.3550
If price fails to show displacement after the sweep, bias is invalid.
Narrative:
This isn’t random movement. It’s accumulation before expansion.
Smart money doesn’t chase… it engineers entries.
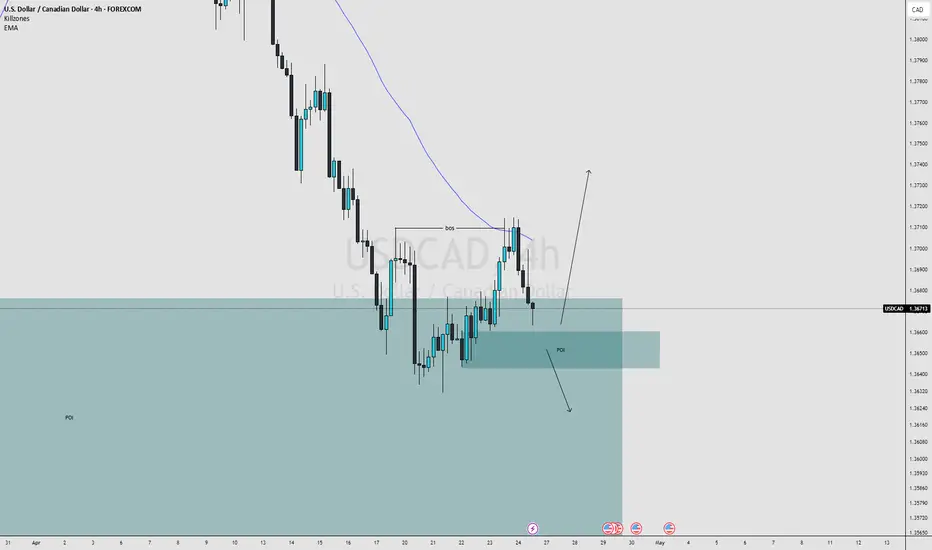
USDCAD | Intraday Long Bias from HTF Value Area Low📈
Timeframe: Intraday / Day Trade
Bias: Bullish (Mean Reversion)
Setup Type: Value Area Rotation
⸻
🧠 Trade Idea:
USDCAD has rotated into the HTF Value Area Low (VAL), positioning price in a discount zone where buyer activity is expected. The idea is to capitalize on a potential rotation back toward higher value as responsive buyers step in.
⸻
📊 Execution Plan:
* Entry: Near VAL with confirmation (rejection / bullish response)
* Stop Loss: Below VAL (acceptance below = invalidation)
* Target 1: Value Area Mid (POC)
* Target 2: Value Area High (VAH)
⸻
⚖️ Risk Management:
If price accepts below VAL, the long thesis is invalidated. Risk is clearly defined at the lower boundary, allowing for a controlled downside while maintaining upside potential toward value.
⸻
⚡ Confluence:
✔️ HTF VAL support
✔️ Discount pricing
✔️ Mean reversion setup
✔️ Clear invalidation level
⸻
💬 Final Thoughts:
This is a location-based trade—buying at value extremes with a defined risk. The key is watching for buyer response at VAL; without it, the setup loses validity.
⸻
Not financial advice. Manage your risk.
EURUSD UPDATE | Short from 200D VAH → Targeting POCStatus: 🟡 Active Trade
Bias: Bearish (Mean Reversion)
Setup Type: Value Area Rejection
⸻
🧠 Trade Idea:
Currently holding a short position from the 200-day Value Area High (VAH) after price rotated into a premium zone and showed initial signs of rejection.
The core idea remains a mean reversion play — expecting price to move from value high → fair value (POC).
⸻
📊 Market Context:
Price has recently pushed higher after tapping VAH, indicating some buying pressure building near highs. This puts the market at a key decision point:
👉 Rejection = continuation lower (favors short)
👉 Acceptance above VAH = invalidation (bullish shift)
⸻
📌 Key Levels:
* Entry Zone: 200D VAH (~1.1800 area)
* Invalidation: Sustained acceptance above VAH
* Intermediate Level: 1.1720–1.1700 (possible reaction / partials)
* Target (POC): ~1.1640–1.1660
⸻
⚖️ Trade Plan:
✔️ If Rejection Holds:
* Maintain position
* Trail stops above lower highs
* Let price rotate toward POC
❌ If Acceptance Above VAH:
* Strong bullish closes above resistance
* Exit or reduce position
* Avoid holding against acceptance
⸻
⚡ Confluence:
✔️ Premium entry at VAH
✔️ Mean reversion setup
✔️ Clear target (POC magnet)
✔️ Defined invalidation
⸻
💬 Final Thoughts:
This is a clean volume profile trade, but price is currently testing the strength of sellers at value high. The outcome depends on acceptance vs rejection at these levels.
Staying flexible here is key — don’t marry the bias, follow the value.
⸻
Not financial advice. Manage risk accordingly.