USD/JPY Continues Its WeakeningUSD/JPY continued its decline for the second consecutive day, dropping to around 159.90 during Friday's Asian session.
Selling pressure on the greenback was triggered purely by the release of Tokyo's foreign exchange reserves data, which confirmed large-scale physical intervention in the forex market, combined with the release of very hawkish Japanese domestic wage growth data.
------------------------------------------------------------------------
✅ Fundamental Dynamics: Record Foreign Exch
Forex market
Why Most Traders Lose Money Even With Winning StrategiesYour Strategy Isn't the Problem. Your Position Size Might Be.
Most traders spend years searching for the perfect entry.
They study price action, indicators, support and resistance, liquidity, market structure, ICT concepts, smart money concepts, and order flow.
Yet many still fail.
Why?
Because they focus on how to enter a trade , while professional traders focus on how much to risk on a trade .
Dr. Van K. Tharp, one of the world's leading experts on trader psychology and position sizing
AUDUSD Tests Critical Support Near 0.7100AUDUSD remains under pressure below both H4 EMAs while traders focus on upcoming US labor-market data.
Buy Setup
Entry: 0.7100–0.7080 support hold
SL: below 0.7065
TP1: 0.7150
TP2: 0.7180
TP3: 0.7200
Sell Setup
Entry: H4 close below 0.7080
SL: above 0.7115
TP1: 0.7050
TP2: 0.7020
TP3: 0.7000
Current bias: neutral-to-bearish until AUDUSD reclaims 0.7160.
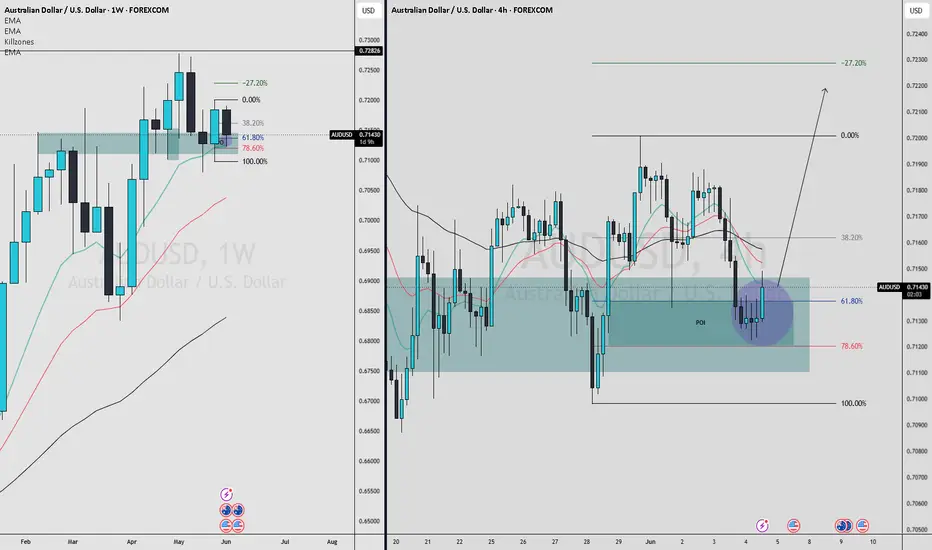
AUDUSD ContinuationTrading above the EMAs in weekly and also lined up with a flip. Even though there is only 1 day left for the weekly candle to close, the weekly PA is bearish till now. but still we can expect Possible continuation of the bullish trend.
Will take the trade if entry conditions are satisfied.
EUR/USD: Euro Refuses to Fall Below 1.1600The OANDA:EURUSD EURUSD currency pair demonstrated strong resilience by rebounding from the psychological 1.1600 level during Thursday's Asian session.
The euro's move successfully erased most of its daily losses from its previous weekly low, capitalizing on easing tensions on the Lebanon-Israel border, although tomorrow's major employment data release limited any aggressive upward movement.
---------------------------------------------------------------------------------
✅ Fundamental Dyna
GBPUSD Struggles Below 1.3450GBPUSD remains under pressure after failing to sustain gains above 1.3450–1.3460. The pair is trading below both EMAs, keeping short-term momentum bearish.
Sell Setup
Entry: 1.3450–1.3460 rejection
SL: 1.3490
TP1: 1.3400
TP2: 1.3370
TP3: 1.3350
Buy Setup
Entry: H4 close above 1.3460
SL: 1.3425
TP1: 1.3500
TP2: 1.3520
Current bias: bearish while price remains below 1.3460.
USDJPY Near 160: Wait for Retest, Not FOMOUSDJPY is still bullish on H4 while price holds above the EMA zone around 159.50–159.10. But the 160 area is too sensitive because of possible Japanese intervention risk.
Buy plan
Entry: 159.50–159.10 retest
SL: below 158.85
TP1: 160.00
TP2: 160.50
Breakout plan
Entry: H4 close above 160.00
SL: below 159.50
TP1: 160.50
TP2: 161.00
Risk note
Avoid chasing directly under 160 because verbal or real intervention from Japan could trigger sharp pullbacks.
EURUSD Faces Key Resistance Around 1.1660EURUSD is stabilizing on H4 after the strong drop from 1.1780 toward 1.1580.
Price is now consolidating between 1.1600–1.1660, while the EMA cluster around 1.1640–1.1655 continues acting as important resistance.
The market remains cautious ahead of ISM data, Powell’s speech, and US jobs numbers, while ECB inflation expectations continue supporting the euro.
Trade Plan
Buy setup: watch the 1.1630–1.1620 support zone. If buyers defend it clearly, targets are 1.1660 and 1.1680.
Continuation bu
GBP/USD Heads Towards Resistance LevelGBP/USD managed to attract steady buying interest after experiencing sharp two-way fluctuations (whipsaw) the previous day.
The spot price held firmly above the 1.3450 level during today's Asian session, although its overall movement remained confined within a narrow range over the past three days due to the intense push and pull of news from the Middle East.
----------------------------------------------------------------------------------------------
✅ Fundamental Dynamics: "Social Media Di
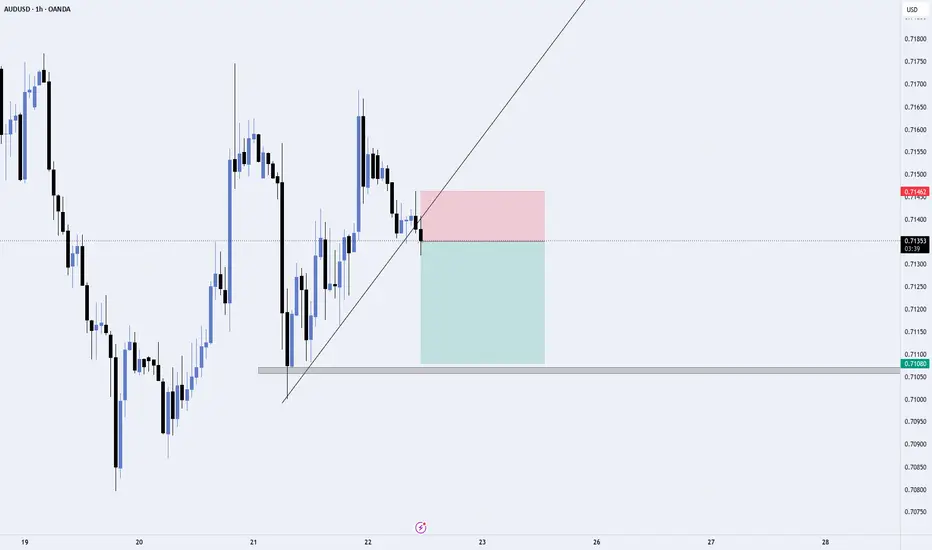
AUDUSD H1 — Clean rejection from trendline resistance.Price is showing weakness after tapping the ascending trendline, and sellers are stepping in with momentum.
📍 Entry: 0.7134
🎯 Target: 0.7108
🛑 Stop Loss: 0.7146
Confluence:
• Trendline rejection
• Lower high formation
• Bearish momentum candles
• Liquidity resting near support zone
If sellers maintain control below the trendline, price can continue sliding toward the demand area. Waiting for confirmation and proper risk management is key.
GBPCAD Continuation SetupIn GBPCAD, I can currently spot a strong continuation setup on the daily timeframe. Price is reacting cleanly from the 10–20 EMA zone, and the overall structure remains bullish. Price is trading above the 50 EMA, as well as above the 10 and 20 EMA, which confirms higher timeframe bullish strength. At the same time, price is also bouncing directly from the 10–20 EMA region, making the setup technically clean for possible continuation towards the upside.
Another important factor is that this EMA
GBPUSD 2H Structure Repetition SetupWhile analyzing the 2H timeframe, I noticed something very interesting. A similar market structure has already formed in the past, and now the market appears to be creating the same pattern once again.
One of the most important skills in trading is recognizing repeated structures. The market often leaves clues through previous price action, and if we can identify those patterns early, it becomes much easier to understand potential future movement.
In this case, the current structure closely re
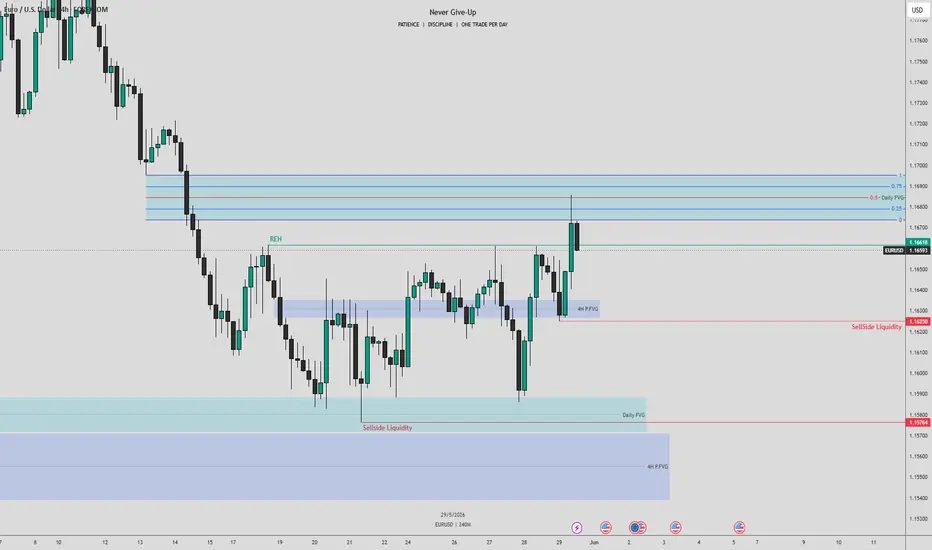
31/05/2026 EUR/USD AnalysisFOREXCOM:EURUSD
This is my analysis for EUR/USD.
EUR/USD is currently trading from its Daily FVG and has the potential to deliver a higher-timeframe market structure shift. On the lower timeframe (15M), price has already shown a market structure shift, indicating a possible change in order flow.
With that in mind, EUR/USD could move lower to sweep the remaining sell-side liquidity before continuing with its intended directional move.
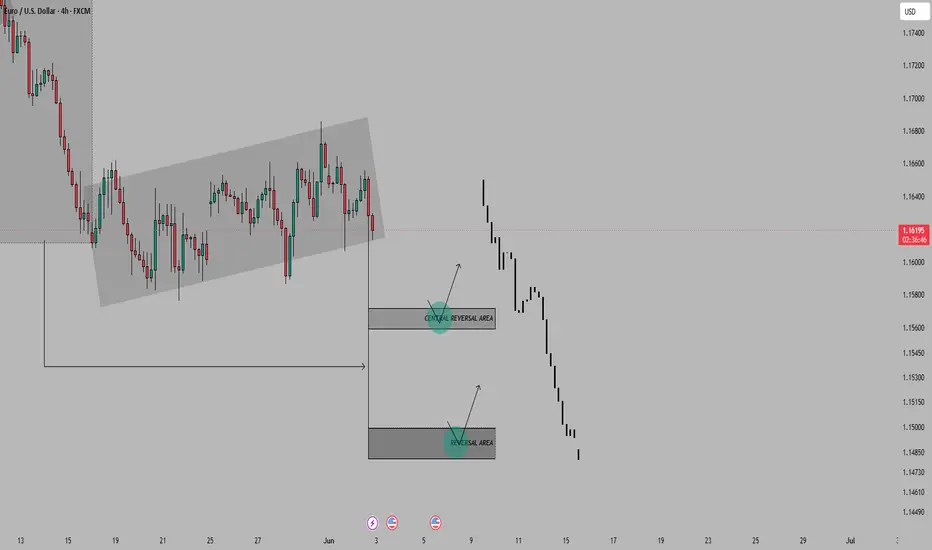
EURUSD Trend Reversal Building From Key Demand ZoneEURUSD is showing early signs of a bullish recovery after an extended bearish move from the rising channel breakdown. Price is currently reacting from a strong demand zone around 1.1600, where buying pressure has started to slow down bearish momentum. The descending trendline remains the key barrier, and a confirmed breakout above it could shift short-term market structure back to bullish.
Higher lows forming near support indicate growing buyer strength, while the recent consolidation suggests
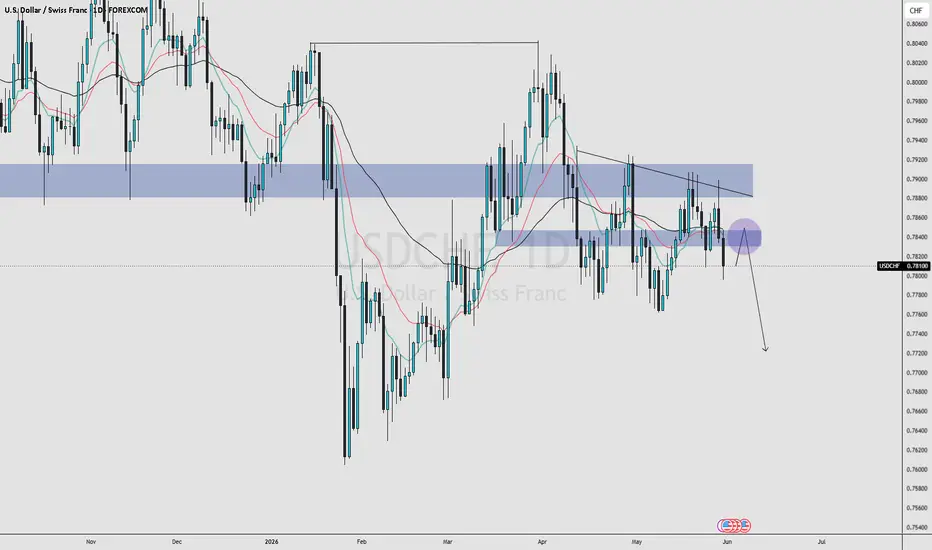
USDCHF CONTINUATION SETUPIn USDCHF, I’m currently looking for possible short opportunities. On the daily timeframe, price is closing below a strong multi-rejection zone, which suggests weakening bullish momentum and possible continuation towards the downside.
From the weekly perspective, the last weekly candle closed bearish, adding further confirmation to the bearish higher timeframe bias. In addition to that, price is trading below the 50 EMA as well as the 10–20 EMA cluster on the weekly timeframe, which strengthens
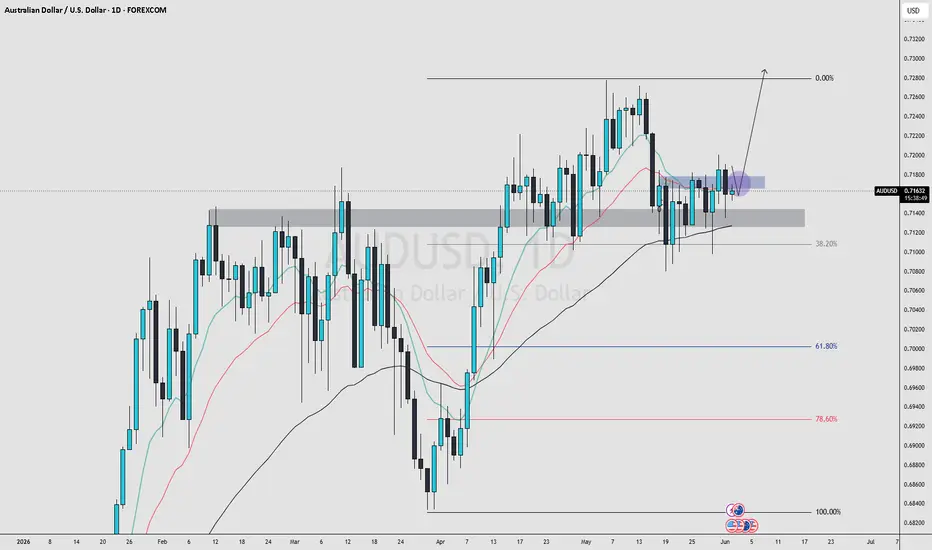
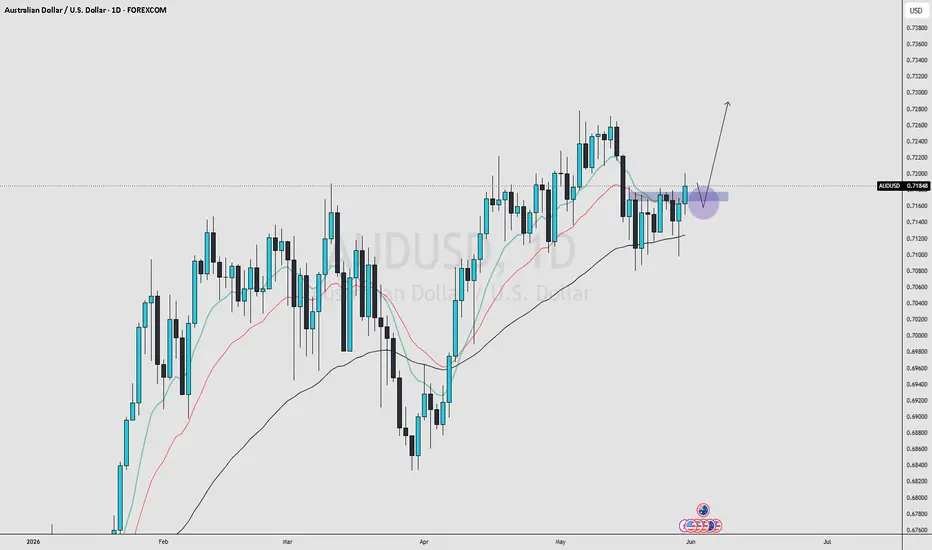
AUDUSD CONTINUATION SETUPIn AUDUSD, price is currently trading in a continuation setup around the 10–20 EMA zone. Price remains above the 50 EMA, and at the same time, it is also holding above the 10–20 EMA, which keeps the overall structure bullish.
However, the main concern right now is that the 10–20 EMA is still tightly compressed and not showing strong bullish separation yet, which means momentum confirmation is still somewhat lacking. Despite that, the latest daily candle managed to close strongly above the EMA z
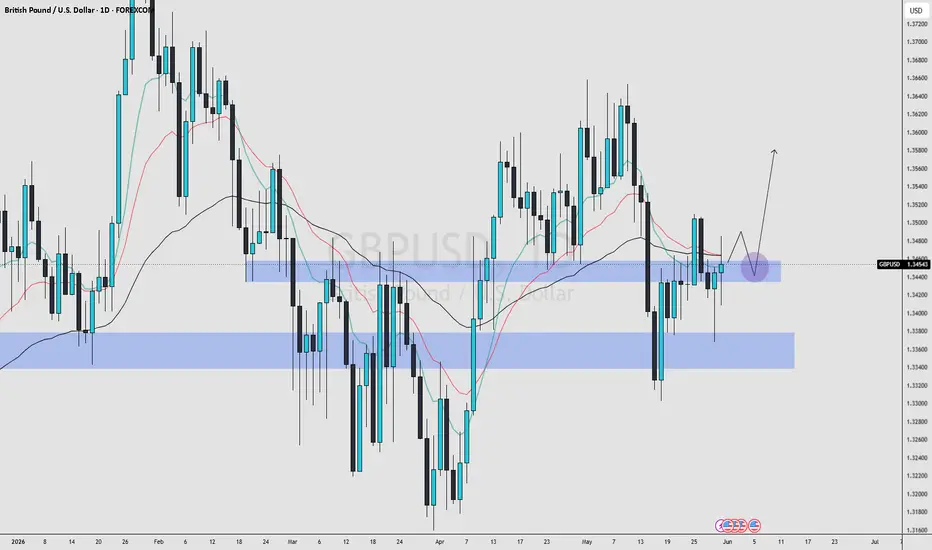
GBPUSD REVERSAL SETUPOn the weekly timeframe, the last two candles closed consecutively bullish, and price is currently bouncing above the 50 EMA. At the same time, the latest weekly candle managed to close slightly above the 10–20 EMA zone, and price is now attempting to break and sustain above it. Overall, this is giving a bullish indication from the higher timeframe perspective and suggests a possible continuation towards the upside.
Looking at the daily timeframe, price is still trading below the 10–20 EMA. How