Forex market
GBP/JPY Undergoes Heavy Selling PressureGBP/JPY experienced selling pressure after rising to the 211.22 area, but has now retreated back to the 210.50s. Prices are currently stuck near a three-week low as markets digest stagnant UK GDP data and slowing inflation in Tokyo.
✅ UK: Stagnant GDP & BoE's Stagflation Dilemma
Latest economic data failed to provide any strength for the Pound Sterling:
- ⚡GDP Confirmation: The UK economy grew only 0.1% in the last quarter of 2025. Although business investment was slightly better than expected (-2.5% vs. -2.7%), this figure still indicates a worrying contraction in capital.
- ⚡Interest Rate Risk: The BoE's hawkish signal regarding a potential interest rate hike in April 2026 was met with negative market responses. Investors are concerned that an interest rate hike amidst the energy price shocks caused by the Iran war will accelerate the recession (stagflation).
- ⚡Energy Vulnerability: As an economy heavily reliant on energy imports, the UK remains one of the most vulnerable to a blockade of the Strait of Hormuz.
-------------------------------------------------------------------------
✅ Japan: Tokyo Inflation Slows & Intervention Speculation
On the other hand, the Japanese Yen (JPY) faces a strong sentimental tug-of-war:
- ⚡Low Tokyo Inflation: Tokyo's CPI slowed to 1.4% in March (the lowest level since 2022). This data dampens market expectations for imminent policy tightening by the Bank of Japan (BoJ), which theoretically weakens the JPY.
- ⚡Safe-Haven Sentiment: Despite low inflation, the JPY continues to draw support from its status as a safe-haven asset and speculation that Japanese authorities will intervene physically if the domestic currency weakens too deeply.
------------------------------------------------------------------------
✅ Key Levels to Watch
- ⚡Intraday Resistance (211.22): Today's high that failed to hold. A break above this area is needed to alleviate short-term selling pressure.
- ⚡Strong Barrier (212.00): A key psychological level that aligns with Tokyo's verbal intervention zone.
- ⚡Nearest Support (210.20 - 210.30): The three-week low reached yesterday.
- ⚡Main Bearish Target (209.50): If the pound continues to weaken due to recession fears, this area could be the next downside target.
GBP/CHF Downward Potential Quite ClearOn the 4-hour timeframe, GBP/CHF is showing clear signs of selling exhaustion.
- ⚡Market Structure: The medium-term trend remains bearish, but the downward momentum is starting to slow. The price is currently firmly anchored in the Major Demand Zone (lower gray box) between 1.05000 and 1.05500.
- ⚡Price Action: A minor double bottom is forming in the demand zone. The appearance of several candles with long lower wicks (wick rejections) at 1.05430 indicates that buyers are starting to accumulate positions to defend the psychological level of 1.05000.
✅ Key Zones:
- ⚡Resistance: 1.06200 (Supply Area / Last Lower High).
- ⚡Support: 1.05000 (Psychological Floor / Major Demand).
In terms of the wave cycle, GBP/CHF appears to be completing the final phase of a long downtrend:
- ⚡Wave Structure: The decline from 1.09000 appears to be completing the Wave 5 structure.
- ⚡Current Status: Since the price is already in an area of very strong demand and the RSI momentum is starting to show bullish divergence (price forming a LL, indicator forming a HL), there is a strong indication that Wave 5 is nearing its end or has reached its peak (ending diagonal).
- ⚡Projection: After Wave 5 is complete, the market will theoretically begin a reversal phase leading to Corrective Wave A with the first upside target towards the 1.07500 area.
The main bias for GBP/CHF is currently neutral, tending towards bullish for the medium term. Although the major trend remains down, selling at 1.05430 is very risky because the downward "room" is very limited and is at the end of the Elliott wave.
GBPJPYGBPJPY is currently in a downtrend and price has tapped a higher time frame supply zone, which makes sell positions valid.
However, the supply zone is relatively large, which results in a lower risk-to-reward ratio if entering directly from it.
For that reason, lower time frame confirmation is needed before taking a position.
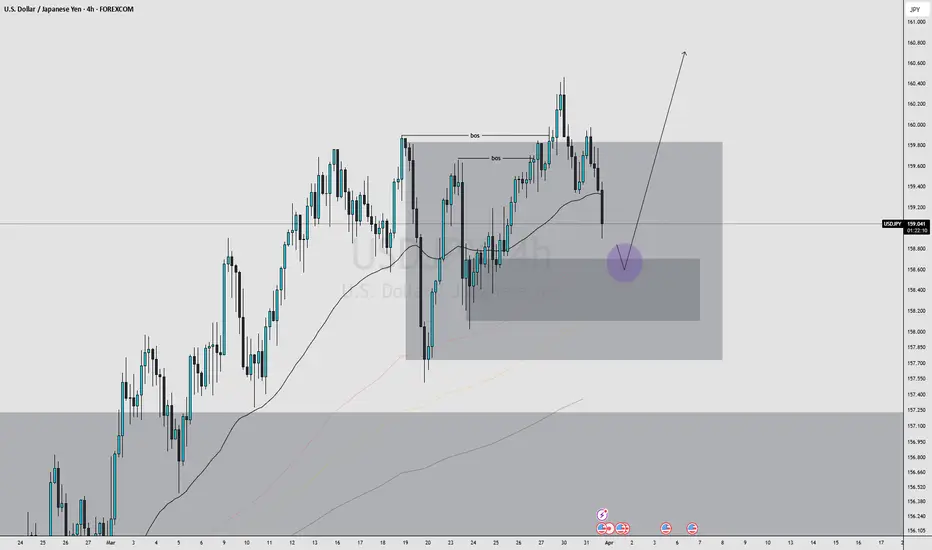
USD/JPY experienced a sudden sell-offUSD/JPY experienced a sudden sell-off after hitting a new high since July 2024 in the 160.30s.
Although the four-day uptrend was halted with a decline to the 159.65 area, the technical structure suggests that this weakening remains corrective as long as key support levels remain unbroken.
✅ Main Catalyst: Real Threat from the BoJ & Japan's Ministry of Finance
Today's sharp decline was triggered by coordinated statements from the Japanese monetary authorities:
- ⚡Verbal Intervention: Comments from BoJ Governor Kazuo Ueda and Vice Finance Minister Atsushi Mimura sent a strong signal that the government was ready to physically intervene in the foreign exchange market to stem the weakening of the yen. This triggered aggressive short-covering (closing of short yen positions).
- ⚡Factors Hedging the JPY: Despite the Yen's technical strength, the escalating conflict in the Middle East (Houthi attacks and the risk of an Iranian invasion) continues to weigh on Japan's economy as an energy importer, limiting the potential for further Yen appreciation.
✅ Key Levels to Watch
- Key Upside Target (160.80): The next target if the price breaks through the 160.30 high zone again.
- Immediate Resistance (160.20 - 160.30): Today's peak area, which serves as a major psychological barrier.
- Intraday Support (159.40): The first support level to be tested if the sell-off continues.
- Correction Limit (159.00): The psychological area before reaching the next crucial support.
EURUSD - 4H - SHORTFOREXCOM:EURUSD
Hello traders , here is the full multi time frame analysis for this pair, let me know in the comment section below if you have any questions, the entry will be taken only if all rules of the strategies will be satisfied. wait for more Smart Money to develop before taking any position . I suggest you keep this pair on your watchlist and see if the rules of your strategy are satisfied...
Keep trading
Hustle hard
Markets can be Unpredictable, research before trading.
Disclaimer: This trade idea is based on Smart money concept and is for informational purposes only. Trading involves risks; seek professional advice before making any financial decisions. Informational only!!!
USDJPY_WUSD/JPY Monthly Elliott Wave Analysis
Based on the Elliott Wave structure on the monthly timeframe, USD/JPY appears to be trading within a major Wave 3. This larger Wave 3 is composed of five internal sub-waves, and price action currently seems to be developing within Sub-wave 5.
In the short term, the pair is expected to continue its bullish movement toward the 161.563 – 162.804 resistance zone.
However, the presence of a regular bearish divergence suggests that once this target area is reached, the market may begin a corrective move, potentially forming the larger Wave 4.
Key Levels
• Bullish target: 161.563 – 162.804
• Possible scenario afterward: Start of Major Wave 4 correction
USD/JPY Fundamental Outlook
From a fundamental perspective, the bullish outlook for USD/JPY is supported by the ongoing divergence in monetary policy between the Federal Reserve and the Bank of Japan.
The Federal Reserve continues to maintain relatively higher interest rates in order to control inflation, which supports the strength of the US Dollar. In contrast, the Bank of Japan has historically maintained an accommodative monetary policy with lower interest rates, keeping the Japanese Yen comparatively weaker.
This interest rate differential encourages capital flows toward USD-denominated assets, providing underlying support for USD/JPY in the medium to long term.
However, market participants should also monitor potential policy adjustments from the Bank of Japan. Any signals of monetary tightening, changes in yield curve control, or unexpected interventions in the currency market could increase volatility and trigger corrective movements in USD/JPY.
Overall, the current macroeconomic environment continues to favor USD strength against the Yen, aligning with the broader bullish structure seen on higher timeframes.
EURUSD – 4H | Institutional Workflow PerspectiveCurrent price is rotating into a well-defined demand zone (~1.1510–1.1500), nested within a broader higher-timeframe support structure. This area previously acted as a displacement origin, suggesting the presence of unmitigated institutional orders.
Narrative:
The market has transitioned from a short-term distribution phase into a corrective pullback. The recent bearish leg appears corrective rather than impulsive, lacking sustained momentum and failing to print decisive lower lows. This reinforces the probability of responsive buying at discount.
Execution Plan:
* Entry: Within the support zone after confirmation (LTF shift / bullish displacement)
* Invalidation: Clean break and acceptance below 1.1490
* Target: 1.1650 resistance (premium liquidity pool)
* R:R: ~4.5
Confluence:
• HTF demand alignment
• Liquidity resting below equal lows (sell-side draw)
• Inefficient price delivery (imbalance) into support
• Mean reversion toward premium pricing
Key Focus:
Patience for confirmation is critical. No anticipation—only participation once orderflow confirms institutional intent.
This is a classic buy-side campaign from discount to premium, assuming the current demand holds.
#EURUSD #Forex #PriceAction #SmartMoney #TradingView #FXTrading
USDCHF_DUSD/CHF Daily Analysis
On the daily timeframe, the pair is showing both regular divergence and hidden bearish divergence, signaling potential downside pressure.
From a structural perspective, a flat pattern and a bat pattern are forming. Based on Elliott Wave theory, the larger Wave A appears to be nearing completion.
We anticipate a bearish move to form Wave 5, with downside targets in the 0.77044 – 0.76479 range.
After this decline, a bullish reversal is expected, initiating the larger Wave C.
Invalidation Level:
If the price breaks above 0.80466, this scenario will be invalidated.
USD/CHF Fundamental Outlook (Daily Perspective)
From a fundamental standpoint, USD/CHF is currently facing mixed but slightly bearish pressure in the short term.
The Swiss Franc (CHF) continues to draw support from its safe-haven status, especially amid ongoing global economic uncertainty and cautious market sentiment. Any increase in risk aversion tends to strengthen CHF, putting downward pressure on the pair.
On the other hand, the US Dollar (USD) remains sensitive to expectations around Federal Reserve policy. While higher interest rates have supported the USD in recent months, markets are increasingly pricing in a potential slowdown in rate hikes or even future easing. This shift is limiting bullish momentum for the dollar.
Additionally, softer economic data or declining inflation expectations in the US could further weaken USD in the near term, aligning with a potential downside move in USD/CHF.
Short-Term Bias:
Fundamentals currently support a corrective downside move, which aligns with the technical expectation of a decline toward the 0.77044 – 0.76479 zone.
Mid-Term Outlook:
Once the downside move is completed, a recovery phase could emerge. This would likely be driven by:
• Stabilization in US economic data
• Renewed strength in the USD if the Fed maintains a relatively hawkish stance
• Possible reduction in safe-haven demand for CHF
This scenario supports a bullish reversal for a larger Wave C after the expected drop.
Risk / Invalidation Factors:
• A stronger-than-expected USD driven by hawkish Fed signals
• A significant improvement in global risk sentiment reducing CHF demand
• A sustained move above 0.80466, which would weaken the bearish outlook
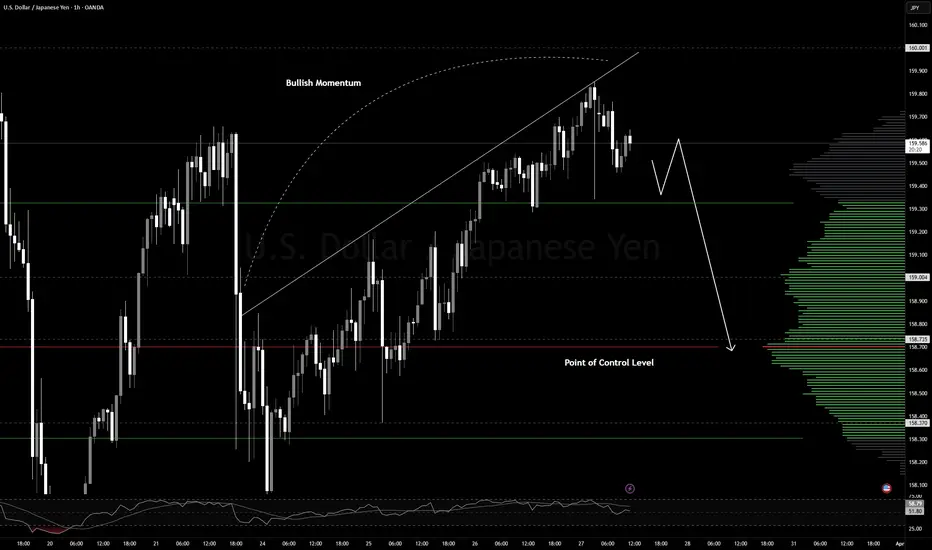
USD/JPY: Stuck in the Red Zone & Japan's Stagflation ThreatUSD/JPY broke its three-day uptrend in today's Asian session, trading around 159.50 (down 0.15%). Although the US dollar experienced a moderate correction, USD/JPY's weakness was restrained by Japan's fragile fundamentals due to the global energy crisis.
✅ Intervention Risk: Psychological Level 160.00
The yen is currently in a highly sensitive area for Japanese monetary authorities:
- Intervention Threshold: The 160.00 level has historically been the reference point for Japan's Ministry of Finance (MoF) to intervene in the market. This threat makes bulls hesitant to push prices higher until further clarity is provided.
- Dollar Correction: The slight decline in the Dollar Index (DXY) gives the yen some breathing room, but this is more of a technical issue than a fundamental trend change.
-----------------------------------------------------------------------------
✅ BoJ Dilemma: The Threat of Classic Stagflation
The conflict in the Middle East is creating a difficult situation for the Bank of Japan (BoJ):
- Trade Balance: As a net energy importer, the surge in oil prices due to the closure of the Strait of Hormuz exacerbates Japan's trade deficit, which naturally weakens the Yen.
- Interest Rate Risk: The BoJ is unlikely to raise interest rates aggressively as the Japanese economy is absorbing an "energy shock." Raising interest rates amidst an economic slowdown risks triggering stagflation, which would limit the JPY's appreciation.
-------------------------------------------------------------------------------
✅ USD/JPY Technical Analysis (Intraday)
The price structure indicates consolidation in the upper range, awaiting a major catalyst for a breakout or reversal.
- ⚡Critical Resistance (160.00): A sustained breakout and close above this psychological level would pave the way for a new target above the July 2024 high.
- ⚡Immediate Support (159.00): The initial support level that sellers must break to confirm the start of a deeper correction.
- ⚡Monthly Trendline (152.25 - 152.30): The uptrend structure that has been in place since February remains intact as long as prices remain well above this area.