NZDUSD: The Rally Faces Its First Real ObstacleEvery strong bullish move eventually reaches a point where it has to prove whether it still has enough strength to continue. For NZDUSD, that moment may have arrived.
Price has climbed steadily from the recent low and is now testing a resistance zone that previously triggered strong selling pressure. So far, buyers have controlled the recovery. The key question is whether they still have enough momentum to break through this barrier.
What interests me most is not the resistance itself, but how price reacts around it.
If buyers fail to establish acceptance above this area and bearish rejection begins to appear, the current advance could simply be a corrective rally within a broader weak structure. In that scenario, a return toward 0.57500 would become increasingly realistic.
A clean breakout and sustained trading above resistance would tell a completely different story. Until that happens, I prefer to respect this selling zone rather than assume it will be broken.
This is only my personal interpretation of the current market structure and should not be considered financial advice. Waiting for confirmation and managing risk remain the most important parts of every trading decision.
Forex market
GBPUSD: The Current Rally Now Has to Prove Its StrengthGBPUSD has reached a point where the current rally needs to prove it still has enough strength to continue. After a strong recovery from lower levels, price has entered a major resistance zone clearly marked on the chart. This is where I become more cautious, because fast rallies often begin to lose momentum when they revisit areas that previously attracted significant selling pressure.
Simply reaching resistance is not a sell signal for me. What matters is how the market reacts. If price pushes slightly higher but then shows clear rejection, smaller bullish candles, or fails to establish acceptance above the resistance zone, it would suggest that buying pressure is fading. In that case, the current rally could turn into nothing more than a short-term distribution phase before sellers regain control.
If that scenario develops, I'll be watching for a correction toward 1.33850. This target becomes much more convincing if price leaves the resistance zone with clear signs of increasing selling pressure. On the other hand, if buyers manage to break decisively above the resistance and hold that level, the bearish outlook would no longer be valid.
This is simply my personal interpretation of the current market structure and should not be considered financial advice. I prefer to wait for market confirmation rather than react too early, and I always make risk management my highest priority.
GBPUSD Retest of the ultimate resistance zone possible ?After taking a bounce form the support zone on 24th June, price is making clear bullish structure and continuing its up-move, It has reached to a significant resistance level of 1.3485 from where breakout is possible, ideal situation would be when price retraces and re-testes its rising trendline and after a consolidation gives a breakout.
Immediate support is at 1.3322 & 1.3509 may act as resistance.
Upon breakout price may retest it's strong long-term supply zone. Only buy trades should be attempted.
summary: Wait for the clean breakout above resistance for fresh entries, if it consolidates for some time before breakout, it would be even better.
For Educational Purposes only, Not an Investment Advice, Always use strict Risk management measures.
Regards CrazyTrades247.
Head And Shoulders - Bearish Continuation Overview
The Head and Shoulders pattern is one of the most recognized bearish reversal formations in technical analysis. In this chart, price has formed a Left Shoulder, a higher Head, and a Right Shoulder before breaking below the neckline. The current structure suggests that sellers have gained momentum, while a possible retest of the neckline could provide additional confirmation if the pattern remains valid.
___________________________________________________________
Definition
A Head and Shoulders pattern is a price formation consisting of three peaks:
Left Shoulder : The first peak followed by a pullback.
Head : A higher peak followed by another decline.
Right Shoulder : A lower peak that fails to exceed the head.
Neckline : A support line connecting the swing lows. A close below this level is commonly viewed as confirmation of the pattern.
___________________________________________________________
Key Points
• Price formed a clear Left Shoulder, Head, and Right Shoulder.
• The neckline acted as an important support level before the breakdown.
• A close below the neckline increases the probability of continued bearish momentum.
• Price may revisit the neckline before deciding its next directional move.
• A sustained move back above the neckline may weaken the current bearish structure.
___________________________________________________________
Chart Explanation
• The Left Shoulder marked the first attempt by buyers before a pullback.
• Buyers pushed price to a new high, creating the Head.
• The Right Shoulder formed with a lower high, indicating reduced buying strength.
• Price then broke below the neckline, suggesting that sellers gained control.
• The illustrated path shows one possible scenario where price retests the neckline before continuing lower. This projection is for educational purposes and is not a prediction of future price movement.
___________________________________________________________
Summary
The current chart displays a completed Head and Shoulders pattern with a neckline breakdown. As long as price remains below the neckline, the bearish structure remains intact. Market participants may watch future price action around the neckline for additional confirmation or signs of invalidation.
___________________________________________________________
Why It Matters
• Recognizing chart patterns can help identify potential trend changes.
• It helps traders understand shifts in market sentiment.
• It highlights important technical levels for planning entries, exits, and risk management.
• Waiting for confirmation may reduce the likelihood of acting on false signals..
___________________________________________________________
Conclusion
This chart highlights a classic Head and Shoulders structure followed by a neckline breakdown. Whether the market continues lower or invalidates the setup will depend on future price action. As with any technical pattern, confirmation and proper risk management are essential before making trading decisions.
___________________________________________________________
Disclaimer
📘 For educational purposes only.
🙅 Not SEBI registered.
❌ Not a buy/sell recommendation.
🧠 Purely a learning resource.
📊 Not Financial Advice
EURJPY LONG Over the past two days, EUR/JPY has shown bullish price action. Although the overall daily trend remains somewhat choppy—as reflected by the moving averages—there is still potential for another push higher and a sweep of the previous day's high, with the next key target around **185.867**.
For today's session, I'll be looking for buying opportunities following a pullback on the 1-hour timeframe. My focus will be on the **38.2%** and **61.8% Fibonacci retracement levels**. Price is currently trading around the **38.2%** level, so I'll wait for a strong bullish rejection or other confirmation before considering a long entry.
If I get the confirmation I'm looking for, I'll start building long positions and target **185.867**.
For now, it's a waiting game. Let's see how the price unfolds, and I'll catch you in the next session.
RE-ENTRY TRADE FOR EURGBPThis is the previous trade i share it's first OB have hit the stoploss, this is the last second entry for it, by again keeping proper risk managment with it, to me this trade is high probability that's why im taking one more time, if you're too, please do it with a very small lot, if you're doing it with my analysis, take care :)
AUDUSD 1H: Reclaiming the Base & Late Seller Trap (Long Setup)1. Market Context
On the 1H chart, AUDUSD has successfully completed a deep liquidity sweep to flush out early retail buyers. After dropping below the local support to hit the absolute low of 0.65138 (marked by "Buyer Lose" and "No Buyer"), the price saw immediate institutional absorption. The market is now rallying and consolidating just below the local descending trendline. A confirmed breakout here will trigger a powerful short squeeze toward the major overhead resistance.
2. Sentiment & Price Trap Analysis
• The Retail Buyer Shakeout (Buyer Lose): The sharp downward manipulation to 0.65138 successfully hunted the stop losses of weak-handed retail buyers who entered long positions too early.
• The Late Seller Trap (No Buyer): As the price broke down looking extremely bearish, momentum retail traders aggressively chased the move by opening short positions near the bottom. However, the lack of follow-through and the quick rejection confirm that selling pressure has completely dried up, leaving these late sellers heavily trapped.
• The Squeeze Catalyst (Break Signal): A decisive 1H candle close above the 0.65811 level (Break Signal) will instantly force these trapped sellers to cover their positions (by buying back). Their combined stop losses (buy stops) along with new buying momentum will act as rocket fuel to push the price toward the major descending trendline and key liquidity pool near 0.67200 (marked "Seller Wait Here").
3. Trade Setup
We target a high-reward long entry on the confirmed breakout of the local trendline to ride the short squeeze momentum.
• Entry Zone: 0.65811 (Buying the confirmed breakout close / Break Signal)
• Stop Loss (SL): 0.65138 (Placed safely below the ultimate manipulation low)
• Take Profit (TP): 0.67200 (Targeting the major overhead descending trendline and key resistance)
• Risk-to-Reward Ratio (R:R): Approx 2.1:1
USDJPY LONGUSDJPY closed with a strong bullish daily candle, and price is currently approaching a significant area of relative buy-side liquidity. The first liquidity pool is around 162.709, followed by another clean buy-side liquidity level near 162.836.
My plan is to wait for the current correction to develop on the 1-hour timeframe. If I see a strong bullish rejection, such as a bullish engulfing candle or a clear intraday market structure shift, I'll begin looking for long opportunities.
The two primary areas of interest for an entry are the **38.2%** and **61.8% Fibonacci retracement levels**. If the price reacts positively from either of these zones with sufficient confirmation, I'll look to enter long and target the buy-side liquidity above.
Overall, the higher-timeframe bias remains bullish, but I'll only execute the trade if the lower-timeframe price action provides the confirmation I'm looking for. Let's see how the market unfolds.
AUDUSD LONG Although the price action on AUD/USD isn't particularly clear, the pair is still trading above the 50 EMA on the weekly timeframe. Over the past two weeks, we've also seen strong bullish rejections, suggesting that buyers are still defending lower prices.
The 10 EMA and 20 EMA are converging, which indicates slowing momentum, but there's still a reasonable possibility that price could break above the previous week's high.
PDH is cleared.
On the 4-hour timeframe, after the recent rejection, I can identify a good Fibonacci setup. Price has closed above the 61.8% retracement of the last bullish impulse, which adds confluence for a potential long position.
My plan is to look for a long entry and target the previous week's high, with the possibility of extending the target slightly beyond it if momentum continues.
That said, this isn't a perfect setup. There is still a chance that price could break below the previous week's low. Additionally, the 4-hour break of structure isn't very convincing since it was only a wick break rather than a candle close above the level.
Overall, this isn't an A+ setup, but it's a valid trade idea with enough confluence to keep on my watchlist.
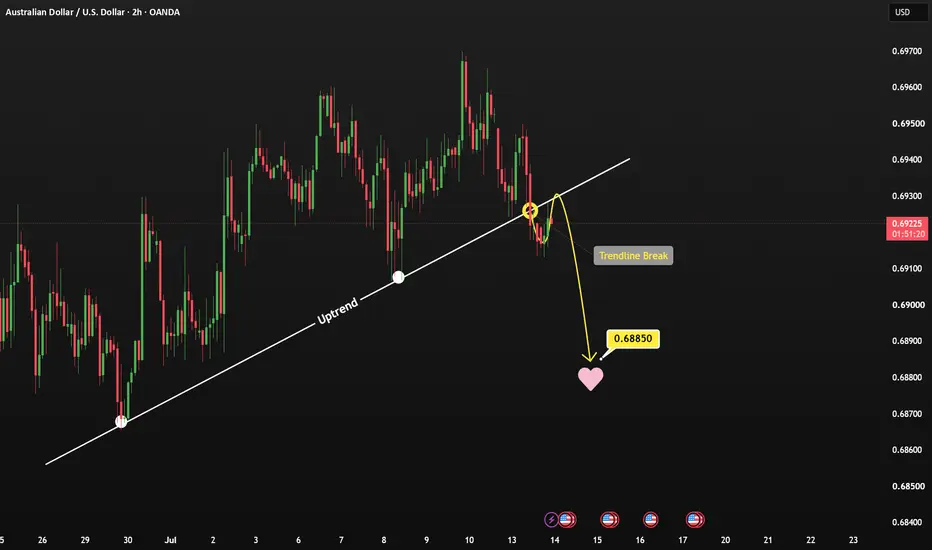
AUDUSD: From Uptrend to Breakdown → 0.68850?AUDUSD has maintained a fairly steady uptrend recently, respecting an ascending trendline throughout the move. However, the structure has started to shift after price broke below that trendline. A break of a well-tested trendline like this is often the first sign that bullish momentum is fading and sellers are beginning to regain control.
I’ll be watching for a pullback toward the broken trendline before considering any short setup. Ideally, I want to see a clear rejection or a strong confirmation candle around the retest area, as that would increase the probability of a bearish continuation. If that scenario plays out, my target will be 0.68850, in line with the current breakout direction.
This is simply my personal view based on the current price structure, not financial advice. I’ll still wait for confirmation before taking any position and always prioritize proper risk management.
EURUSD TRADEEBased LQ, MS And PROPER RISKMANAGEMENT, it's a trade of 1;4 rr, so please take it wisely and my strategy have a wining probability of 40-50% so that's why i highly recommend if you're taking this trade based on this analysis, take a smaller lot or test my analysis first before putting real trades, thank you and take care :)
EUR/USD Short: Trendline Breakout and Resistance RejectionThis trade setup captures a bearish reversal on the EUR/USD 4-hour chart. After a significant downward impulsive move, the price entered a consolidation phase, forming a series of lower highs against a clear ascending trendline.
The setup is triggered by a decisive break below the yellow diagonal support line, following a failed attempt to rally back into the overhead supply zone (the shaded grey area near 1.1480).
GBPUSD Long Setup: H1 Order BlockTechnical Breakdown
Market Structure Shift (BOS & MSS): Earlier in the price action, we witnessed a clear Break of Structure (BOS) to the upside. Following a deeper corrective leg, price forged a Market Structure Shift (MSS) by clearing local swing highs, confirming a structural shift from bearish/corrective to an aggressive bullish expansion.
Confluence Zone (H1-OB): Price is currently mitigating the H1 Order Block (H1-OB) situated around the 1.3395 - 1.3402 area. This demand zone is heavily fortified by a strong, multi-touch ascending Trendline acting as a dynamic support anchor.
Liquidity and SMC: Retail trendline liquidity looks to be perfectly swept or respected right into the institutional footprint (H1-OB), creating the ideal launchpad for the next leg up.
Trading Plan
Entry Zone: 1.33950 - 1.34020 (Current market price retesting the H1-OB)
Stop Loss (SL): Below the H1-OB and invalidation of the ascending trendline (around 1.33850).
Take Profit (TP / Target): 1.34350 - 1.34400 (Targeting the recent swing high/equal highs liquidity).
⚠️ Risk Disclaimer: Always practice proper risk management. Wait for lower timeframe confirmation (like an M1/M5 MSS) within the H1-OB if you prefer an extra layer of confirmation before executing.
USDCAD – Demand Zone Sparks Bullish ReversalUSDCAD continues to respect a descending channel after completing a strong Wave (3) advance, suggesting the current move is a Wave (4) correction. The currency has tested the lower boundary of the channel near 1.4118, where buyers are attempting to defend support.
Wave (4) occurred near the previous wave 4 of the smaller degree, which validates the possibility of a reversal. Bulls have the potential to push the price up to 127.2 % at 1.4284 (Rev. Fib).
I will update soon.
By @BrightRally_Research
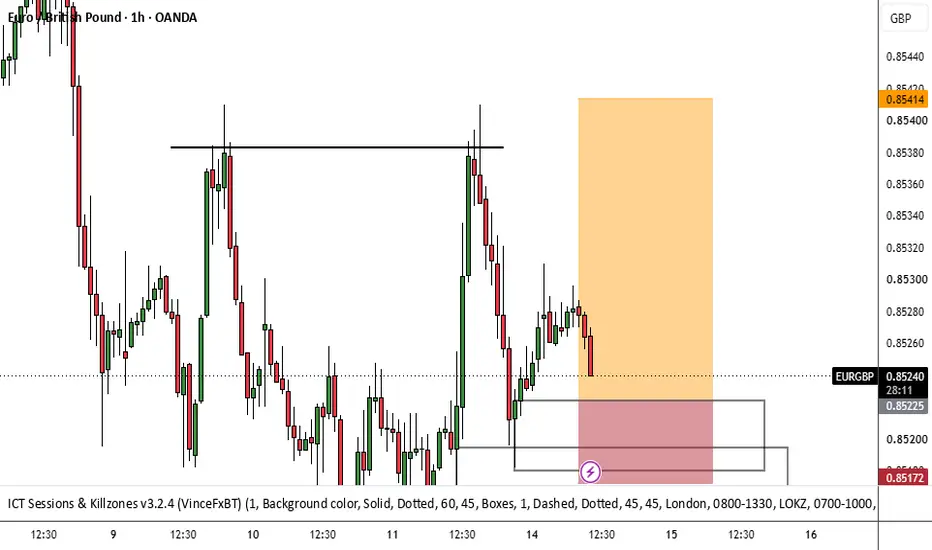
EURGBP trade Idea, sell on rise!📊 TRADE SETUP
Instrument: EURGBP
Direction: SELL
Entry: 0.85239
Stop Loss: 0.85439
Take Profit: 0.85039
Risk: 20 Pips
Reward: 20 Pips
Risk:Reward = 1:1
Nano Lot → 0.001 Lot → 100 Units → +£0.20 (20 Pip Target) → -£0.20 (20 Pip SL)
Micro Lot → 0.01 Lot → 1,000 Units → +£2.00 (20 Pip Target) → -£2.00 (20 Pip SL)
Mini Lot → 0.10 Lot → 10,000 Units → +£20.00 (20 Pip Target) → -£20.00 (20 Pip SL)
Standard Lot → 1.00 Lot → 100,000 Units → +£200.00 (20 Pip Target) → -£200.00 (20 Pip SL)
For Educational Purposes only, Not an Investment Advice, Always use strict Risk management measures.
Regards CrazyTrades247.
NZDUSD trade Idea, buy on dips!📊 TRADE SETUP
Instrument: NZDUSD
Direction: BUY
Entry: 0.57573
Stop Loss: 0.57373
Take Profit: 0.57773
Risk: 20 Pips
Reward: 20 Pips
Risk:Reward = 1:1
Nano Lot → 0.001 Lot → 100 Units → +$0.20 (20 Pip Target) → -$0.20 (20 Pip SL)
Micro Lot → 0.01 Lot → 1,000 Units → +$2.00 (20 Pip Target) → -$2.00 (20 Pip SL)
Mini Lot → 0.10 Lot → 10,000 Units → +$20.00 (20 Pip Target) → -$20.00 (20 Pip SL)
Standard Lot → 1.00 Lot → 100,000 Units → +$200.00 (20 Pip Target) → -$200.00 (20 Pip SL)
For Educational Purposes only, Not an Investment Advice, Always use strict Risk management measures.
Regards CrazyTrades247.
NZDCAD trade Idea, buy on dips!📊 TRADE SETUP
Instrument: NZDCAD
Direction: BUY
Entry: 0.81498
Stop Loss: 0.81298
Take Profit: 0.81698
Risk: 20 Pips
Reward: 20 Pips
Risk:Reward = 1:1
Nano Lot → 0.001 Lot → 100 Units → +C$0.20 (20 Pip Target) → -C$0.20 (20 Pip SL)
Micro Lot → 0.01 Lot → 1,000 Units → +C$2.00 (20 Pip Target) → -C$2.00 (20 Pip SL)
Mini Lot → 0.10 Lot → 10,000 Units → +C$20.00 (20 Pip Target) → -C$20.00 (20 Pip SL)
Standard Lot → 1.00 Lot → 100,000 Units → +C$200.00 (20 Pip Target) → -C$200.00 (20 Pip SL)
For Educational Purposes only, Not an Investment Advice, Always use strict Risk management measures.
Regards CrazyTrades247.