Forex market
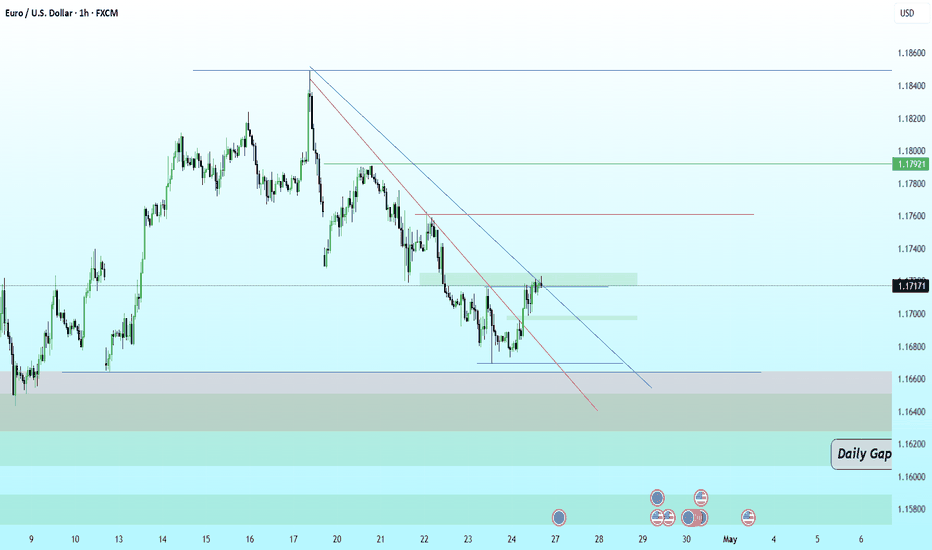
EURUSD – Short Trade Idea📍 Setup: Liquidity sweep + premium zone rejection
📉 Bias: Short (Sell)
🔽 Entry: 1.16835
🔼 Stop-Loss: 32 pips
🎯 Take-Profit: 64 pips (RR 1:2)
📊 Trade Idea Explanation
Price has pushed into a major premium zone aligning with a descending trendline and a previous structural supply block.
The move upward also swept liquidity above recent highs, indicating potential exhaustion and a likely reversal.
Key confluences:
✦ Price tapped into a fresh H1 supply zone
✦ Aligned with trendline resistance
✦ Imbalance above got filled and rejected
✦ Liquidity grab suggests sellers could take control
✦ RR ratio is clean & symmetric (1:2)
🔔 Execution Plan
Enter short at 1.16835 once rejection is confirmed
SL above liquidity sweep zone (32 pips protection)
TP toward the next H1 demand + mid-range EQ, giving ~64 pips
Disclaimer: For educational purpose.
EURAUD at Resistance — Breakout or Bull Trap?EURAUD has delivered a strong bullish impulse after breaking above the 1.64 zone, but the move is now running directly into a confluence of resistance — a descending trendline and a previous supply zone near 1.65–1.66.
While momentum looks strong with RSI nearing overbought levels, this is exactly where late buyers tend to enter and smart money begins to offload positions. The structure still reflects a broader downtrend, and this rally could be a liquidity-driven push rather than a confirmed reversal.
A clean breakout and sustained move above this resistance would shift the structure in favor of buyers, opening upside towards 1.67–1.69. However, rejection from this zone would confirm a classic bull trap and likely lead to a pullback towards the 1.64 support.
EURCAD at Key Flip Zone — Breakout or Bull Trap?EURCAD has broken above a critical resistance zone near 1.59 and is now retesting it as support, forming a classic break-and-retest structure. The recent impulsive move indicates strong intent, but the follow-up price action remains cautious, suggesting this is a decision phase rather than a confirmed breakout.
Momentum is gradually shifting in favor of buyers with RSI showing underlying strength through higher lows. However, this zone is critical holding above 1.585–1.59 is necessary to sustain bullish continuation towards the 1.60–1.615 supply area.
Failure to hold this level could quickly turn this into a bull trap, trapping breakout buyers and shifting control back to sellers.
EUR/USD Under Strong Bearish PressureThe EUR/USD pair weakened 0.3% to 1.1535 during today's European session. The strengthening of the US dollar, driven by its safe-haven status due to the extreme escalation in the Middle East, was a major burden on the euro, which was also pressured by the threat of stagflation in the Eurozone.
✅ US Dollar (USD): Dominating the Psychological Level of the DXY 100
The Dollar Index (DXY) jumped 0.35%, approaching the critical level of 99.90. This strengthening was triggered by two main factors:
- ⚡48-Hour Ultimatum: President Donald Trump's threat via Truth Social to destroy Tehran's energy infrastructure if the Strait of Hormuz is not opened has triggered a massive capital flight to safe assets (USD).
- ⚡Iran's Response: Iran's promise to close the Strait of Hormuz indefinitely increases the risk of a permanent disruption to global energy supplies, which has historically benefited the greenback.
--------------------------------------------------------------------------------------------
✅ Euro (EUR): Threat of Declining Purchasing Power
Despite tightening signals from the ECB, the euro continues to struggle to recover:
- ⚡Cost of Living Crisis: The surge in energy prices due to the Iran conflict is predicted to hit household purchasing power in Europe drastically, increasing the risk of an economic slowdown.
- ⚡Goldman Sachs Projection: Although the ECB kept interest rates steady last week, Goldman Sachs now predicts rate hikes in April and June 2026 to combat energy inflation. However, the current risk-off sentiment is much stronger than the support from the interest rate spread.
----------------------------------------------------------------------------------------------
✅ Key Levels to Watch
Immediate Resistance (1.1550): The intraday ceiling. The euro needs to reclaim this level to stabilize the decline.
- ⚡Strong Barrier (1.1580 - 1.1600): The area that must be broken to invalidate the daily bearish bias.
- ⚡Key Bearish Target (1.1475 - 1.1450): If Trump's 48-hour ultimatum approaches its deadline without a diplomatic solution, this level becomes the next downside target.
- ⚡DXY Psychology (100.00): If the Dollar Index breaks through this round number, EUR/USD risks a free fall towards 1.1400.
GBPCHF Multi Time-Frame Analysis Hello traders , here is the full multi time frame analysis for this pair, let me know in the comment section below if you have any questions , the entry will be taken only if all rules of the strategies will be satisfied. wait for more price action to develop before taking any position. I suggest you keep this pair on your watchlist and see if the rules of your strategy are satisfied.
Dollar strengthening is now good newsEURUSD 1.1571
Intermarket Relationship
Strengthening dollar is not good news for Equity and commodities. Here we see the pair is preparing to correct, meaning strength in the dollar. In my view it will easily come down to 1.12 which is the 61.8% fib as well as role reversal zone also supported by the slowest MA.
GBPUSD Analysis on (20 MAR 2026)#GBPUSD UPDATEDE
Current price - 1.33200
If price stay above 1.32600 then next target 1.33800,1.34200 and 1.34600 and below that 1.31500
Plan1;If price break 1.33200-1.33000 area,and stay above 1.33200 we will placed buy order in GBPUSD with target of 1.33800,1.34200 and 1.34600 & stop loss should be placed at 1.32600
Gold Trading Strategy📊International gold rebounded higher today, mainly driven by the pullback in the U.S. Dollar Index, declining U.S. Treasury yields, oversold technical correction, short covering。
💰A weaker U.S. dollar directly reduced the valuation cost of gold, triggering a pricing correction.
❗️After programmed stop-loss orders were triggered intensively below key support levels, selling pressure eased temporarily, pushing prices higher.
📌Ongoing tensions in the Middle East boosted safe-haven flows back into gold, providing upward momentum.
🏆Today's Gold Trading Strategy
❗️Key Support Zone: 4600 – 4620
❗️Key Resistance Zone: 4700 – 4720
🎯Trading Plan:
🟢Entry Range: 4615 – 4645
🟢Take Profit Range: 4670 – 4720
🔴Stop Loss Level: 4590
🏆If prices effectively break below 4600, stay on the sidelines. Do not chase trades blindly; wait for stable confirmation signals before taking action.
⚠️Fundamentals & Market Sentiment
📌Fundamentals: Gold ETF selling slowed temporarily, while speculative bulls covered positions at low levels, driving prices higher.
📌Market Sentiment: Panic eased, put options were closed, and bullish sentiment staged a partial recovery.
Flag Pole and Pennant - Bullish ContinuationOverview
This chart shows a classic Bullish Pennant pattern forming after a strong impulsive upward move.
• The sharp vertical rise represents the Flag Pole, showing strong buying momentum.
• After this move, price enters a small triangular consolidation, forming the Pennant.
• This consolidation reflects a temporary pause where the market absorbs the previous rally.
⸻⸻⸻⸻⸻⸻⸻⸻⸻⸻
📊 Chart Highlights
• Strong bullish flag pole before consolidation.
• Pennant structure showing tightening price range.
• Price consolidation near the upper zone of the move.
• Breakout zone marked above pennant resistance.
• Pattern supports continuation of the prior uptrend.
⸻⸻⸻⸻⸻⸻⸻⸻⸻⸻
📉 Key Price Action
• The flag pole confirms strong bullish momentum.
• The pennant indicates short-term consolidation after the sharp rise.
• Price is compressing within converging trendlines.
• A breakout above the pennant may confirm bullish continuation.
• Sustained movement above the breakout zone can open the path for further upside.
⸻⸻⸻⸻⸻⸻⸻⸻⸻⸻
📌 Summary
This setup reflects bullish continuation behavior, where a strong rally is followed by consolidation before the next potential move higher. A clean breakout above the pennant would strengthen the bullish case.
⸻⸻⸻⸻⸻⸻⸻⸻⸻⸻
⚠️ Disclaimer
📘 For educational purposes only.
🙅 Not SEBI registered.
❌ Not a buy/sell recommendation.
🧠 Purely a learning resource.
📊 Not Financial Advice
⸻⸻⸻⸻⸻⸻⸻⸻⸻⸻
NZDCHF Analysis on (19 MAR 2026)#NZDCHF UPDATEDE
Current price - 0.46200
If price stay above 0.45800 then next target 0.46700,0.47200 and below that 0.45100
Plan1;If price break 0.46100-0.46200 area,and stay above 0.46200 we will placed buy order in NZDCHF with target of 0.46700,0.47200 & stop loss should be placed at 0.45800
USD/CHF – 30M | Short Setup – Rejection at SupplyTrade Idea (Bearish Continuation Short):
Entry: Around current levels (~0.7925–0.7940) or better on retest of the broken level (~0.7949 dashed line) as resistance.
Stop Loss (SL): Above the red supply zone → ideally 0.7990–0.8000 (just above the red box high) to account for any fakeout wick.
Take Profit (TP): Primary at lower edge of green demand → ~0.7921 / 0.7910.
Extended / full TP at deeper green area → 0.7855–0.7850 .
Partial profits recommended: 50% at 0.7895, rest at 0.7860 for better R:R.
#USDCHF #ForexTrading #ShortSetup #TechnicalAnalysis #SwissFranc
CADJPY Sell Setup – Liquidity Sweep + Descending Channel RejectiTrade Type: Short
Entry: 115.271
Stop-Loss: 26 pips
Take-Profit: 72 pips
🧠 Trade Idea Explanation
Price on CADJPY (1H) is moving inside a clear descending channel, consistently making lower highs and lower lows. After a strong impulsive drop, price tapped into a discount zone and showed a liquidity sweep beneath a minor support area.
Why This Sell Setup Makes Sense?
✔ Descending Structure: The pair is respecting the channel, rejecting the trendline perfectly.
✔ Liquidity Grab: Price wicked below previous lows, taking out stop-losses, showing exhaustion.
✔ Premium-to-Discount Move: Market fell straight from the premium zone and is now continuing the bearish leg.
✔ Weak Pullback: The minor bullish reaction failed to break structure → sellers still in control.
📌 Entry Logic
Entering at 115.271 aligns with the rejection zone after the liquidity sweep and confirms sellers stepping back in.
📉 Stop-Loss (26 pips)
Placed safely above the internal structure & small bullish reaction zone to avoid noise while maintaining tight risk.
🎯 Take-Profit (72 pips)
Targets the next liquidity pool & measured move inside the descending channel — offering 1:2.75 RR, ideal for trend continuation.
📊 Summary
Bias: Bearish
Reason: Liquidity sweep + channel rejection + bearish momentum
RR: ~1:2.75 (high-quality setup)
Expectation: Continuation to downside toward next discount zone