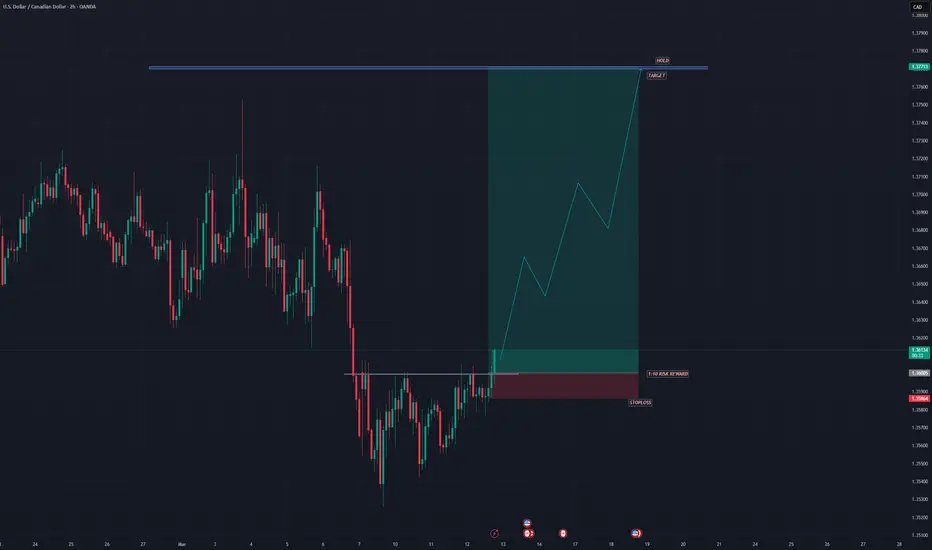
USDCAD SHOWING A GOOD UP MOVE WITH 1:10 RISK REWARDUSDCAD SHOWING A GOOD UP MOVE WITH 1:10 RISK REWARD
DUE TO THESE REASON
A. its following a rectangle pattern that stocked the market
which preventing the market to move any one direction now it trying to break the strong resistant lable
B. after the break of this rectangle it will boost the market potential for break
C. also its resisting from a strong neckline the neckline also got weeker ald the price is ready to break in the outer region
all of these reason are indicating the same thing its
Forex market
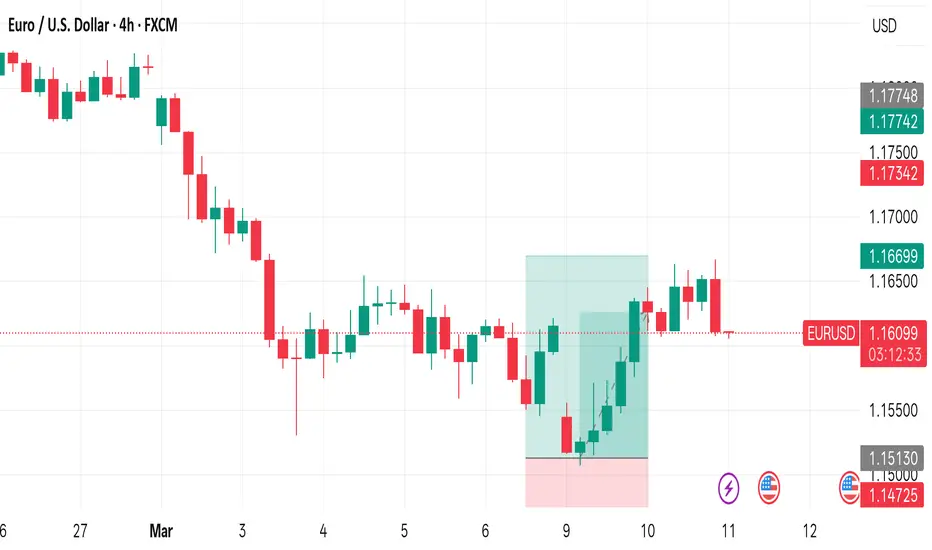
EURUSD – Oversold Reversal Long Setup📌 Trade Details
🟢 Entry: 1.14538
🔻 Stop-loss: 30 pips
🎯 Take-profit: 65 pips
🔹 Trade Idea: Bullish Reversal from Demand Zone
EURUSD has tapped into a major HTF demand zone, showing signs of exhaustion in the bearish move after an extended sell-off. Price is rejecting the lower liquidity pocket and forming a potential bounce structure. With sellers losing momentum around 1.1450, this area offers a favorable long setup with an excellent R:R.
🧠 Trade Logic
Price swept liquidity below previous low
MTFA flow when HTF is bearish out-range Here’s my multi-timeframe flowchart for handling scenarios where the higher time frame (HTF) is in a bearish out-range condition — essentially an impulsive phase. The first question I ask is: is there any nearby sell-side liquidity, either internal range liquidity or external range liquidity? If yes, it qualifies as an A+ setup. If not, it’s simply a B-grade setup.
NO SOUND — Bullish-in-Range Multi-Timeframe Analysis FlowchartThis video shows the flowchart I created for finding lower-timeframe trade setups when the HTF is bullish but in a range.
There is no sound because I was listening to music on my headphones while recording the process.
In the video, I walk through the structure of the decision flow I use to filter setups and identify potential entries on the lower timeframes when the higher timeframe context is bullish-in-range.
Later this weekend, I will upload another video explaining the flowchart in detail
EURNZD MULTI TIME FRAME ANALYSISHello traders , here is the full multi time frame analysis for this stock , let me know in the comment section below if you have any questions , the position will be taken only if all rules of the strategies will be satisfied. wait for more price action to develop before taking any position. I suggest you keep this pair on your watchlist and see if the rules of your strategy are satisfied.
🧠💡 Share your unique analysis, thoughts, and ideas in the comments section below. I'm excited to hear your
Bullish Ascending Channel Overview [ /b]
The chart shows a bullish ascending channel where price continues to trend upward while respecting two parallel rising trendlines. This structure indicates sustained buying pressure with controlled pullbacks.
⸻⸻⸻⸻⸻⸻⸻⸻⸻⸻⸻
Concept
An ascending channel forms when price creates a sequence of Higher Highs (HH) and Higher Lows (HL) within two upward sloping parallel trendlines. The lower boundary acts as dynamic support while the upper boundary acts as dynamic resistance.
⸻⸻⸻⸻⸻⸻⸻
GBPUSD Analysis
The primary trend seems to be bearish and trending within a descending channel formation.
Although on a 4H chart, the prices witnessed moderate strength, and tested the upper trendline
Currently, with minor correction, it is testing a confluence of support including 1) the Bullish FVG; & 2) the golden fib ratio of 0.618.
A hidden bullish divergence could also be identified, signaling prices might reverse from the current to retest channel's upper trendline or higher.
The volumes are also decl
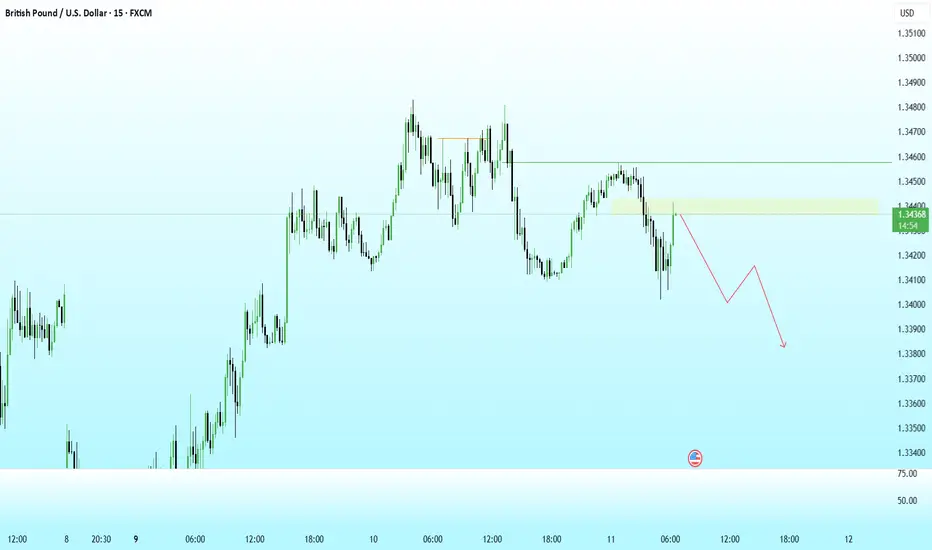
GBPUSD-M15Price is retracing into a supply zone after a strong bullish expansion, showing signs of exhaustion near previous resistance. The current move looks like a pullback into liquidity, where sellers may step in.
A rejection from this zone could trigger a lower high formation, shifting short-term momentum to the downside. If the supply holds, price is expected to continue with a bearish leg targeting the 1.3400–1.3380 liquidity area.
Plan:
Short on confirmation within the highlighted supply zone, t
GBPUSD M15Price delivered a strong bullish expansion and tapped into a higher-timeframe M15 bearish Order Block around 1.3400. After reaching this supply zone, the market started showing rejection and loss of bullish momentum.
The marked zone represents the last bullish candle before the impulsive bearish move, making it a potential institutional supply area.
The idea here is to look for short continuation from this OB, targeting the liquidity resting below.
Forex " pairs in play " session 39 11.03.26Today is a heavy USD news day with CPI scheduled later in the evening (IST). I'm currently holding positions across multiple USD pairs, with a relative strength idea playing out between CAD, CHF, USD, and JPY. Some positions are already running in profit while others are newly added based on higher-timeframe rejection and structure.
Also keeping an eye on GBPUSD for a potential pullback opportunity after a strong breakout. If price corrects into the right area, it could offer a clean continuati
Daily gold update xauusd *🟡 XAUUSD (Gold) – TODAY UPDATE 🟡 ⏰*
*Validity: 11-03-26*
*🔹 Bullish Scenario (BUY)*
*• Trend Confirmation: Above 5251*
*• Targets: 5300– 5366*
*🔻 Bearish Scenario (SELL)*
*• Trend Confirmation: Below 5110*
*• Targets: 5062 – 5006*
*🔄Key Reversal / Entry Level: 5182*
#GoldTrading #freevipsignal #eurusdsignal #viral #trading #EURUSD #anantmoney goldsignal
Forex Basics Every Beginners Must Know!What is forex?
Forex (Foreign Exchange) is the global market where people buy and sell different currencies to make a profit. It is the largest financial market in the world, where currencies from different countries are traded with each other.
Every Forex trade involves two currencies.
For example: EUR/USD, USD/INR, GBPJPY, USD/ZAR, etc.
But why?
You are buying one currency and paying in the second currency.
In EUR/USD, you are buying EUR and paying with USD. In other words, EUR/USD show
EURUSD Technical Setup: Long Opportunity off Demand ZoneAfter a period of consolidation and a recent swing low, EURUSD has shown strong signs of a trend reversal on the 1-hour timeframe. We have seen a clear shift in market structure with price successfully retesting the recent breakout area, which now acts as a solid demand zone.
Forex " pairs in play " session 38 10.03.26Currently managing a few open positions while keeping risk controlled with breakeven stops. The focus right now is mostly on trade management rather than opening new positions.
I’m also monitoring a few pairs closely — particularly USDJPY, AUDUSD, EURUSD, Gold, and USDCHF — to see if any clean setups develop according to my multi-timeframe framework. Patience is key here; I’d rather wait for proper structure shifts and confirmation instead of forcing trades at low expected value areas.
Let’s s
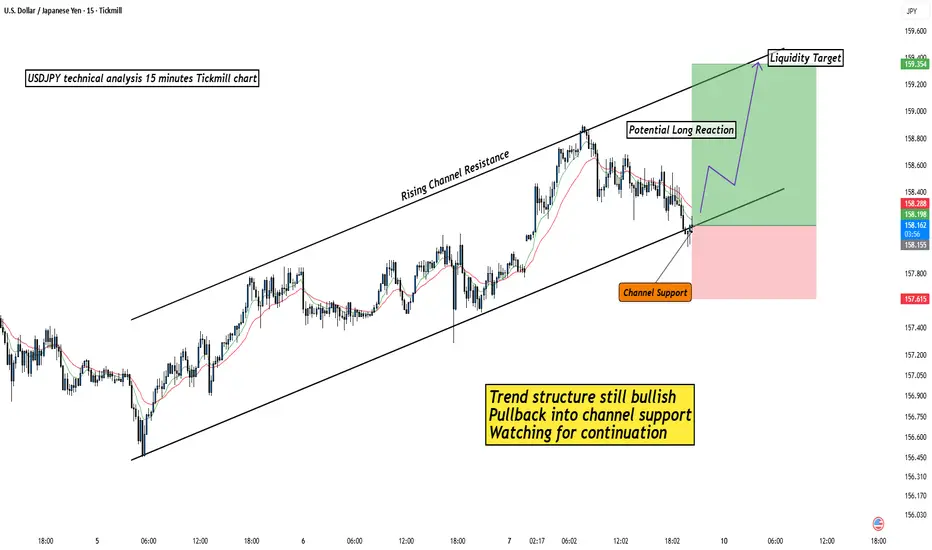
USDJPY Pullback Into Channel Support – Continuation Next?USDJPY continues to trade inside a well-defined rising channel, maintaining a clear bullish structure. After a strong push toward the upper boundary, the market has started to pull back toward the channel support. Moves like this are common within trending markets, where price retraces before attempting the next continuation move.
The key level to watch is the channel support area. If buyers step in and the structure holds, the market could attempt another move toward the upper boundary where
Gold daily update xauusd*🟡 XAUUSD (Gold) – TODAY UPDATE 🟡 ⏰*
*Validity: 10-03-26*
*🔹 Bullish Scenario (BUY)*
*• Trend Confirmation: Above 5225*
*• Targets: 5300– 5400*
*🔻 Bearish Scenario (SELL)*
*• Trend Confirmation: Below 5010*
*• Targets: 4935 – 4850*
*🔄Key Reversal / Entry Level: 5119*
#GoldTrading #freevipsignal #eurusdsignal #viral #trading #EURUSD #anantmoney #goldsignal
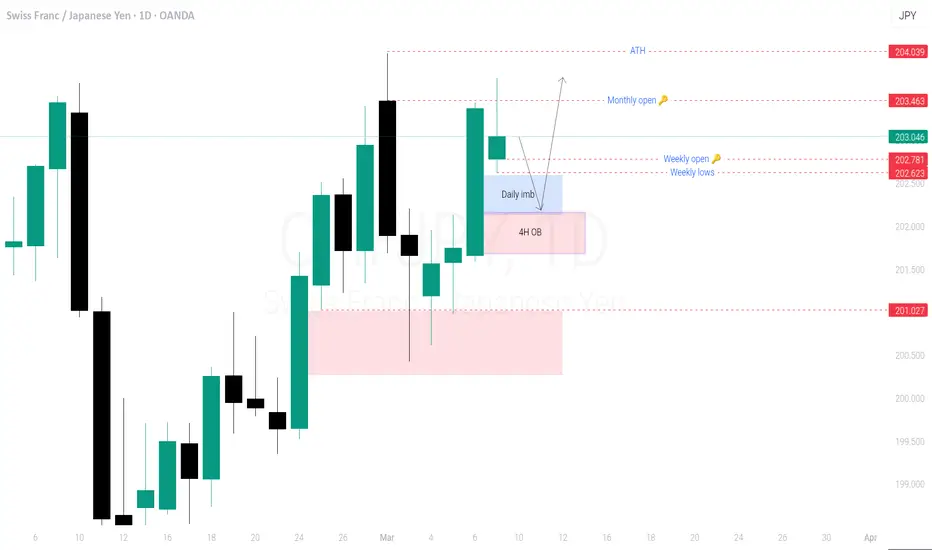
Chfjpy expecting Buyside delivery Setup will be only valid if the next day (daily new candle ) fills this daily imbalance, after it fills ,we can expect bullish pullback till above monthly open .
Following reasons to trust this setup
*Price coming from 201.027 ' it reacted from that daily imb ,which promotes an indication to take liquidity above
*ChF is fundamentally stronger(Safe heaven currency)
*monthly open is more nearer, it has high possibility to take the opening and flip bullish
*current monthly candle opens and take
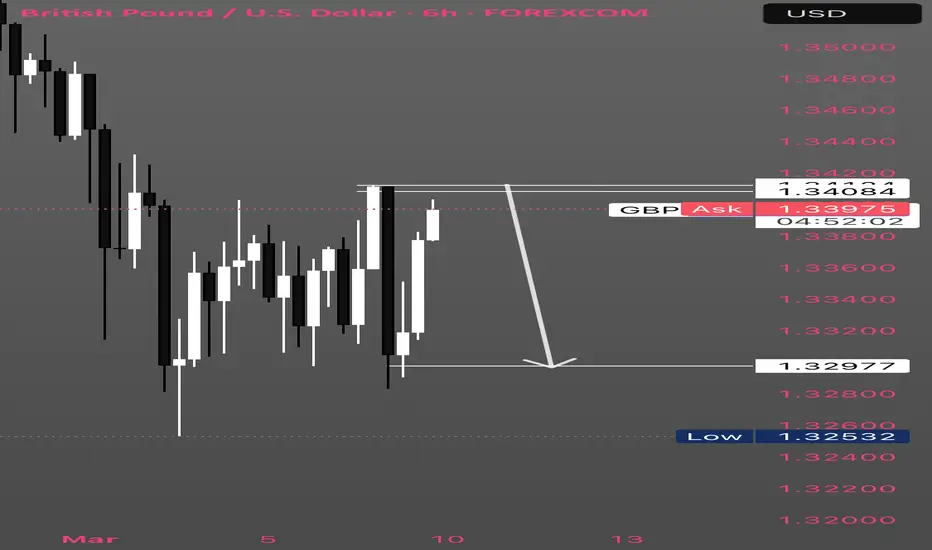
GBP/USD Bearish Momentum: Rejection at 1.3400 → Next Leg Down chart for GBP/USD captures a classic bearish setup unfolding from early March 2026, with price action reflecting a sustained downtrend amid weakening the pound.the pair trades at an ask price of 1.3393, down significantly from the session high near 1.3580 and testing lows around 1.3253. This aligns with broader multi-week bearish structure, where GBP/USD has shed over 3% from February highs, breaking key range lows and an ascending trendline.  The chart visually depicts lower highs and lower l
USDINR - The Final TOP!USDINR - Has been moving between 90 - 92 forming marginally higher highs/ higher lows, in what is called an Ending Diagonal in Elliot Waves.
This should form a medium term top in USDINR and lead to a 4% if not 10% fall.
Reasons:
1. Crude spike cool off
2. Signs of recovery in economy leading to better GDP
These should lead to stocks doing better.
Strengthening currency and improved GDP number + corporate results should attract FII inflows, which should further fuel the stock market.
Too ear
EURUSD Long – Mean Reversion Opportunity📊 Trade Setup
Entry: 1.15179
Stop Loss: 37 pips below entry
Take Profit: 98 pips above entry
Risk-Reward: ~1:2.6
After a sharp sell-off, EURUSD has reached a strong intraday support zone where buyers previously stepped in. The recent liquidity sweep below the lows followed by a strong rejection suggests that the market may be preparing for a mean reversion move back toward the equilibrium area.
Price is currently attempting to reclaim the short-term structure, and if buyers maintain momentu
FX Breakdown: GBPJPY Long ,USDJPY, EURAUD, USDCHF watchlistCurrent market breakdown and trade plan.
• GBPJPY – Long position targeting 220.385 after rejection from a key daily flip level.
• USDJPY – Bullish monthly impulse structure, expecting continuation above highs.
• EURAUD – Monitoring for potential short if 4H bearish confirmation appears.
• USDCHF – Watching for a 4H bearish close to enter shorts targeting previous lows.
• GBPUSD & Gold – No trades yet, waiting for structure shifts.
Multi-timeframe analysis from Monthly → Weekly → Daily → 4H fo
NZD/USD remains in bearish controlNZD/USD is struggling to recover from a four-day low around 0.5845.
✅ Fundamental Factors: USD Dominance & Antipodean Sentiment
NZD/USD's current movement is dictated by geopolitical dynamics and interest rate expectations:
- ⚡Safe-Haven USD: The escalation of conflict in the Middle East (day 10 of the US-Israel-Iran war) continues to push investors toward the US dollar. The Dollar Index (DXY) has now reached its highest level since November 2025.
- ⚡Energy Crisis & Inflation: Surging crude
GBPJPY MULTI TIME FRAME ANALYSISHello traders , here is the full multi time frame analysis for GBPJPY , let me know in the comment section below if you have any questions , the position will be taken only if all rules of the strategies will be satisfied. wait for more price action to develop before taking any position. I suggest you keep this pair on your watchlist and see if the rules of your strategy are satisfied.
🧠💡 Share your unique analysis, thoughts, and ideas in the comments section below. I'm excited to hear your per