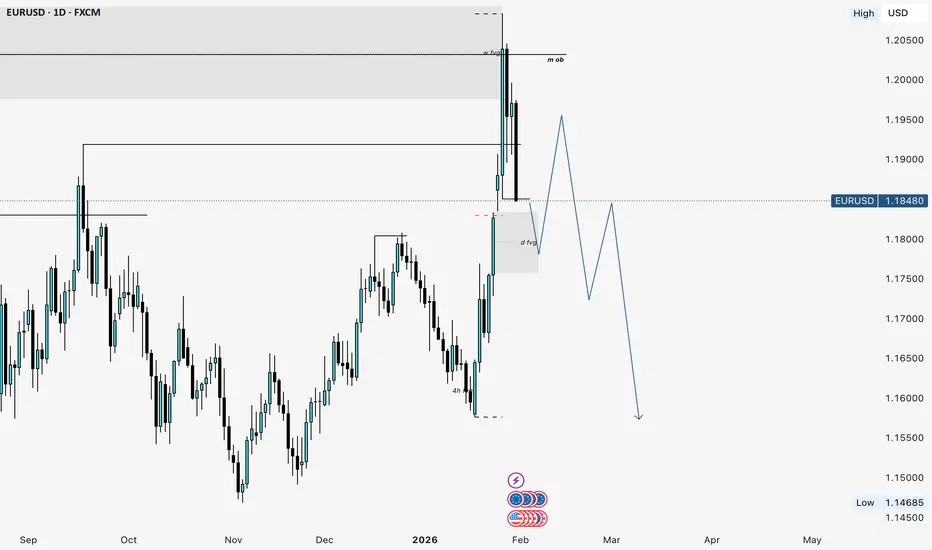
EURUSD - WEEKLY OUTLOOKOn the Monthly & Weekly timeframes, EURUSD remains bearish.
Price is currently holding in the premium area and has printed a strong weekly rejection candle from a monthly Order Block, which supports downside continuation.
🔍 Daily Perspective
Expectation is for price to move into the discount area, tap into the daily FVG, and then make a pullback toward premium. From there, continuation to the downside is anticipated.
📌 This is the bias for next week based on current structure and HTF alignment
Forex market
How the IMF Stabilizes Currencies (In Detail)🏛️ International Monetary Fund (IMF)
The International Monetary Fund (IMF) is a global financial institution established in 1944 at the Bretton Woods Conference. Its primary purpose is to ensure the stability of the international monetary system — meaning stable exchange rates, balanced trade, and sustainable economic growth. One of its most critical roles is stabilizing currencies, especially in countries facing financial crises.
Currency stability is important because unstable currencies cau
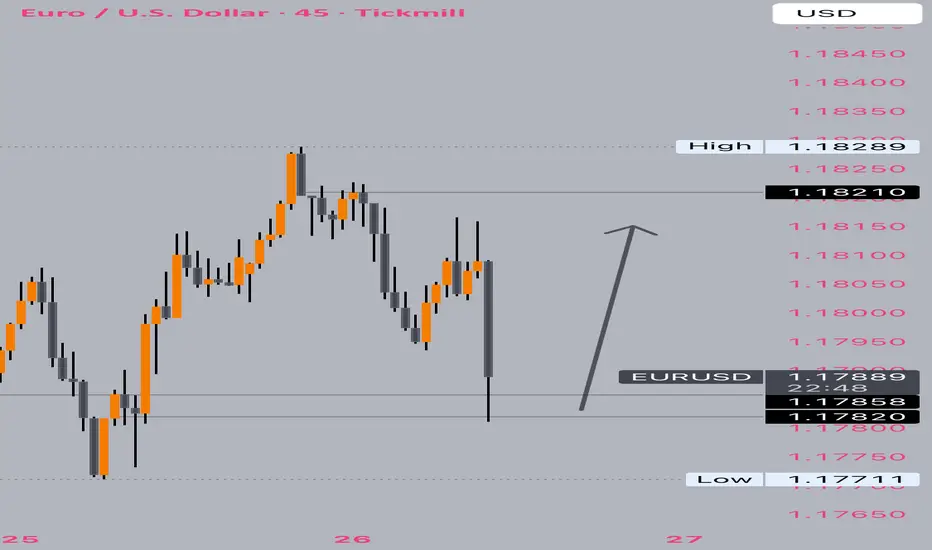
EURUSDPrice has tapped into the lower demand and made new 4H trading range with possible supply above at 1.18000. Now dropping down to 15min we can look for a buy to sell setup at 1.17000 and target first supply and then look for shorts there while closing partials and have some % opened left for a possible swing.
USD/JPY: The 157.00 Breakout & Path to 160.00The Japanese Yen is under immense pressure as the US Dollar capitalizes on a "perfect storm" of hawkish Federal Reserve expectations and safe-haven flows. This chart captures the exact moment a high-probability breakout transitioned into a trending expansion.
EURJPY | Multi-Timeframe OutlookMonthly – Bullish Close, Room to Expand
On the monthly chart, price is trading well above the last flip level and holding above the 10–20 EMA. The latest monthly candle cleared the previous month’s low and closed strong, which gives it a bullish tone. There’s no immediate resistance overhead, and structurally, targeting the previous monthly high this month makes sense.
Weekly – Bounce from 38.2, Trend Intact
On the weekly timeframe, momentum remains clean. Price is above the 10–20 EMA, and if w
NZDJPY | Multi-Timeframe OutlookMonthly – Bullish, but Not Explosive
On the monthly chart, price retested a key flip level and rejected strongly to the upside. The last candle was bullish, but it failed to close above the previous month’s high. So the bias leans bullish, but it’s not aggressive momentum yet. We’re trading comfortably above the 10 and 20 EMA, which supports continuation. There’s still room to print a new higher high.
Weekly – Continuation Structure
The weekly chart strengthens the bullish case. The last weekly
Symmetrical Triangle 🔺 Symmetrical Triangle – Compression Near Major Resistance
🧭 Overview [ /b]
Price is consolidating within a symmetrical triangle while trading below a well-defined major resistance zone. The structure reflects tightening price action and decreasing volatility, suggesting that a directional breakout may be approaching.
⸻⸻⸻⸻⸻⸻⸻⸻⸻⸻⸻
📊 Chart Explanation
• Major Resistance Zone
The red dotted area marks a strong historical supply level. Price previously reacted from this zone, confirming act
Gold daily update
*🟡 XAUUSD (Gold) – TODAY UPDATE 🟡 ⏰*
*Validity: 2-03-26*
*🔹 Bullish Scenario (BUY)*
*• Trend Confirmation: Above 5320*
*• Targets: 5354 – 5430*
*🔻 Bearish Scenario (SELL)*
*• Trend Confirmation: Below 5165*
*• Targets: 5130 – 5090*
*🔄Key Reversal / Entry Level: 5244*
#GoldTrading #freevipsignal #eurusdsignal #viral #trading #EURUSD #anantmoney #RiskManagement #anantmoney #discipline #trading #nofear #tradingpsychology #ConsistencyWins #traderlife #goldsignal
Bearish Descending Channel🧭 Overview
The chart highlights a clear bearish Descending channel defined by a consistent sequence of Lower Highs (LH) and Lower Lows (LL). This pattern reflects sustained selling pressure and confirms that sellers remain in control of the broader trend.
⸻⸻⸻⸻⸻⸻⸻⸻⸻⸻⸻
📘Concept
• Each rally forms a Lower High (LH) → When price moves up, it fails to break the previous high. This shows buyers are weak and unable to regain control.
• Each decline forms a Lower Low (LL) → When price drops, it b
USDJPY Multi-Timeframe Breakdown | London Session plan Monthly Timeframe – Impulse Correction Impulse Structure
On the monthly chart, the broader structure remains bullish. After the last impulsive move to the upside, price corrected into the 38.2% Fibonacci level and is now bouncing cleanly from it. We cleared the previous high, pulled back, and are once again attempting to create a new higher high. The latest monthly candle closed bullish and formed an inside bar, holding above key structure. The overall picture supports a continuation toward the
USDCHF Multi-Timeframe Breakdown | Structure Before ExecutionMonthly Timeframe – Bearish Context at Major Lows
On the monthly chart, the overall trend remains strongly bearish with two consecutive bearish closes, and the latest candle forming inside structure. Price is heavily extended to the downside and trading very close to major historical lows, which makes this a significant area. While continuation toward the lows is still possible, being this extended also increases the probability of a deeper corrective move to the upside. This is a high-sensitivi
AUDUSD Multi-Timeframe Breakdown | Monthly to Intraday Long PlanIn this analysis, I break down AUDUSD using a complete top-down, multi-timeframe approach — starting from the monthly and weekly to build directional bias, then drilling down into the daily and intraday (4H / 1H) to identify actionable trade setups.
🔎 Monthly Bias
Strong bullish monthly close above previous high
Price extended but buy-side liquidity sitting just above
Reacting from a key flip area
High probability of continuation toward liquidity
🔎 Weekly Structure
6 consecutive bullish w
EURUSD MULTI TIMEFRAME ANALYSIS In this session, I break down EURUSD using a complete top-down approach — starting from the monthly and weekly timeframes to build directional bias, then drilling down into daily and 4H to identify positioning opportunities.
🔎 Monthly:
Price is holding above a key level and retesting after a strong close. We’re reacting between the 38.2% and 50% retracement of the last impulsive leg. Structure remains bullish overall.
🔎 Weekly:
Key level holding. Inside bar formation. Bounce from the 61.8% ret
GBPUSD MULTI TIMEFRAME ANALYSIS Hello traders , here is the full multi time frame analysis for this pair, let me know in the comment section below if you have any questions , the entry will be taken only if all rules of the strategies will be satisfied. wait for more price action to develop before taking any position. I suggest you keep this pair on your watchlist and see if the rules of your strategy are satisfied.
EURUSD MULTI TIMEFRAME ANALYSIS Hello traders , here is the full multi time frame analysis for this pair, let me know in the comment section below if you have any questions , the entry will be taken only if all rules of the strategies will be satisfied. wait for more price action to develop before taking any position. I suggest you keep this pair on your watchlist and see if the rules of your strategy are satisfied.
Stopped Out. Reset. Next Plan in Play. EYS ON USDCHF Took losses in EURUSD and GBPUSD.
Risked 0.5R on each — controlled exposure, diversified risk. No damage done.
DXY is clearly strong this session, so I’m shifting focus.
Now watching USDCHF for a potential corrective move.
We’re sitting at extreme lows — historically significant area — and after this kind of extended downside, a deeper upside correction makes sense.
Plan:
Waiting for candle close confirmation
Targeting previous weekly high
RR won’t be 1:3 initially, so I’ll aim for the nea
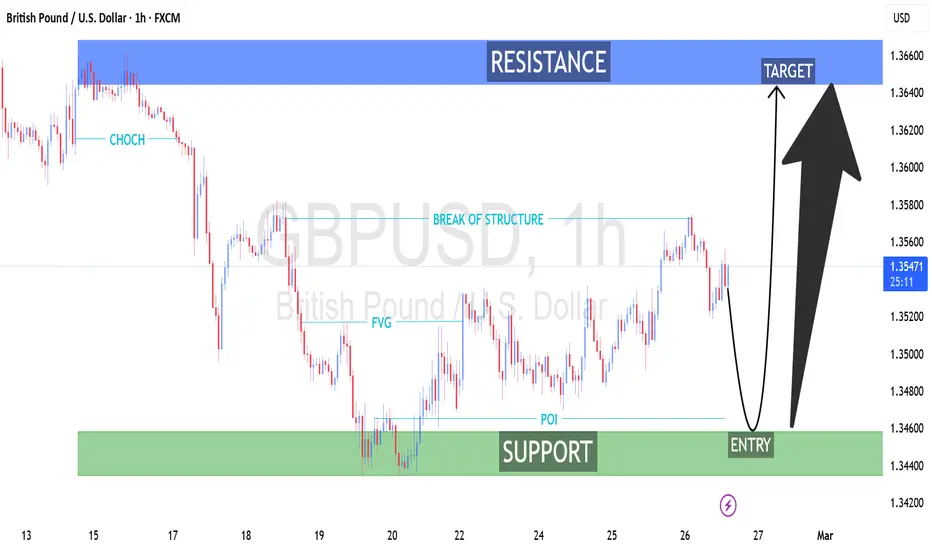
GBP/USD (1H) Technical AnalysisGBP/USD (1H) Technical Analysis
Smart Money Concepts (SMC) Structure-Based Outlook
1. Market Context
On the 1-hour timeframe, GBP/USD is trading within a broader short-term recovery phase after a prior impulsive bearish leg. Price is currently positioned mid-range between a well-defined support zone (demand) and a higher resistance zone (supply).
The chart reflects Smart Money Concepts (SMC) elements including:
CHoCH (Change of Character)
Break of Structure (BOS)
FVG (Fair Value Gap)
POI