Forex market
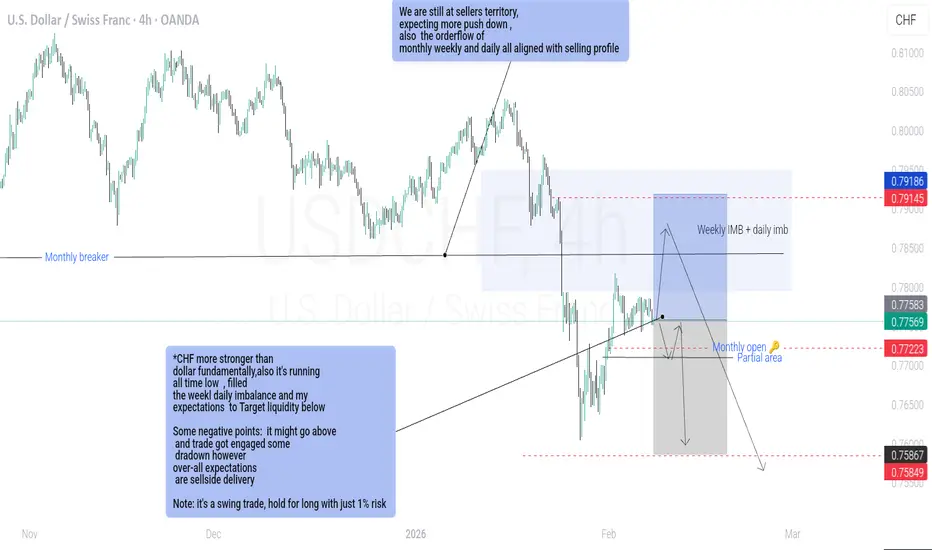
Gbpjpy Projecting in sellside delivery till weekly imbExpecting GBPJPY short term sell delivery,pric rejected from monthly Order block after taking previous monthly highs, expecting liquidity to take till weekly imbalance, onwards based on confirmation bullish move probably expected (the fundamental idea promotes buy from weekly imb where as GBP interest rates are 3.75% (more strength fundamentally than yen ) and Jpy 0.75%
AUDUSD Buy Setup | Discount Zone Reaction + Trendline BreakBias: Bullish
Timeframe: 15M
Pair: AUDUSD
Market Structure & Context
AUDUSD has completed a corrective move within a descending channel after a strong impulsive rally. Price has now reached a higher-timeframe discount zone, aligning with a rising trendline support, where we see clear signs of seller exhaustion.
Downside liquidity has been swept below recent equal lows, followed by strong bullish displacement, indicating potential smart money re-entry from discount.
Technical Confluence
Price reacting from HTF discount zone
Liquidity sweep below equal lows
Descending channel break attempt
Bullish structure shift on lower timeframe
Mean reversion setup targeting equilibrium & premium
Trade Plan
Entry:
Buy on confirmation above 0.66936
Stop Loss:
Below demand & trendline at 0.66728
Targets:
TP1: 0.6725 (Equilibrium)
TP2: 0.6742 (Mid supply)
TP3: 0.6765 (Premium zone / HTF resistance)
Risk–Reward
Approx 1:3.5 – 1:5 RR
Invalidation
Strong close below 0.66728 invalidates bullish bias
Notes
Patience is key. Best entries occur after structure confirmation, not blind buying. This setup favors New York session expansion if DXY weakens.
Chapter 13 — The First Entry IllusionWhy the “first entry” is rarely the safest entry (NZDUSD • 1H case study)
Retail logic says: “First touch = best price.”
Institutional logic says: “First touch = highest uncertainty.”
On the 1H, the first interaction with a zone is usually where liquidity is collected, not where clean continuation is guaranteed.
1) What “First Entry Illusion” really is
The illusion is thinking that a level is an entry.
But the market doesn’t pay you for finding levels.
It pays you for entering after the market proves intent.
First touch is often used to:
trigger impatient entries
run tight stops (because everyone places SL at the obvious edge)
create the real fill for the move (after liquidity is harvested)
So the first entry becomes the best price… for the other side.
2) Read this chart like an institution (using the boards)
A) Context Board (where the bias is, but also the conflict)
From your panel:
Direction: Bearish
H1: Bearish
Daily: Bearish
H4: Neutral
Structure: Bull Struct
Momentum: BEAR
Short Score: 78 (A)
Liquidity Context: HIGH
MTF Status: MIXED
15m bias: Bearish | 5m bias: Bearish
Translation:
Bias is leaning short, but structure is not perfectly aligned (bull-structure tag + mixed MTF).
That’s exactly where the first-entry trap becomes likely.
B) Qualification Gate (this is the key proof)
From your gate:
SETUP: SHORT
HTF CONTEXT: WARN
STRUCTURE: BAD
MOMENTUM: OK
VOL/REGIME: OK
LIQUIDITY: HIGH
ALIGNMENT: 78 / 65
ENTRY PERMISSION: ENTER
This is the “First Entry Illusion” signature:
You can get “ENTER”…
while HTF is WARN and Structure is BAD
and Liquidity is HIGH (meaning: stop pools likely still active)
So the system is basically saying:
“Yes, the short idea is valid — but the environment is still capable of a shakeout.”
That’s institutional thinking: permission is not a promise.
C) Management Desk (why first entry needs management discipline)
From your desk:
Trade Status: VALID
Market Phase: CONTINUATION
Exit Pressure: LOW
Momentum Health: STRONG
Risk State: OVEREXTENDED
Trade Age: FRESH
Action State: HOLD
Translation:
The move is alive (strong momentum / low exit pressure), but risk is overextended → chasing first entry or late entry is expensive.
Institutions don’t “feel” that — they measure it.
3) The institutional sequence (what retail skips)
Retail tries to win by being early.
Institutions try to win by being right after proof.
The safer sequence:
1) Liquidity job happens (HIGH liquidity = expect raids / stop runs)
2) Displacement confirms intent (real push, not just a wick)
3) Retest gives controllable invalidation (this is where risk becomes clean)
4) Then execution (not before)
✅ Rule:
First touch = information.
Second interaction + proof = execution.
4) Practical “No-Trap” rule for Chapter 13 (viral simple, institutional true)
If LIQUIDITY = HIGH and STRUCTURE = BAD/WARN, treat the first entry as a probe, not a full position.
Your discipline upgrade:
First touch: small size / or no trade
Wait: displacement + retest (or structure repair)
Then: full entry with clean SL logic
That is the mindset shift:
From “I want the best price” → to “I want the safest permission.”
5) The real goal (mindset change)
My objective is not to excite retail traders with “early entries.”
My objective is to re-engineer retail behavior into an institutional execution mindset:
Permission > Prediction
Proof > Hope
Risk governance > emotional timing
The core mistake:
Retail thinks: “First touch = best price.”
Institutions think: “First touch = liquidity extraction zone.”
If liquidity is high, the first touch is often designed to punish impatience.
Mistake #1 — Treating a level as an entry
Retail behavior:
“Price reached my zone → I must enter.”
Why it fails (market mechanics):
A zone is only a location. Institutions still need inventory + liquidity.
So they often use the first touch to:
trigger breakout entries
trap reversal entries
sweep obvious stop placements
✅ MARAL solution: Qualification Gate separates “location” from “permission”
Even when SETUP = SHORT, MARAL exposes the danger when:
HTF CONTEXT = WARN
STRUCTURE = BAD
LIQUIDITY = HIGH
Translation: “You are early in a hostile environment. First touch is not a green light.”
Mistake #2 — Ignoring the Liquidity Job
Retail behavior:
Entering before the market raids nearby liquidity pools.
Why it fails:
When Liquidity = HIGH, the market is telling you:
“There are stop pools nearby. Price will likely interact with them before continuing.”
Most first entries get stopped because they sit exactly where liquidity is being harvested.
✅ MARAL solution: Liquidity Context becomes an execution filter
When LIQUIDITY = HIGH, MARAL forces a mindset shift:
First touch = observation / probe
Second interaction after proof = execution
This is institutional sequencing.
Mistake #3 — Thinking “ENTER” means “SAFE”
Retail behavior:
If a tool says “enter”, they go full size emotionally.
Why it fails:
A valid setup can still be a low-quality entry timing.
Market can be right — but the entry can be wrong.
✅ MARAL solution: Permission ≠ Promise (soul of execution)
MARAL gives permission, but the boards reveal risk context.
That’s why ENTRY PERMISSION can show ENTER while
HTF = WARN + STRUCTURE = BAD still exists.
Meaning: Trade idea may be valid, but first entry risk is elevated.
Mistake #4 — Using “tight SL at the obvious place”
Retail behavior:
Stops placed at the clean edge of the zone.
Why it fails:
The clean edge is exactly where the market expects stops to sit.
First touch often manufactures a wick to take those stops, then continues.
✅ MARAL solution: Management Desk converts entries into risk-governed positions
Use the desk like a professional:
If Risk State = OVEREXTENDED → don’t chase / don’t full size
If Trade Age = FRESH + Momentum Health = STRONG → hold winners logically, not emotionally
If Exit Pressure = LOW → avoid panic exits on noise
It’s not about “being right”. It’s about “staying right.”
Mistake #5 — No “Proof Step” (they skip confirmation)
Retail behavior:
They enter at touch. They don’t require displacement or structure repair.
Why it fails:
Without proof, first entry is just a guess.
✅ MARAL solution: Proof-based execution gating
MARAL’s institutional workflow is:
Context → Qualification → Management
So the correct approach is:
When Structure is BAD/WARN: demand proof (displacement / repair)
When MTF Status = MIXED: reduce aggression (no hero entries)
When Liquidity = HIGH: expect traps first
The MARAL “First Entry Protocol” (simple + viral)
When you see this combination:
✅ Setup: SHORT
⚠️ HTF: WARN
❌ Structure: BAD
🔥 Liquidity: HIGH
Your action is not “enter fast”.
Your action is:
1) No full size on first touch
First entry = probe or wait.
2) Require proof
Displacement + cleaner retest.
3) Let the market pay you for patience
Second interaction is usually safer than the first.
Closing line (institutional mindset)
Retail asks: “How early can I enter?”
Institutions ask: “Has the market earned my participation?”
Your goal is not to catch the first move.
Your goal is to catch the safest move.
#Trading #Forex #SMC #SmartMoneyConcept #OrderBlocks #Liquidity #MarketStructure #PriceAction #RiskManagement #TradingPsychology #TradingDiscipline #DayTrading
EUR/USD Complete PictureTechnically:
As per the Current Market Structure, EUR/USD looks weaker for an 1st Target of 1.15305 . Once Wave E is completed EUR/USD turns into buy side for an 2nd Target of 1.20300
Fundamentally: Change of Structure Possible on Jan23rd based on the data German and French Flash manufacturing which will decide the next move of EURO and Pound Pairs.
How to Move Capital Smartly for Consistent Market ReturnsRotation Strategies Guide:
Rotation strategies are a powerful yet often misunderstood approach to investing and trading. At their core, rotation strategies focus on shifting capital from one asset, sector, or market to another based on changing market conditions, relative strength, and economic cycles. Instead of staying emotionally attached to a single stock or sector, rotation strategies encourage flexibility, discipline, and adaptability—key traits required for long-term success in financial markets.
This guide explains rotation strategies in depth, covering their logic, types, execution methods, benefits, risks, and practical application.
Understanding the Concept of Rotation
Markets are dynamic. Money constantly flows from one area to another. When one sector becomes expensive or loses momentum, capital often moves into another sector offering better growth or value. Rotation strategies aim to track and follow this flow of money rather than fighting it.
For example, during economic expansion, capital may rotate into cyclical sectors such as metals, infrastructure, and banking. In contrast, during uncertainty or slowdown, money may move into defensive sectors like FMCG, pharmaceuticals, or utilities. Rotation strategies attempt to capture these shifts early and ride them efficiently.
Why Rotation Strategies Matter
One of the biggest challenges for traders and investors is stagnation—holding assets that move sideways or decline while other opportunities outperform. Rotation strategies solve this problem by ensuring capital is always working in the strongest areas of the market.
Key reasons rotation strategies are important:
They help avoid long drawdowns
They improve risk-adjusted returns
They reduce emotional decision-making
They align trades with institutional money flow
They adapt naturally to changing market cycles
Instead of predicting tops and bottoms, rotation strategies focus on relative performance, which is more reliable and practical.
Types of Rotation Strategies
Rotation strategies can be applied at multiple levels depending on your trading or investing style.
Sector Rotation
This involves moving capital between sectors such as IT, banking, energy, pharma, and FMCG based on economic cycles, earnings growth, and momentum. Sector rotation is widely used by mutual funds and institutional investors.
Asset Class Rotation
Here, capital is rotated between equities, bonds, commodities, currencies, and cash. For example, during inflationary periods, money may rotate from bonds into commodities and equities.
Market-Cap Rotation
This strategy focuses on shifting between large-cap, mid-cap, and small-cap stocks. In early bull markets, large caps often lead. As confidence increases, capital rotates into mid and small caps for higher returns.
Style Rotation
Style rotation involves switching between growth, value, dividend, and momentum stocks based on market conditions and valuation cycles.
Time-Frame Rotation
Traders may rotate between short-term momentum trades and positional trades depending on volatility, trend strength, and market clarity.
How Rotation Strategies Work in Practice
Rotation strategies rely on relative strength analysis rather than absolute price movement. An asset does not need to be rising strongly; it only needs to perform better than alternatives.
Common tools used include:
Relative Strength (RS) or Relative Strength Index comparison
Sector and index performance ranking
Moving averages and trend analysis
Volume expansion and contraction
Ratio charts (one asset divided by another)
For example, if banking stocks outperform the broader index consistently while IT stocks underperform, rotation logic suggests shifting capital from IT to banking—even if both are rising.
The Role of Economic Cycles
Economic cycles play a crucial role in rotation strategies. Markets generally move through expansion, peak, contraction, and recovery phases. Each phase favors different sectors and assets.
Early Recovery: Banking, infrastructure, industrials
Expansion: Metals, capital goods, mid-caps
Late Cycle: FMCG, healthcare, quality large caps
Recession or Fear Phase: Gold, bonds, defensive stocks
Understanding these cycles allows traders and investors to anticipate rotations instead of reacting late.
Risk Management in Rotation Strategies
Rotation does not mean constant buying and selling without structure. Poor execution can increase transaction costs and emotional stress. Proper risk management is essential.
Important risk controls include:
Clear entry and exit rules
Defined rebalancing frequency (weekly, monthly, quarterly)
Stop-loss or relative underperformance exit
Position sizing based on volatility
Avoiding over-rotation during choppy markets
Rotation strategies work best when markets show clear leadership and trends. During sideways or range-bound conditions, patience is required.
Advantages of Rotation Strategies
Rotation strategies offer several long-term advantages:
Capital Efficiency: Money is allocated to stronger opportunities
Reduced Opportunity Cost: Avoids holding dead or weak assets
Lower Emotional Bias: Decisions are rule-based, not emotional
Adaptability: Works across different market environments
Consistency: Focuses on steady performance rather than big wins
For disciplined traders, rotation strategies often outperform random stock picking over time.
Common Mistakes to Avoid
Many traders fail with rotation strategies due to improper execution rather than flawed logic.
Common mistakes include:
Rotating too frequently without confirmation
Chasing late-stage outperformers
Ignoring transaction costs and taxes
Overcomplicating analysis
Lack of patience during transition phases
Successful rotation requires clarity, patience, and consistency.
Who Should Use Rotation Strategies
Rotation strategies are suitable for:
Swing traders looking for momentum leadership
Positional traders following sector trends
Long-term investors managing portfolios
Professionals seeking systematic allocation methods
They are especially useful for traders who prefer structure over prediction.
Conclusion
Rotation strategies are not about forecasting the future; they are about responding intelligently to what the market is already doing. By tracking relative strength, understanding economic cycles, and managing risk effectively, traders and investors can consistently stay aligned with market leadership.
In a world where markets constantly evolve, rotation strategies provide flexibility, discipline, and a logical framework to grow capital steadily. Those who master rotation learn a crucial truth of the market: money never disappears—it only moves. The key to success is learning how to move with it, not against it.
USDJPY MULTI TIMEFRAME ANALYSIS Hello traders , here is the full multi time frame analysis for this pair, let me know in the comment section below if you have any questions , the entry will be taken only if all rules of the strategies will be satisfied. wait for more price action to develop before taking any position. I suggest you keep this pair on your watchlist and see if the rules of your strategy are satisfied.
EURUSD Buy Setup | Discount Zone Support + Trendline CompressionBias: Bullish
Timeframe: 1H
Pair: EURUSD
Trade Idea:
EURUSD is currently trading inside a discount zone, holding above a well-defined demand/support area. Price has respected this zone multiple times and is now showing compression against a descending trendline, indicating potential bullish expansion.
Liquidity has been swept on the downside, followed by a strong reaction from the demand zone, suggesting smart money accumulation. As long as price holds above the marked support, bullish continuation remains the higher-probability scenario.
Entry:
Buy on confirmation above 1.1690 – 1.1700
Stop Loss:
Below demand & recent lows at 1.1675
Targets:
TP1: 1.1728 (Equilibrium)
TP2: 1.1750 (Range high / supply zone)
TP3: 1.1770 (Premium zone)
Confluence:
Discount zone support
Trendline breakout potential
Liquidity sweep below equal lows
Mean reversion towards equilibrium
Risk–Reward
Approx 1:3 to 1:4 RR
Invalidation:
Strong H1 close below 1.1675
Disclaimer: Educational Purpose only
EURUSD – 15M | Sell-Side Sweep → Demand Tap → Reversal PlayPrice just engineered a clean sell-side liquidity sweep into a well-defined HTF demand zone.
Downside expansion shows liquidity delivery, not continuation.
Context check:
Equal lows taken ✔️
Reaction from demand ✔️
No follow-through below value ✔️
EURUSD – 15M | Liquidity Sweep → Demand Reaction →Mean ReversionPrice delivered a clean sell-side liquidity sweep into a higher-timeframe demand zone.
Displacement down exhausted, followed by acceptance and stabilization inside value.
Current structure suggests:
Sell-side taken ✔️
Price reacting from HTF demand ✔️
Expectation: mean reversion toward premium / EQ highs
Plan:
Longs favored only after confirmation on LTF
Ideal entry: sweep + reclaim of intraday lows
Targets aligned toward prior supply / liquidity resting above
Invalidation: clean breakdown and acceptance below demand
Bias stays bullish as long as demand holds.
Risk Management in Trading: How to Avoid Big Trading LossesUnderstanding Risk in Trading
Risk in trading refers to the possibility of losing part or all of your invested capital due to adverse market movements. Every trade carries uncertainty because markets are influenced by countless factors such as economic data, global events, institutional activity, and market psychology. A trader who ignores this uncertainty often overexposes themselves, leading to large and sometimes irreversible losses. Recognizing that risk is unavoidable is the first step toward controlling it.
Capital Preservation Comes First
The primary goal of risk management is capital preservation. If you lose a large portion of your trading capital, it becomes mathematically harder to recover. For example, a 50% loss requires a 100% gain just to break even. This is why professional traders prioritize protecting their capital over chasing profits. Staying in the game is more important than making quick money.
Position Sizing: The Core of Risk Control
One of the most effective tools in risk management is proper position sizing. Position sizing determines how much capital you allocate to a single trade. A common rule followed by disciplined traders is risking only 1–2% of total trading capital on any single trade. This means that even if several trades fail consecutively, the overall damage to the account remains manageable. Proper position sizing ensures that emotions remain under control and trading decisions stay rational.
Use of Stop-Loss Orders
Stop-loss orders are essential for avoiding big losses. A stop-loss defines the maximum loss you are willing to accept on a trade before entering it. Without a stop-loss, traders often fall into the trap of holding losing positions, hoping the market will reverse. This behavior can turn small losses into devastating ones. A predefined stop-loss enforces discipline and removes emotional decision-making during volatile market conditions.
Risk-Reward Ratio Matters
A favorable risk-reward ratio is a key principle of long-term profitability. This ratio compares the potential loss of a trade to its potential gain. For example, risking ₹1 to make ₹2 gives a 1:2 risk-reward ratio. Even if you are right only 40–50% of the time, a good risk-reward structure can keep you profitable. Traders who accept large risks for small rewards often face consistent losses despite a high win rate.
Avoid Overtrading
Overtrading is one of the most common causes of large trading losses. It occurs when traders take too many trades due to boredom, revenge trading after losses, or the fear of missing out (FOMO). Each trade carries risk, and excessive trading increases exposure unnecessarily. A well-defined trading plan with strict entry criteria helps reduce overtrading and improves overall performance.
Diversification and Market Selection
Putting all your capital into one asset, one sector, or one type of trade increases risk significantly. Diversification helps spread risk across different instruments or strategies. While diversification does not eliminate losses, it reduces the impact of a single adverse event. At the same time, traders should avoid over-diversification, which can dilute focus and lead to poor execution.
Emotional Discipline and Psychology
Emotions such as fear, greed, hope, and frustration are major contributors to big trading losses. Fear can cause premature exits, while greed can lead to oversized positions. Revenge trading after a loss often results in even bigger losses. Strong risk management rules act as a psychological safety net, helping traders stay calm and disciplined regardless of market conditions.
Leverage: A Double-Edged Sword
Leverage allows traders to control larger positions with smaller capital, but it also magnifies losses. Many traders blow their accounts by misusing leverage. High leverage combined with poor risk management can wipe out an account in minutes. Sensible use of leverage, aligned with strict stop-losses and position sizing, is essential to avoid catastrophic losses.
Adapting to Market Conditions
Markets are dynamic, and risk levels change with volatility. During high-volatility periods such as major news events or earnings announcements, price swings can be unpredictable. Reducing position size or staying out of the market during such times is a smart risk management decision. Flexibility and adaptability are crucial traits of successful traders.
Keep a Trading Journal
A trading journal is a powerful tool for improving risk management. By recording entry reasons, position size, stop-loss levels, emotions, and outcomes, traders can identify patterns that lead to losses. Over time, this self-analysis helps refine strategies, eliminate costly mistakes, and strengthen discipline.
Consistency Over Perfection
Many traders aim for perfect entries and high win rates, but consistency is far more important. A trader who follows risk management rules consistently will outperform a trader who occasionally makes big gains but suffers massive losses. Small, controlled losses are part of the trading process and should be accepted without emotional distress.
Long-Term Perspective
Risk management encourages a long-term mindset. Instead of focusing on daily profits or losses, traders should evaluate performance over a series of trades. This approach reduces emotional pressure and promotes logical decision-making. Successful trading is a marathon, not a sprint.
Conclusion
Avoiding big trading losses is not about predicting the market with absolute accuracy; it is about managing risk intelligently. Proper position sizing, disciplined use of stop-losses, favorable risk-reward ratios, emotional control, and capital preservation form the foundation of effective risk management. Traders who respect risk survive market downturns, learn from mistakes, and compound their capital steadily over time. In trading, protecting what you have is the first step toward achieving what you want.
How to Avoid Breakout Traps in TradingUnderstanding What a Breakout Trap Is
A breakout trap occurs when price appears to break an important level such as support, resistance, trendline, or chart pattern boundary, but fails to sustain that move. Instead of continuing in the breakout direction, the market reverses and moves aggressively in the opposite direction. Retail traders often enter late on excitement or fear of missing out, while smart money uses this liquidity to exit or enter opposite positions. Recognizing that markets are driven by liquidity rather than obvious patterns is the first step in avoiding breakout traps.
Importance of Market Context
One of the most effective ways to avoid breakout traps is to analyze the broader market context. Breakouts behave differently depending on whether the market is trending, ranging, or highly volatile. In a strong trending market, breakouts are more likely to succeed. In contrast, range-bound or choppy markets tend to produce frequent false breakouts. Traders should always ask: Is the market trending or consolidating? Entering breakout trades in tight ranges without strong momentum significantly increases the probability of getting trapped.
Volume as a Confirmation Tool
Volume is a critical factor in validating breakouts. A genuine breakout is usually supported by a noticeable increase in volume, reflecting strong participation and conviction. False breakouts often occur on low or average volume, indicating a lack of commitment. If price breaks a level but volume remains weak or declines, it is a warning sign that the move may fail. Traders should avoid entering breakouts that lack volume confirmation and instead wait for clear signs of market participation.
Waiting for Candle Close Confirmation
Many breakout traps happen because traders enter positions the moment price crosses a level. Professional traders often wait for a candle close beyond the breakout level on the chosen timeframe. A close confirms that the market accepted the new price area rather than rejecting it. For example, if resistance is broken intraday but the candle closes below it, the breakout has failed. Patience in waiting for confirmation significantly reduces false entries.
Role of Retest and Pullback
One of the safest ways to trade breakouts is to wait for a retest of the broken level. After a true breakout, price often pulls back to test the former resistance (now support) or former support (now resistance). If the level holds and price shows rejection signals such as strong bullish or bearish candles, the probability of a successful trade increases. Breakout traps often fail during retests, making this approach a powerful filter against false signals.
Avoiding News and High-Volatility Periods
Major economic news, earnings announcements, and central bank decisions often create sharp price spikes that look like breakouts but quickly reverse. These moves are driven by short-term volatility rather than sustainable trend shifts. Trading breakouts during such periods is risky unless one is experienced with news-based strategies. To avoid traps, traders should be aware of the economic calendar and either reduce position size or stay out of the market during high-impact events.
Using Multiple Timeframe Analysis
Analyzing multiple timeframes helps traders identify stronger and more reliable breakouts. A breakout that aligns with higher timeframe trends has a greater chance of success. For example, a breakout on a 15-minute chart that goes against the daily trend is more likely to fail. Checking higher timeframes for trend direction, key levels, and market structure can prevent traders from entering low-probability breakout trades.
Recognizing Liquidity Zones and Stop Hunts
Markets often move toward areas where stop-loss orders are clustered, such as above obvious resistance or below clear support. Smart money may intentionally push price beyond these levels to trigger stops and create liquidity before reversing. Traders should be cautious of breakouts at obvious levels that everyone is watching. Instead of entering immediately, observe price behavior to see whether the breakout is accepted or quickly rejected.
Risk Management and Position Sizing
Even with the best analysis, some breakout traps are unavoidable. Effective risk management ensures that a single false breakout does not cause significant damage. Using predefined stop-loss levels, limiting risk per trade, and maintaining proper position sizing are essential. Stops should be placed logically, not emotionally, and traders should accept small losses as part of the trading process rather than trying to avoid losses entirely.
Emotional Discipline and Patience
Breakout traps often exploit trader psychology, particularly fear of missing out and overconfidence. Emotional trading leads to impulsive entries and poor decision-making. Developing discipline, sticking to a trading plan, and accepting that not every breakout needs to be traded are crucial skills. Sometimes the best trade is no trade, especially when conditions are unclear.
Continuous Review and Learning
Finally, avoiding breakout traps requires continuous learning and self-review. Traders should maintain a journal documenting breakout trades, noting which ones succeeded and which failed. Over time, patterns emerge that highlight common mistakes and areas for improvement. Learning from past traps transforms losses into valuable lessons and strengthens overall trading performance.
Conclusion
Breakout traps are an inevitable part of trading, but they do not have to be devastating. By understanding market context, using volume and confirmation tools, waiting for retests, applying multi-timeframe analysis, and practicing strong risk management, traders can significantly reduce the impact of false breakouts. Success in breakout trading is not about catching every move, but about filtering out low-quality setups and focusing on high-probability opportunities. With patience, discipline, and experience, traders can turn breakout traps from costly mistakes into powerful learning experiences.
USDJPY Sell TradePrice is currently in a downtrend on the 1Hour timeframe. Price retested the orderblock on the 15min Timeframe with was also between the 0.62 and 0.78 fibonacci level. Price is now rejecting the oredrblock and looking to continue to the down trend. We are targetting a 1:2 RR and Stoploss and takeprofit levels have been indicated on the chart.
EURUSD – Liquidity Sweep + Break of Descending ChannelTimeframe: 1H
Bias: Bullish Reversal
Concepts Used: Liquidity Sweep • Discount Pricing • Reversal Structure • FVG • Channel Break
Trade Idea Summary
EURUSD has swept major sell-side liquidity below the previous swing low and immediately reacted from a deep discount demand zone. After the liquidity grab, price broke out of the descending channel, indicating a possible shift toward bullish order flow.
if Price also tap into an imbalance (FVG) and has shown a clean corrective retest of the breakout level.
All these confluences point toward a higher probability long continuation.
🟢 Long Setup Details
Entry: 1.17140 – 1.17160
Stop Loss: 1.16830 (below the liquidity sweep zone)
Take Profit: 1.17800 (premium zone / upper imbalance fill)
Risk-to-Reward: Approx. 1:3.5
Trade Narrative
✔ Price took out liquidity below the major lows
✔ Strong bullish displacement afterwards
✔ Retesting the channel trendline + equilibrium zone
✔ Price trading from discount toward premium
✔ Clean inefficiency above acting as magnet
As long as EURUSD holds above the retest zone, bullish continuation toward the premium area is expected.
This setup remains valid until price breaks below the liquidity sweep low.
Disclaimer: For Educational Purpose
EURUSD | HTF Demand Reaction After Liquidity SweepTrade Idea Overview
EURUSD is currently trading in a clear bearish structure, making lower highs and lower lows. Price has recently swept sell-side liquidity, tapped into a higher timeframe demand zone in discount, and reacted strongly from equilibrium — indicating potential mean reversion to the upside.
This setup aligns with Smart Money Concepts, where institutions accumulate positions after liquidity is taken and price trades below fair value.
Technical Confluence
HTF bearish structure with controlled pullback
Sell-side liquidity sweep below recent lows
Price entering HTF demand / discount zone
Reaction near equilibrium (50%), confirming imbalance
Previous internal structure support acting as demand
Trade Plan
Bias: Short-term bullish (counter-trend mean reversion)
Entry: From demand zone after liquidity sweep
Stop Loss: Below demand (invalidation level)
Targets:
TP1: Internal liquidity / imbalance fill
TP2: Previous structure high / premium zone
Risk-to-reward remains favorable, making this setup valid even with a modest win rate.
Invalidation
A strong candle close below the demand zone will invalidate the setup and signal continuation of the bearish trend.
Advanced Trading Methods1. Market Structure and Microstructure-Based Trading
One of the most advanced approaches in trading involves understanding market structure and microstructure. This includes studying how orders flow through the market, how liquidity is created and removed, bid-ask spreads, order book dynamics, and the behavior of market participants such as institutions, high-frequency traders, and market makers. Traders use tools like Level II data, time-and-sales, volume profile, and footprint charts to identify where large players are active. By aligning trades with institutional order flow, traders aim to reduce randomness and increase probability.
2. Quantitative and Algorithmic Trading
Quantitative trading relies on mathematical models, statistical analysis, and computer algorithms to identify trading opportunities. Instead of subjective decision-making, rules are coded based on historical data, probabilities, correlations, and patterns. Algorithms can execute trades automatically based on predefined conditions, removing emotional bias. Advanced quantitative strategies include mean reversion models, trend-following systems, statistical arbitrage, pair trading, and factor-based investing. These methods often involve backtesting, optimization, and continuous refinement to adapt to changing market conditions.
3. High-Frequency Trading (HFT)
High-frequency trading is one of the most technologically advanced trading methods. It involves executing a large number of trades at extremely high speeds, often in microseconds. HFT strategies exploit tiny price inefficiencies, latency advantages, and short-term liquidity imbalances. These traders rely on colocated servers, direct market access, and ultra-low-latency infrastructure. While HFT is largely inaccessible to retail traders, understanding its impact helps advanced traders recognize sudden volatility spikes, false breakouts, and rapid liquidity shifts.
4. Options and Derivatives Strategies
Advanced trading frequently incorporates derivatives such as options, futures, and swaps. Options trading, in particular, allows traders to structure positions based on volatility, time decay, and directional bias. Advanced strategies include spreads, straddles, strangles, iron condors, butterflies, calendar spreads, and ratio spreads. These methods enable traders to profit in sideways, volatile, or trending markets while defining risk. Futures and options are also used for hedging portfolios, managing exposure, and leveraging capital efficiently.
5. Volatility-Based Trading
Volatility is a core component of advanced trading. Instead of focusing only on price direction, traders analyze implied volatility, historical volatility, and volatility skew. Volatility trading strategies aim to profit from changes in volatility rather than price movement itself. For example, traders may buy options when volatility is low and expected to rise, or sell options when volatility is high and expected to fall. Instruments like VIX futures, volatility ETFs, and variance swaps are often used in advanced volatility trading frameworks.
6. Global Macro and Intermarket Trading
Global macro trading involves analyzing macroeconomic trends, interest rates, inflation, central bank policies, geopolitical events, and cross-border capital flows. Advanced traders study how different asset classes—equities, bonds, currencies, and commodities—interact with each other. Intermarket analysis helps traders identify correlations and divergences, such as equity markets reacting to bond yields or currencies responding to interest rate differentials. This method allows traders to position themselves ahead of major economic shifts rather than reacting to short-term price movements.
7. Smart Money and Institutional Trading Concepts
Smart money trading focuses on identifying the actions of institutional participants who control large volumes of capital. These traders study accumulation and distribution phases, liquidity zones, stop-hunting behavior, and market manipulation patterns. Concepts such as order blocks, fair value gaps, liquidity pools, and imbalance zones are used to anticipate price movement. Advanced traders aim to enter trades where institutions are likely to defend positions, thereby increasing the probability of success.
8. Sentiment and Behavioral Trading
Advanced trading methods incorporate market psychology and behavioral finance. Traders analyze sentiment indicators such as put-call ratios, commitment of traders (COT) reports, volatility indexes, social media sentiment, and fund flow data. Extreme optimism or pessimism often signals potential reversals. By understanding crowd behavior, fear, greed, and cognitive biases, advanced traders position themselves contrarian to emotional market participants.
9. Risk Management and Portfolio Optimization
At the advanced level, risk management is as important as strategy selection. Traders use position sizing models, value-at-risk (VaR), expected shortfall, drawdown analysis, and correlation-based diversification. Portfolio optimization techniques help balance risk across multiple instruments and strategies. Advanced traders focus on consistency, capital preservation, and long-term performance rather than chasing short-term gains.
10. Adaptive and Machine Learning-Based Trading
Modern advanced trading increasingly integrates machine learning and artificial intelligence. These systems analyze vast amounts of data to detect non-linear relationships and evolving patterns. Adaptive strategies adjust parameters automatically based on market conditions. While complex, these methods allow traders to respond dynamically to changing volatility, liquidity, and regime shifts, making them highly powerful when implemented correctly.
Conclusion
Advanced trading methods represent a holistic and professional approach to financial markets. They combine technical expertise, quantitative analysis, market psychology, technology, and disciplined risk management. Unlike basic trading, advanced methods focus on probability, structure, and adaptability rather than prediction. While they require significant learning, practice, and capital discipline, advanced trading methods provide traders with the tools to navigate complex markets, manage uncertainty, and pursue sustainable long-term profitability.
Part 2 Master Candle Stick PatternsOption Writing (Selling)
Option writing is extremely popular among professional traders because of:
High probability
Steady premium income
Neutral strategies
Hedged spreads
However, naked (unhedged) selling is risky.
Margin in Options
Option buyers need only premium.
Option sellers need margin—due to unlimited risk.
Brokers calculate margin using SPAN + Exposure method.