EURUSD Range Play – Support Reacting AgainEURUSD is currently trading inside a well-defined intraday range on the 15 minute timeframe. Price has already reacted multiple times from the range high and range support, clearly showing that the market is respecting these boundaries.
Right now, we are once again seeing a reaction from the lower support zone. For me, this is not about predicting a breakout, it’s about observing behavior. When a market keeps respecting the same level, it tells you liquidity is sitting there and participants ar
Forex market
EUR/USD – Tactical Short
1H Supply Repricing Within Established Bearish Order Flow
Execution Timeframe: 5M | Risk Model: Intraday Tactical Allocation
I. Market Context & Structural Bias
EUR/USD remains in a clearly defined 1H bearish auction structure, characterized by sequential lower highs and lower lows. The latest expansion leg has printed a fresh 1H lower low, confirming downside initiative and continuation order flow.
The current upward move is a corrective repricing phase into
EURUSD – Multi-Timeframe Supply & Demand SetupMarket Context (Top–Down View)
– Daily: Price is reacting inside a higher-timeframe supply/demand zone. This zone previously caused a strong impulsive move, indicating institutional participation.
– 4H: Structure shows a potential shift (BOS/CHOCH), suggesting short-term alignment with the higher timeframe zone.
– Bias: Intraday directional move expected from HTF imbalance.
What I’m Watching
– Clean reaction inside the Daily zone
– 4H structure shift confirming order flow
– Liquidity sweep (e
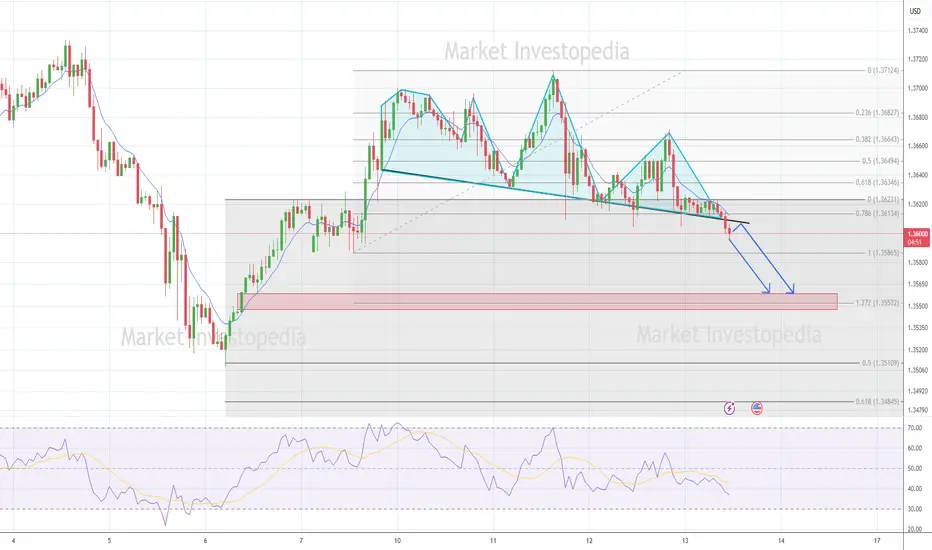
EURUSD SHOWING A GOOD DOWN MOVE WITH 1:8 RISK REWARD EURUSD SHOWING A GOOD DOWN MOVE WITH 1:8 RISK REWARD
DUE TO THESE REASON
A. its following a rectangle pattern that stocked the market
which preventing the market to move any one direction now it trying to break the strong resistant lable
B. after the break of this rectangle it will boost the market potential for break
C. also its resisting from a strong neckline the neckline also got weeker ald the price is ready to break in the outer region
all of these reason are indicating the same thing i
Cloud Computing and SemiconductorsWhat Is Cloud Computing?
Cloud computing refers to the delivery of computing services—such as servers, storage, databases, networking, software, and analytics—over the internet (“the cloud”). Instead of owning and maintaining physical hardware, individuals and organizations rent computing resources from providers and pay only for what they use.
Major cloud providers include:
Amazon Web Services (AWS)
Microsoft (Azure)
Google (Google Cloud)
These companies operate massive data centers fille
FOREX "PAIRS IN PLAY" Session 34 17 02 26Scanning multiple forex pairs to filter high-quality trade setups. No trades are forced—only structure-based opportunities.
Note: There may be a delay in this video due to upload processing time.
Disclaimer: FX trading involves high leverage and substantial risk, and losses can exceed your initial investment. This content is for educational purposes only and should not be considered financial advice. Trade at your own risk.
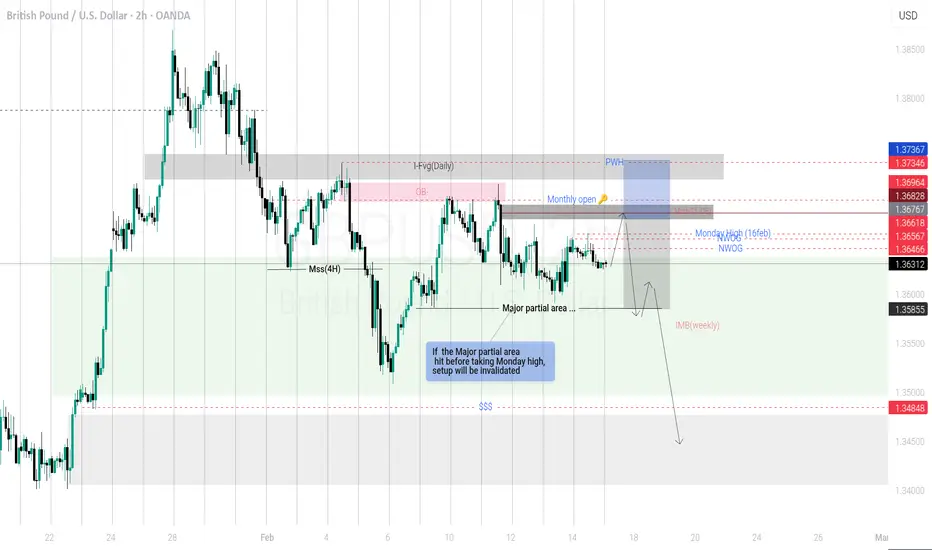
Expecting sell delivery in GBPUSDThe first and foremost which promotes my idea is "Daily and weekly structure where all Buyside liquidity is taken above , then price faile to make a high and close below the daily inversion (I-fvg) which indicates the bearish flow , and then made structure shift in 4H TF , afterwards it retested the orderblock and makes a sell side expansion which indicates it's weakness and increases its tendency to go for liquidity down below!!
Even if you plan to execute, only execute if the price didn't b
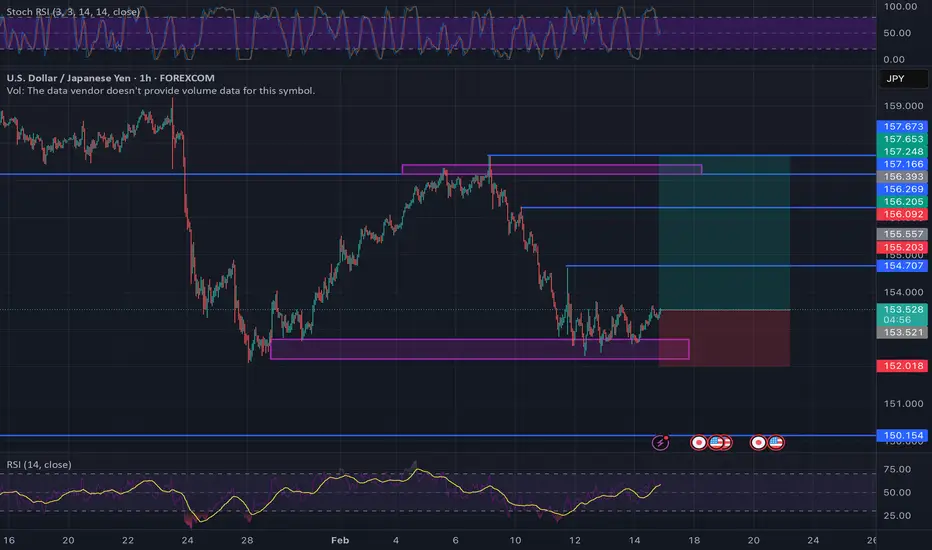
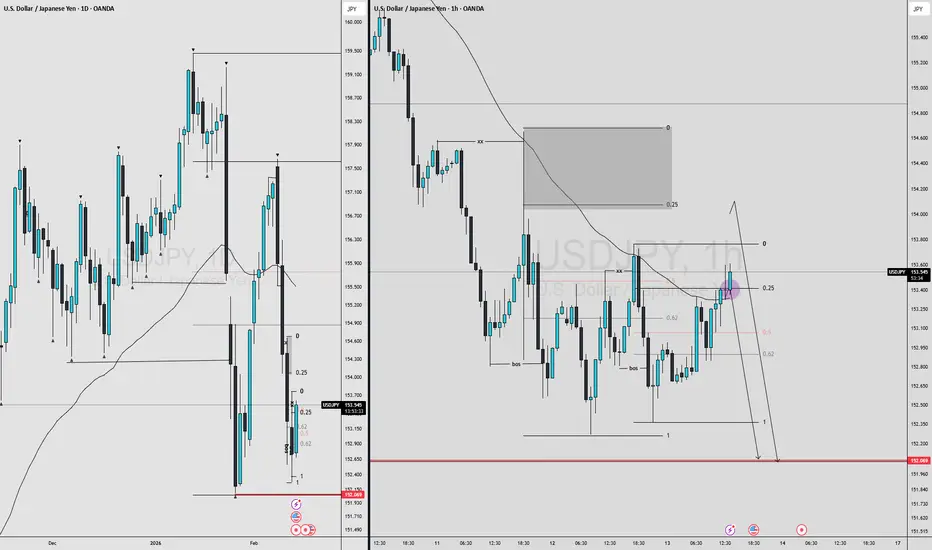
USDJPY ANALYSIS OVER H1 CHART.USDJPY is reacting well from the demand zone highlighted on my TradingView chart. Price is holding above support and starting to build a base, which keeps the bullish bias intact as long as this level holds.
I’m staying long from 153.500, targeting 154.700 → 156.200 → 157.650, with risk clearly protected below 152.000.
As long as we remain above support, the upside structure remains valid.
Will continue to manage the trade strictly and update as price develops.
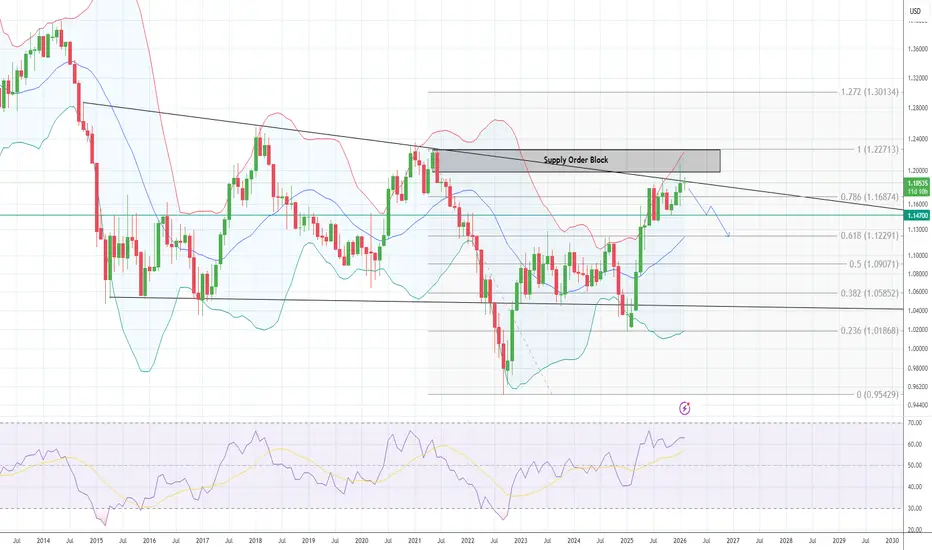
EURUSD Looks Weak on Monthly ChartEURUSD Analysis (Monthly Chart)
* The pair is trending within a descending wedge pattern, and prices have failed to breach its upper trendline multiple times in recent months.
* During Jan, the pair breached the wedge, tested the supply order block, then retraced lower.
* The month of Feb also failed to give a close higher till date.
* Hence, prices are now expected to retrace lower below 1.1800, with immediate support at the fib level 0.786 (1.1685)
* Below which, it might continue the dow
FOREX "PAIRS IN PLAY" Session 33 15 02 26Scanning multiple forex pairs to filter high-quality trade setups. No trades are forced—only structure-based opportunities.
Note: There may be a delay in this video due to upload processing time.
Disclaimer: FX trading involves high leverage and substantial risk, and losses can exceed your initial investment. This content is for educational purposes only and should not be considered financial advice. Trade at your own risk.
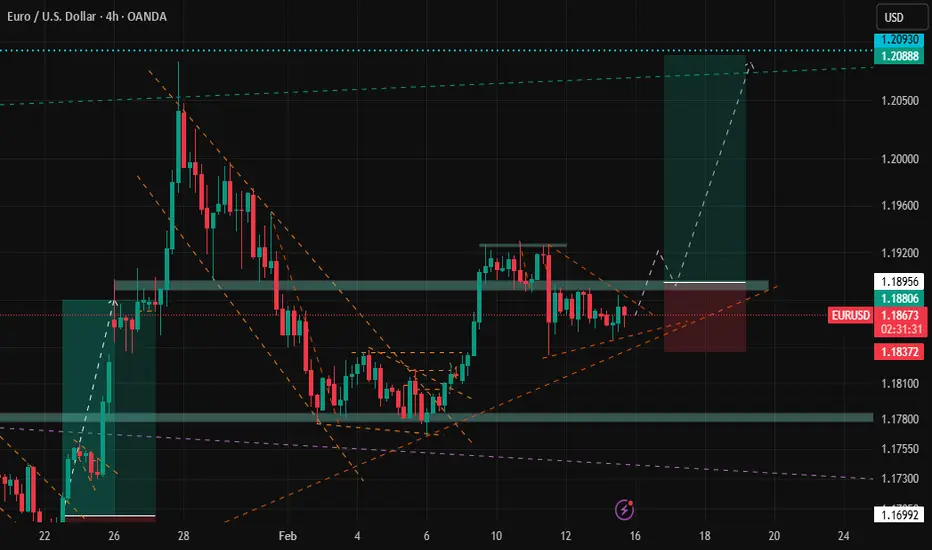
EURUSD BUY Breakout + Retest Entry
➡️ Break & Buy Above: 1.18956
When price decisively breaks above key resistance and holds, this signals bullish continuation.
📌 Stop-Loss: 1.1372
📌 Targets:
• TP1: 1.20888
• TP2: 1.21500
Why this works: Breakouts that retest previous resistance as support can unleash strong up moves.
NZD/JPY – Buy Entry Points📈 NZD/JPY – Buy Entry Points (Structured Plan)
Since you prefer clear trading levels, here is a clean buy setup plan.
🟢 1️⃣ Aggressive Buy (Trend Continuation)
Condition: Price holding above short-term support
Entry: 92.534 (on small pullback)
Stop Loss: 91.937
Target 1: 93.70
Target 2: 94.20
Target 3: 94.90
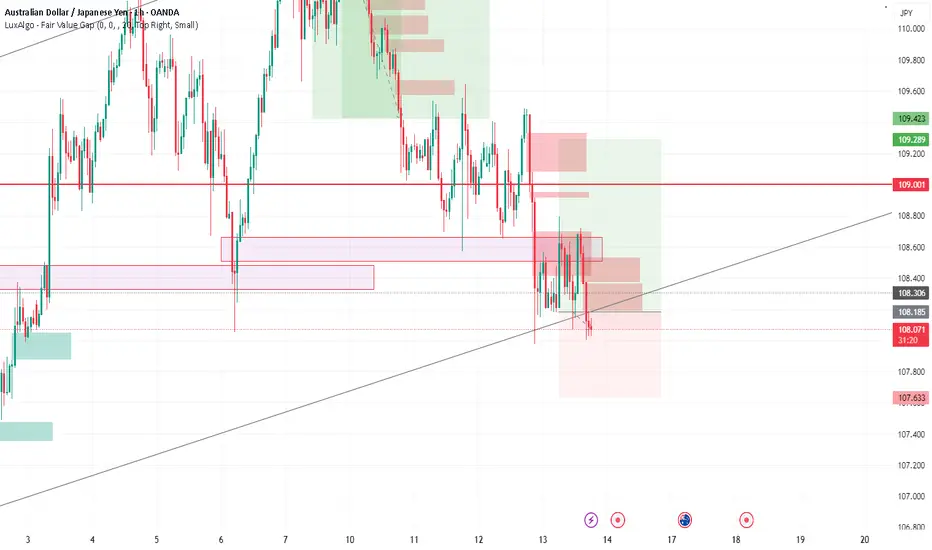
AUDJPY – Bullish Reversal From Trendline SupportAUDJPY is reacting strongly from a major ascending trendline support on the 1H timeframe. Price swept liquidity below the structure, tapped into the demand zone, and immediately rejected — signaling buyer strength.
we entered long around 108.180, which aligns perfectly with the technicals.
📈 Why This Is a Bullish Setup
Price tapped the HTF trendline and respected it
Multiple liquidity sweeps beneath the zone, trapping sellers
Formation of a bullish rejection wick right at support
Price is stil
Multipolar World & Geopolitical Risk Premiums1. What Is a Multipolar World?
A multipolar world refers to an international system in which power is distributed among several major states rather than concentrated in one (unipolar) or two (bipolar) dominant powers. In the 19th century, Europe functioned as a multipolar system with empires such as the United Kingdom, France, Austria-Hungary, Russia, and Prussia balancing one another.
After World War II, the world shifted into a bipolar structure dominated by the United States and the Soviet