Inverted Cup and Handle Market Structure🔎 Overview
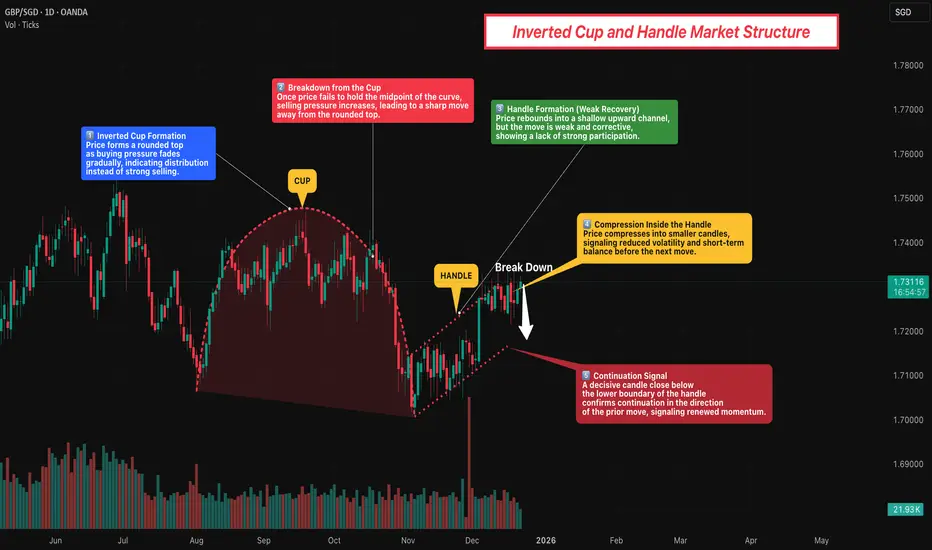
The Inverted Cup and Handle is a price structure that reflects gradual exhaustion after an upward phase, followed by a weak recovery. The pattern highlights a shift from strength to balance and then potential continuation in the direction of the prior decline. It is best viewed as a structure-based setup rather than a prediction tool.
------------------------------------------------------------
📘 Concept
The pattern begins with a rounded top (the inverted cup), where buying pressure slowly fades and distribution takes place.
After the decline from the cup , price attempts a recovery but forms a small upward-sloping channel (the handle). This recovery is corrective in nature and typically lacks strength, signaling hesitation rather than reversal.
------------------------------------------------------------
🧭 How to Use
• Validation → Successive candle closes below the lower boundary of the handle confirm the pattern.
• Devalidation → Candle closes above the upper boundary of the handle invalidate the structure and negate the setup.
------------------------------------------------------------
📊 Chart Explanation
1️⃣ Inverted Cup Formation
Price forms a rounded top as buying pressure gradually weakens, indicating distribution instead of aggressive selling.
2️⃣ Decline from the Cup
Once price fails to hold higher levels, momentum shifts and price moves away from the rounded structure.
3️⃣ Handle Formation
Price rebounds into a shallow upward channel. This move is weak and corrective, showing limited participation.
4️⃣ Compression Inside the Handle
Candles tighten within the handle, reflecting reduced volatility and short-term balance.
5️⃣ Structural Confirmation
A decisive close below the handle boundary signals the end of consolidation and confirms continuation of the prior move.
------------------------------------------------------------
👀 Observation
• Rounded tops often develop slowly and require patience.
• The handle phase represents hesitation, not strength.
• Best clarity comes from waiting for candle-close confirmation rather than early anticipation.
------------------------------------------------------------
📝 Summary
• Rounded top shows fading buying pressure
• Handle reflects weak, corrective recovery
• Compression signals indecision
• Validation occurs only after boundary acceptance
------------------------------------------------------------
⚠️ Disclaimer
📘 For educational purposes only.
🙅 Not SEBI registered.
❌ Not a buy/sell recommendation.
🧠 Purely a learning resource.
📊 Not Financial Advice. EUR/USD – Trap or Trend Continuation?EUR/USD – Trap or Trend Continuation?
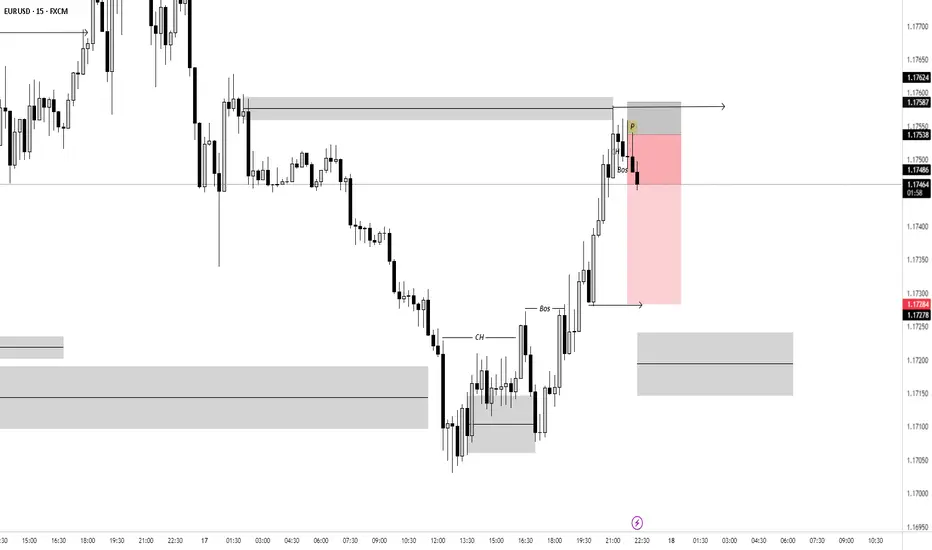
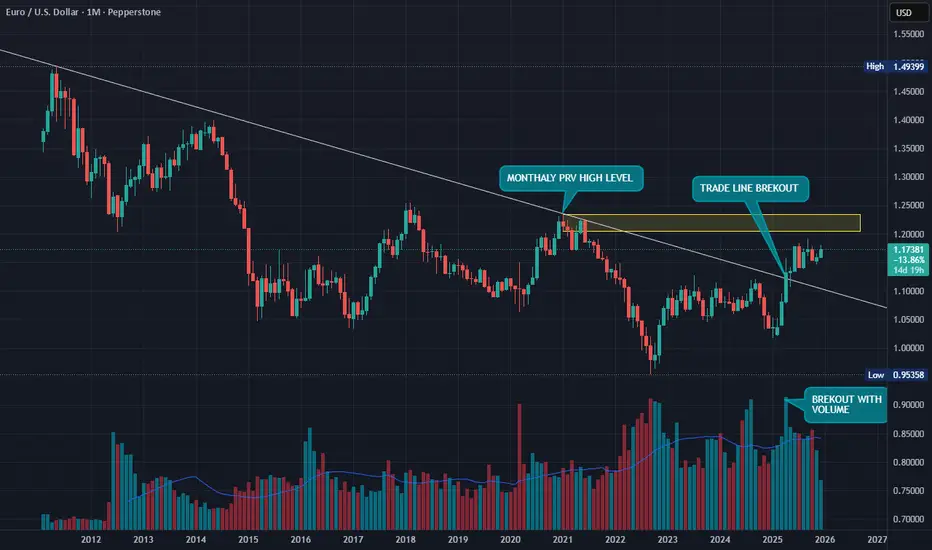
The market has recently transitioned from a strong directional advance into a phase of hesitation and balance. After a sustained upward expansion marked by clear momentum and orderly price progression, buying pressure has begun to slow. This slowdown is evident through reduced follow-through, shorter price extensions, and increased overlap between successive price movements.
Current price action reflects a state of consolidation rather than continuation. The market is no longer accelerating higher, but it is also not showing aggressive selling. This suggests that participants who benefited from the prior move are reassessing exposure, while new buyers are less willing to commit at current levels. As a result, price is fluctuating within a relatively narrow range, indicating temporary equilibrium between demand and supply.
Attempts to push higher have been met with limited acceptance, hinting at exhaustion in the recent upward move. Momentum appears to be waning, and price behavior shows signs of distribution, where activity becomes choppy and directional conviction weakens. This phase often precedes either a corrective move or a renewed expansion, depending on which side regains control.
If downside pressure increases, price is likely to seek lower valuation areas where participation previously increased. Such a move would be considered a corrective adjustment within the broader context of the prior advance rather than an outright reversal, unless selling becomes impulsive and sustained. Conversely, if buyers regain confidence and price is accepted above the recent consolidation zone, the market could resume its prior expansion with renewed strength.
Overall, the market is at an inflection point. The dominant move that brought price to current levels has lost momentum, and the next meaningful direction will depend on whether balance resolves in favor of continuation or correction. Patience is warranted until price demonstrates clear acceptance in one direction, as trading during this phase carries elevated risk of false moves. Mid-Cap TradingUnlocking Multi-Bagger Moves Through Strategy, Patience, and Discipline
Mid-cap trading has long been regarded as the sweet spot for investors and traders seeking multi-bagger returns—stocks that can grow two, three, five, or even ten times over a period of time. Positioned between large, stable blue-chip companies and highly volatile small-cap stocks, mid-cap companies offer a unique balance of growth potential and relative stability. When approached with the right framework, mid-cap trading can become one of the most powerful wealth-creation strategies in the equity market.
Understanding Mid-Caps and Their Multi-Bagger Potential
Mid-cap stocks typically belong to companies with a market capitalization that reflects a business in transition. These firms have already proven their business models, survived early-stage risks, and built a customer base, yet they are still far from saturation. This stage of corporate life is crucial because earnings growth can accelerate rapidly when market share expands, operating leverage kicks in, and new business segments mature.
Multi-bagger moves often emerge when a mid-cap company transitions into a large-cap. During this phase, valuation re-rating plays a critical role. As profits grow consistently, institutional investors begin accumulating the stock, analysts initiate coverage, liquidity improves, and the market starts assigning higher valuation multiples. This combination of earnings growth and multiple expansion is what fuels explosive price appreciation.
Why Mid-Caps Outperform Over Market Cycles
Historically, mid-cap stocks have outperformed large-caps over long market cycles because they combine scalability with innovation. Large companies grow slowly due to size constraints, while small companies face survival risks. Mid-caps sit in the middle—big enough to withstand economic shocks but agile enough to adapt, innovate, and expand aggressively.
Another reason for outperformance is information inefficiency. Many mid-cap companies are under-researched compared to large-caps. This creates opportunities for traders and investors who are willing to dig deeper into financial statements, management commentary, and industry trends. When the broader market eventually recognizes the company’s true potential, prices adjust sharply upward.
Identifying Mid-Caps with Multi-Bagger Potential
Successful mid-cap trading begins with stock selection. Not every mid-cap becomes a multi-bagger, and the key lies in identifying companies with sustainable growth drivers. Strong revenue and profit growth, improving return ratios (ROE and ROCE), manageable debt levels, and positive operating cash flows are foundational traits.
Equally important is management quality. Visionary and ethical leadership with a clear growth roadmap often separates average performers from extraordinary ones. Companies expanding capacity, entering new markets, launching innovative products, or benefiting from sectoral tailwinds tend to deliver outsized returns.
Sector trends also matter. Mid-caps operating in sunrise industries—such as renewable energy, specialty chemicals, defense manufacturing, digital infrastructure, healthcare, and niche financial services—often enjoy long growth runways. When company-specific execution aligns with favorable macro and sectoral trends, multi-bagger potential increases significantly.
Technical Timing in Mid-Cap Trading
While fundamentals identify what to buy, technical analysis helps decide when to buy. Mid-cap stocks often move in strong momentum phases punctuated by periods of consolidation. Breakouts from long bases, volume expansion, higher-high and higher-low structures, and relative strength versus benchmark indices are classic technical signs of an emerging multi-bagger.
Because mid-caps can be volatile, risk management is crucial. Traders often scale into positions rather than investing all at once, adding exposure as the trend confirms itself. Using trailing stop-losses protects capital while allowing profits to run—an essential principle in capturing large moves.
Holding Through Volatility: The Psychological Edge
One of the biggest challenges in mid-cap trading is holding onto winners. Multi-bagger stocks rarely move in a straight line. They experience corrections, profit-booking phases, and market-wide drawdowns. Weak hands exit early, while disciplined traders use volatility as a filter rather than a trigger to panic.
Emotional control plays a decisive role. Fear during corrections and greed during rallies can derail even the best analysis. Successful mid-cap traders develop the patience to hold quality stocks through temporary noise, focusing instead on long-term business performance and trend structure.
The Role of Institutions and Liquidity
A key phase in a mid-cap’s journey toward becoming a multi-bagger is institutional participation. As mutual funds, insurance companies, and foreign investors accumulate shares, liquidity improves and price movements become more directional. Tracking shareholding patterns and volume behavior can offer valuable clues about smart money involvement.
However, traders must also remain cautious. Overcrowded mid-cap trades can lead to sharp corrections if growth expectations fail to materialize. Continuous monitoring of earnings consistency and guidance is essential to avoid value traps.
Risk Management and Capital Allocation
Mid-cap trading is not about betting everything on a single idea. Diversification across sectors and themes helps reduce portfolio risk. Position sizing based on volatility and conviction ensures that no single stock can cause irreversible damage to capital.
Equally important is knowing when to exit. If fundamentals deteriorate, growth slows significantly, or the technical trend breaks decisively, disciplined exits preserve capital for better opportunities. Multi-bagger investing is as much about avoiding permanent losses as it is about chasing big gains.
Conclusion: Mid-Caps as Engines of Wealth Creation
Mid-cap trading offers one of the most compelling paths to multi-bagger returns in equity markets. It blends growth, opportunity, and manageable risk when approached with a structured process. By combining strong fundamental analysis, precise technical timing, sound risk management, and psychological discipline, traders can position themselves to capture extraordinary moves.
In essence, mid-cap multi-baggers are not found by chance—they are identified early, accumulated patiently, and held with conviction. For those willing to do the work and stay committed through market cycles, mid-cap trading can transform capital growth from incremental to exponential. Small-Cap Trading PotentialsUnlocking High-Growth Opportunities with Calculated Risk
Small-cap trading refers to investing or trading in companies with relatively smaller market capitalization compared to large-cap and mid-cap stocks. In the Indian equity market, small-cap companies typically have a market capitalization below the top 250 listed companies. These stocks often operate in niche segments, emerging industries, or early growth phases, making them attractive for traders and investors seeking higher returns. However, small-cap trading is not just about chasing quick profits—it requires discipline, research, and a clear understanding of risk.
Why Small-Cap Stocks Offer High Potential
The primary appeal of small-cap stocks lies in their growth potential. Unlike large-cap companies that are already well-established and grow steadily, small-cap firms are still expanding their business models, market reach, and revenue streams. Even a moderate improvement in earnings, market share, or management efficiency can lead to sharp price appreciation. This asymmetric return potential—where upside can be significant compared to invested capital—is what attracts traders to small caps.
Small-cap stocks also benefit from lower institutional coverage. Many of these companies are under-researched, which creates pricing inefficiencies. Skilled traders who can identify strong fundamentals early may enter before institutional investors, mutual funds, or foreign investors step in. Once big money flows into a fundamentally strong small-cap stock, price movement can be fast and substantial.
Volatility: A Double-Edged Sword
Volatility is a defining characteristic of small-cap trading. Due to lower liquidity and fewer market participants, small-cap stocks tend to move sharply in both directions. News events, quarterly results, management commentary, or even rumors can cause significant price swings. For traders, this volatility creates opportunity, but it also increases risk.
Sharp corrections are common in small-cap stocks, especially during market-wide risk-off phases. When broader indices fall or global uncertainty rises, small caps are usually the first to face heavy selling. Therefore, traders must respect stop-losses and position sizing. Volatility rewards preparation but punishes emotional decision-making.
Liquidity and Volume Considerations
Liquidity is a critical factor in small-cap trading. Unlike large-cap stocks, where thousands of shares can be traded instantly, small caps may have limited daily volumes. This can result in higher bid-ask spreads and slippage during entry and exit. Traders should always analyze average daily volume before entering a position.
Stocks with improving volume trends are particularly attractive. Rising volume often signals growing interest and accumulation. A price breakout supported by strong volume is generally more reliable than a low-volume move. Liquidity management ensures that profits remain real and executable, not just theoretical.
Fundamental Triggers That Drive Small-Cap Rallies
Small-cap stocks often rally due to specific triggers rather than broad market trends. Earnings growth, debt reduction, capacity expansion, new product launches, regulatory approvals, government contracts, or sectoral tailwinds can act as powerful catalysts. Because the base size of these companies is small, even limited positive developments can significantly impact valuations.
Management quality also plays a crucial role. Transparent communication, ethical governance, and consistent execution build long-term confidence. Traders who track promoter holding patterns, pledging status, and insider activity gain valuable insights into the company’s future direction.
Technical Analysis in Small-Cap Trading
Technical analysis is especially effective in small-cap trading due to strong momentum phases. Breakouts from long consolidation ranges, trendline breakouts, moving average crossovers, and volume expansion are common setups. Many small-cap stocks move in clear impulsive waves, making them suitable for swing and positional trading.
However, false breakouts are also frequent. To avoid traps, traders should wait for confirmation—such as a strong close above resistance or follow-through buying in subsequent sessions. Combining technical patterns with fundamental strength improves the probability of success.
Risk Management: The Core of Sustainable Profits
The biggest mistake traders make in small-cap stocks is overexposure. Because prices are lower, traders often buy larger quantities, underestimating risk. Position sizing should always be based on risk per trade, not on price comfort. A strict stop-loss policy is non-negotiable.
Diversification within small caps is also important. Concentrating capital in one or two stocks increases downside risk. Allocating capital across multiple setups reduces the impact of any single failure. Successful small-cap trading is less about predicting every winner and more about controlling losses when trades go wrong.
Market Cycles and Small-Cap Performance
Small-cap stocks perform best during bullish and risk-on market phases. When liquidity is abundant and investor confidence is high, money flows from large caps to mid and small caps in search of higher returns. This phase often leads to broad-based rallies across the small-cap universe.
During bearish or sideways markets, small caps tend to underperform. In such conditions, only fundamentally strong companies with earnings visibility sustain momentum. Understanding market cycles helps traders decide when to be aggressive and when to be defensive in small-cap trading.
Psychology and Discipline in Small-Cap Trading
Emotional control is essential. Rapid price movements can trigger greed during rallies and fear during corrections. Traders must avoid chasing stocks after extended runs and resist panic selling during temporary pullbacks. A predefined trading plan—covering entry, exit, and risk—keeps emotions in check.
Patience is another key psychological trait. Not every day offers a high-quality small-cap opportunity. Waiting for clear setups and strong confirmations separates professional traders from impulsive participants.
Conclusion: Balancing Opportunity and Risk
Small-cap trading offers immense potential for wealth creation, but it is not suitable for careless or uninformed participants. The combination of high growth potential, volatility, and limited liquidity demands a structured approach. Traders who combine solid fundamental analysis, disciplined technical execution, strict risk management, and emotional control can consistently benefit from small-cap opportunities.
In essence, small-cap trading is about identifying quality early, managing risk intelligently, and allowing growth stories to unfold. When approached with patience and discipline, small-cap stocks can become one of the most rewarding segments of the equity market. Two Powerful Approaches to Understanding Financial MarketsTechnical Analysis vs Fundamental Analysis
In the world of trading and investing, decision-making is driven by analysis. Among the many methods available, technical analysis and fundamental analysis stand out as the two most widely used and debated approaches. Both aim to identify profitable opportunities in financial markets, yet they differ significantly in philosophy, tools, time horizon, and interpretation of market behavior. Understanding the strengths, limitations, and appropriate use of each method is essential for traders and investors seeking consistency and clarity in their strategies.
Understanding Technical Analysis
Technical analysis is the study of price movements, volume, and market patterns to forecast future price behavior. It is based on the belief that all available information—economic, political, and psychological—is already reflected in the price. Therefore, instead of focusing on why a price moves, technical analysts focus on how it moves.
At its core, technical analysis relies on charts and indicators. Traders examine historical price data to identify trends, support and resistance levels, chart patterns, and momentum signals. Common tools include moving averages, Relative Strength Index (RSI), MACD, Bollinger Bands, Fibonacci retracements, and candlestick patterns.
One of the foundational principles of technical analysis is that price trends tend to repeat due to human psychology. Fear, greed, hope, and panic create recognizable patterns over time. For example, breakouts, pullbacks, and reversals often occur in similar ways across different markets and time frames.
Technical analysis is especially popular among short-term traders, such as intraday traders, scalpers, and swing traders. These participants need precise entry and exit points, which technical tools provide. Since technical analysis can be applied to any tradable instrument—stocks, forex, commodities, cryptocurrencies, or indices—it is highly versatile.
However, technical analysis has limitations. Indicators are often derived from past prices, which means they can lag in fast-moving markets. False breakouts and whipsaws can lead to losses if risk management is poor. Additionally, technical analysis does not directly account for major fundamental events such as earnings surprises, policy changes, or geopolitical shocks.
Understanding Fundamental Analysis
Fundamental analysis focuses on evaluating the intrinsic value of an asset by examining economic, financial, and qualitative factors. The goal is to determine whether an asset is undervalued, fairly valued, or overvalued compared to its current market price.
In stock markets, fundamental analysis involves studying a company’s financial statements, including revenue, profit, cash flow, debt, and margins. Key metrics such as earnings per share (EPS), price-to-earnings (P/E) ratio, return on equity (ROE), and growth rates play a crucial role. Beyond numbers, analysts also assess management quality, competitive advantage, industry position, and long-term business sustainability.
In other markets, such as forex or commodities, fundamental analysis revolves around macroeconomic indicators. Interest rates, inflation, GDP growth, trade balances, central bank policies, and global supply-demand dynamics are central to valuation.
Fundamental analysis is most commonly used by long-term investors and positional traders. These market participants believe that, over time, prices will converge toward intrinsic value. For example, an investor may buy shares of a fundamentally strong company during temporary market weakness and hold them for years.
The strength of fundamental analysis lies in its ability to identify long-term wealth creation opportunities. It helps investors stay aligned with economic reality and business performance rather than short-term market noise.
However, fundamental analysis also has drawbacks. Markets can remain irrational longer than expected, meaning undervalued assets may stay undervalued for extended periods. Fundamental data is often released quarterly or monthly, making it less useful for short-term timing. Additionally, interpreting fundamentals requires assumptions about future growth, which may not always materialize.
Key Differences Between Technical and Fundamental Analysis
The most important difference between the two approaches lies in their focus. Technical analysis focuses on price behavior and market action, while fundamental analysis focuses on underlying value and financial strength.
Another major distinction is time horizon. Technical analysis is generally used for short- to medium-term trades, whereas fundamental analysis is better suited for medium- to long-term investments.
The data used also differs. Technical analysts rely on charts, indicators, and price history, while fundamental analysts study financial statements, economic reports, and industry trends.
In terms of decision-making, technical analysis emphasizes timing—when to enter and exit—while fundamental analysis emphasizes selection—what to buy or sell.
Which Is Better: Technical or Fundamental Analysis?
The debate over which approach is superior has existed for decades, but the reality is that neither is universally better. Their effectiveness depends on the trader’s goals, personality, and market conditions.
Short-term traders often prefer technical analysis because price movements and momentum matter more than long-term value in the near term. Long-term investors tend to rely on fundamental analysis because business performance and economic growth drive returns over time.
Many successful market participants adopt a hybrid approach, combining both methods. For example, an investor may use fundamental analysis to identify strong companies and then apply technical analysis to time entries and exits. This combination helps align value with market timing, reducing risk and improving consistency.
Conclusion
Technical analysis and fundamental analysis represent two different lenses through which financial markets can be understood. Technical analysis interprets market behavior through price and patterns, making it ideal for timing and short-term strategies. Fundamental analysis evaluates intrinsic value and economic strength, making it essential for long-term investment decisions.
Rather than viewing them as opposing philosophies, traders and investors should see them as complementary tools. Mastering both provides a deeper, more balanced understanding of markets, enabling better decisions across different market phases. In a complex and ever-changing financial world, the ability to adapt and integrate multiple perspectives is often the true edge. USDJPY – Potential for a Volatile End to the WeekIt’s the last full trading week of the year before the Christmas break but that doesn’t necessarily mean that FX markets will be quiet. The calendar is still packed full of important risk events, and when combined with the possibility for decreasing levels of liquidity into Friday’s close it could be a recipe for volatility.
Take USDJPY for example. It has already been the biggest mover in the G7 currency space with its fall from opening levels at 155.80 on Monday down to a low of 154.68 so far this morning and the key risk events are still to come. These events take the form of US Non-farm Payrolls later today (1330 GMT), US CPI on Thursday (1330 GMT) and then the Bank of Japan interest rate decision (0300 GMT) and press conference (0630 GMT) on Friday.
Traders have been eagerly awaiting today’s latest US payrolls release which could impact the direction of the US Dollar in the short term. A weaker US labour market reading may increase the chances for a Federal Reserve interest rate cut in the first quarter of 2026, which could weigh on USDJPY prices, while a stronger number could see USDJPY strengthen.
Similarly, the direction of US inflation on Thursday could be important as some Fed policymakers have signalled they are uncomfortable with prices rising consistently above the US central bank’s 2% target. A higher-than-expected CPI reading could see US bond yields rise, taking USDJPY higher, while a weaker number could see USDJPY come under pressure as the focus shifts to the Bank of Japan rate decision on Friday morning.
At this meeting, the Japanese central bank is expected to raise interest rates by 25bps (around 90% probability), so anything else would be a shock that may lead to a nasty spike in USDJPY volatility. The comments of Governor Ueda in the press conference could also be important depending on what hints he gives about the potential for further rate hikes through 2026.
That’s it, and yes, I know, a lot to take in and prepare for! Looking at the charts, USDJPY has been in a 270-point trading range between 154.30-157.00 for the last month and there could be potential for that to change.
With that in mind, lets assess the technical outlook.
Technical Update: Are Further Corrective Themes Emerging?
The USDJPY rally from the 154.34 December 5th low to the 156.96 December 9th high was impressive, yet subsequent price action may be suggesting a slowing in upside momentum, even further price weakness.
A key concern for traders may be that the December 9th high remained well below the November 20th extreme at 157.89, reinforcing caution regarding near‑term price activity.
The risk is that this activity represents a ‘weak test’ of the 157.89 price high. In other words, while previous moves higher were accompanied by buying support strong enough to break and close above prior highs and resistance levels, this time the market has been unable to do so, raising concerns over the sustainability of upside momentum.
Traders may now question whether recent price activity signals a slowing of upside momentum and the potential for a phase of weakness. Much may depend on future sentiment once the outcome of the key risk events is known, making it prudent to remain aware of the key support and resistance levels as key reference points in the days ahead.
If Price Weakness is to Materialise:
It may still be argued that activity since the November 20th high reflects a phase of price consolidation within the longer‑term uptrend. Therefore, the focus may initially turn to the December 5th low at 154.34 as the first key support level.
Closing breaks below 154.34 could suggest a developing pattern of lower highs and lower lows, which is the basic definition of a downtrend. Should this occur, risks may then shift toward further price weakness with scope to test lower supports.
As the chart shows, closing breaks below support at 154.34 could see a deeper retracement of the October 1st to November 20th advance. If this is the case, the 38.2% level at 153.16 may be tested, with scope for extension towards the 50% retracement at 151.70.
If Support Holds and Price Strength Develops:
Of course, the 154.34 December 5th low support may yet hold and allow fresh price strength to develop. In that case, the focus may then turn to 156.01, the current level of the Bollinger mid‑average, as the first resistance. Closing breaks above 156.01 might now be required to open scope for higher levels
A confirmed break above 156.01 in USDJPY could trigger further upside pressure, with 156.96, the December 9th high, emerging as the next resistance. Should this level also give way, upside potential may extend toward 157.89, the November 20th high
The material provided here has not been prepared accordance with legal requirements designed to promote the independence of investment research and as such is considered to be a marketing communication. Whilst it is not subject to any prohibition on dealing ahead of the dissemination of investment research, we will not seek to take any advantage before providing it to our clients.
Pepperstone doesn’t represent that the material provided here is accurate, current or complete, and therefore shouldn’t be relied upon as such. The information, whether from a third party or not, isn’t to be considered as a recommendation; or an offer to buy or sell; or the solicitation of an offer to buy or sell any security, financial product or instrument; or to participate in any particular trading strategy. It does not take into account readers’ financial situation or investment objectives. We advise any readers of this content to seek their own advice. Without the approval of Pepperstone, reproduction or redistribution of this information isn’t permitted.
Introduction to Derivatives and Options1. Derivatives Trading Strategies
Derivatives can be traded using a variety of strategies depending on market expectations, risk tolerance, and investment objectives.
A. Hedging Strategies
Hedging is a risk management technique used to protect against adverse price movements in the underlying asset.
Futures Hedging:
A trader holding a physical asset (like wheat, crude oil, or shares) can hedge by taking a futures position in the opposite direction. For example, a farmer expecting to sell wheat in three months can sell wheat futures now to lock in the price, reducing the risk of price decline.
Portfolio Hedging with Index Futures:
Institutional investors can hedge against market-wide risk using index futures. For instance, holding a portfolio of Nifty 50 stocks, an investor may sell Nifty futures to protect against a market downturn.
Interest Rate Hedging with Swaps:
Companies with floating-rate loans may use interest rate swaps to exchange variable payments for fixed payments, thus reducing exposure to interest rate fluctuations.
B. Speculative Strategies
Speculators use derivatives to profit from price movements in underlying assets without necessarily owning them.
Long and Short Futures:
Traders can go long (buy) if they expect prices to rise or short (sell) if they expect prices to fall. For example, a trader anticipating a rise in crude oil prices buys crude futures to benefit from price appreciation.
Spread Trading:
Spread strategies involve taking offsetting positions in related derivatives to profit from relative price movements. Common spreads include:
Calendar spreads: Buying a long-dated contract while selling a short-dated contract.
Inter-commodity spreads: Trading price differences between related commodities, like gold vs. silver.
Leverage and Margin Trading:
Derivatives often allow high leverage, enabling traders to control large positions with smaller capital. While leverage increases profit potential, it also amplifies risk.
C. Arbitrage Strategies
Arbitrage exploits price inefficiencies between markets or instruments to earn risk-free or low-risk profits.
Cash-and-Carry Arbitrage:
Traders buy the underlying asset and sell futures simultaneously if futures are overpriced relative to spot prices.
Index Arbitrage:
Exploits differences between index futures and the actual underlying stocks in the index.
Inter-market Arbitrage:
Identifying price discrepancies across different exchanges for the same asset.
2. Option Trading Strategies
Options trading strategies can be divided into basic strategies for beginners and advanced strategies for professional traders.
A. Basic Option Strategies
Long Call:
Buy a call option expecting the underlying asset to rise.
Risk: Limited to premium paid.
Reward: Unlimited potential profit.
Long Put:
Buy a put option expecting the underlying asset to fall.
Risk: Limited to premium paid.
Reward: Gains increase as the asset price declines.
Covered Call:
Holding the underlying stock and selling a call option on it.
Objective: Earn premium income while holding the stock.
Risk: Stock may rise above strike price; profit is capped.
Protective Put:
Buy a put option while holding the underlying asset.
Objective: Insure against a price drop.
Cost: Premium paid for the put.
B. Advanced Option Strategies
Spreads
Spreads involve buying and selling options of the same type (calls or puts) with different strike prices or expirations to limit risk and optimize returns.
Bull Call Spread:
Buy a call at a lower strike and sell a call at a higher strike.
Profitable if the underlying price rises moderately.
Lower cost than a simple long call.
Bear Put Spread:
Buy a put at a higher strike and sell a put at a lower strike.
Profitable if the underlying price falls moderately.
Calendar Spread:
Buy a long-term option and sell a short-term option at the same strike.
Profits from time decay differences.
Straddles and Strangles
These are volatility strategies designed to profit from significant price movements, regardless of direction.
Straddle:
Buy both a call and put at the same strike price.
Profitable if the asset moves sharply up or down.
Strangle:
Buy a call and put with different strike prices.
Cheaper than straddle but requires larger price movement for profit.
Butterfly and Condor Spreads
Butterfly Spread: Combines buying and selling multiple options to profit from minimal price movement.
Iron Condor: Uses both call and put spreads to generate income in low-volatility markets.
Synthetic Positions
Synthetic Long Stock: Buy a call and sell a put at the same strike.
Synthetic Short Stock: Sell a call and buy a put.
Purpose: Mimics stock positions using options, often at lower capital outlay.
3. Risk Management in Derivatives and Options Trading
Risk management is crucial in derivatives trading due to leverage and market volatility.
Stop Loss Orders: Automate exits to limit losses.
Position Sizing: Control exposure relative to capital.
Hedging: Use options or futures to reduce risk on existing positions.
Volatility Assessment: Traders must evaluate implied volatility for option pricing and strategy selection.
4. Practical Applications
Institutional Investors: Use derivatives for hedging portfolios, managing interest rate risk, and currency exposure.
Retail Traders: Utilize options strategies for speculative bets, income generation, and hedging personal investments.
Corporate Usage: Companies hedge commodity prices, interest rates, and foreign currency exposure to stabilize cash flows.
Conclusion
Derivatives and options trading strategies offer a wide array of tools for hedging, speculation, arbitrage, and income generation. While derivatives provide leverage and flexibility, options add non-linear payoff structures that can be tailored for risk and return preferences.
Understanding each strategy, market conditions, and risk-reward dynamics is critical for successful trading. Beginners should start with basic strategies and limited exposure, while advanced traders can explore complex spreads and volatility trades to maximize returns and manage risk effectively.

 Education