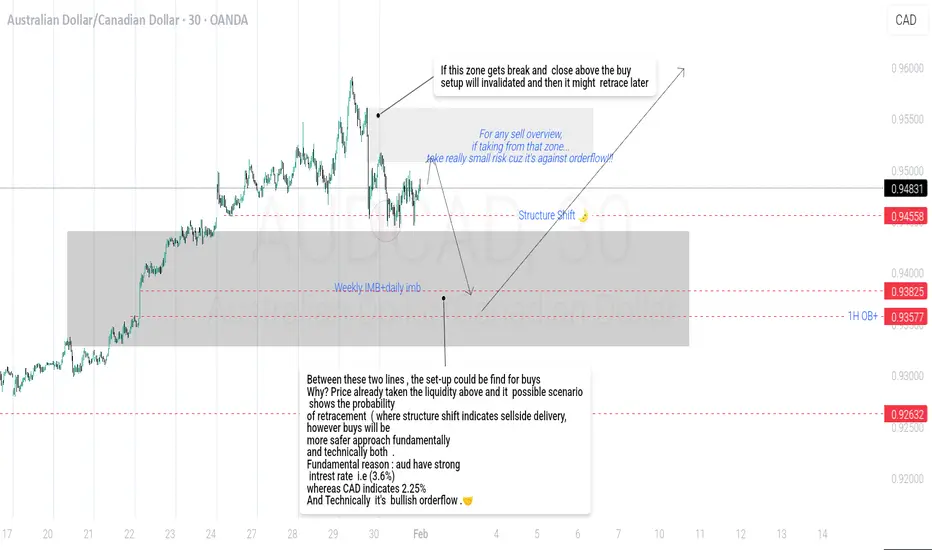
Expecting audcad sell delivery for buy setupsBetween these two red lines inside weekly+daily imb, the set-up could be find for buys
Why? Price already taken the liquidity above and it possible scenario
shows the probability
of retracement ( where structure shift indicates sellside delivery,
however buys will be
more safer approach fundamentally
and technically both .
Fundamental reason : aud have strong
intrest rate i.e (3.6%)
whereas CAD indicates 2.25%
And Technically it's bullish orderflow .🤝
Forex market
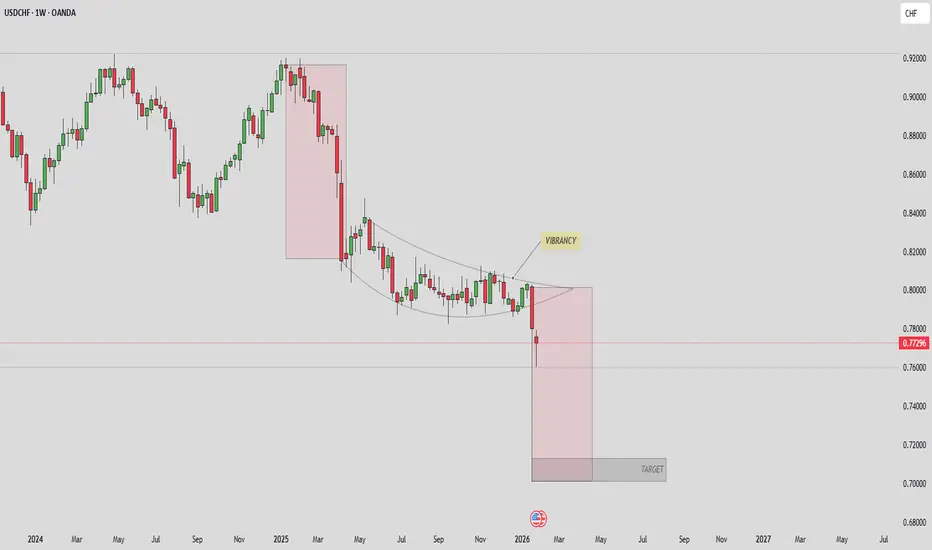
USDCHF 1W T/F ANALYSIS---
USDCHF 1w t/f analysis----
📊 Market Structure Explanation (usdchf – 1w):-
Centeral structure are a vibrancy (Explanation of Vibrancy structure > this structure are first volume contraction and bended both side also then empulsive move and break it`s self ) \
now this condition breakdown it`s self so we can measure structure of previous marked supply and past on breakdown of top candle so now we have a clear down side direction and we have a buyesh
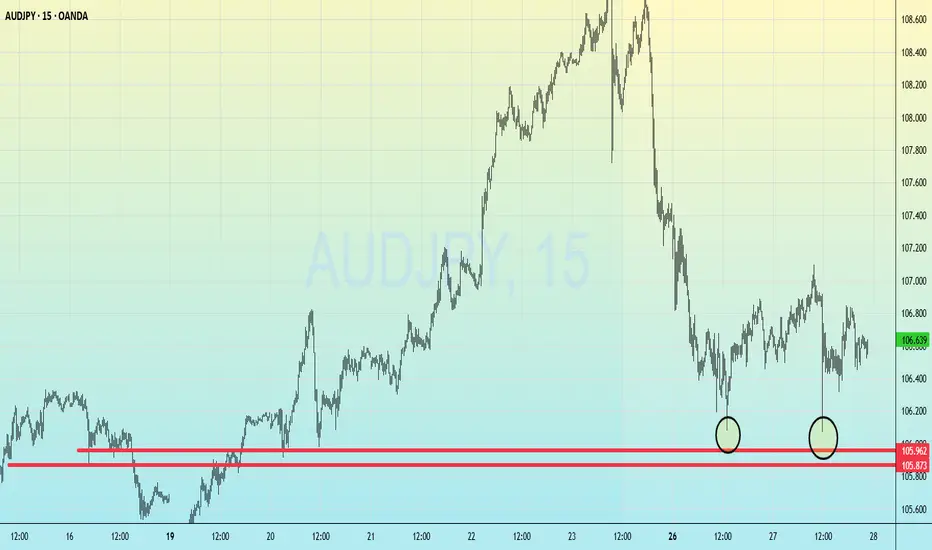
AUDJPY : Bulls Defending the Line 106.60 !AUDJPY has undergone a significant correction, sliding from the 109.00 peak down to the 106.20 region. However, the bears have hit a massive roadblock. We are currently seeing a strong reaction from a historical demand zone (105.80 – 106.00), marked by the clear rejections in the shaded circles on the chart.
🔍 The Critical Battleground: 106.00 – 106.60
The price is currently hovering around 106.57. This "buffer zone" between current levels and the demand floor is make-or-break for the next majo
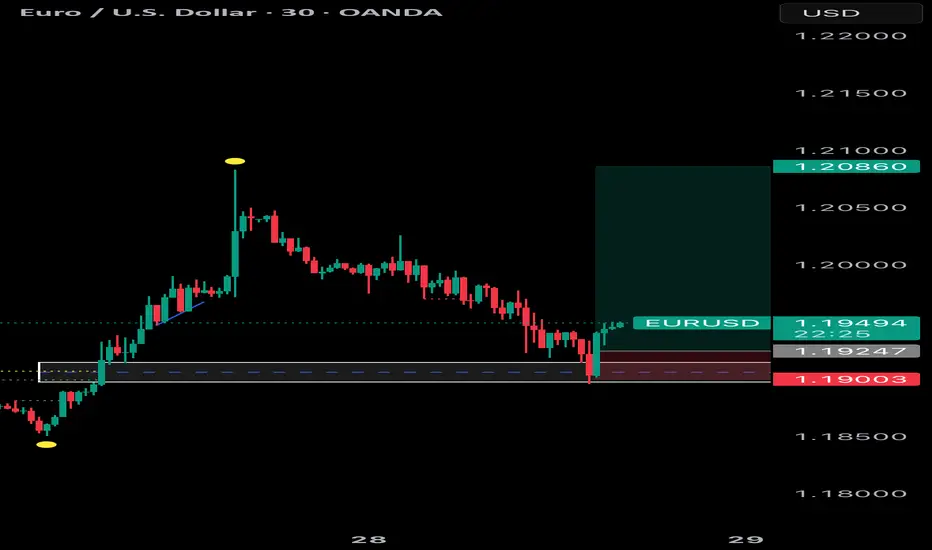
EURUSD 2H CHART EUR/USD Long Setup
Entry Zone: After price touches the bullish order block (OB) and shows rejection/reversal signals.
Direction: Long
Invalidation Level: Below the order block low.
Target: Next higher structure high (or previous swing high / liquidity zone above).
Rationale: Price is expected to respect the order block as support and continue upward within the prevailing structure.
Bitcoin and Major Cryptocurrency Trends1. Bitcoin (BTC) Trends
Price Volatility: Bitcoin remains highly volatile, with rapid short-term swings influenced by macroeconomic events, regulation, and institutional adoption.
Institutional Adoption: Increasing interest from hedge funds, banks, and corporate treasuries drives long-term bullish sentiment.
Store of Value Narrative: Often called “digital gold,” Bitcoin is increasingly seen as a hedge against inflation, especially in uncertain economic periods.
On-chain Activity: Metrics lik
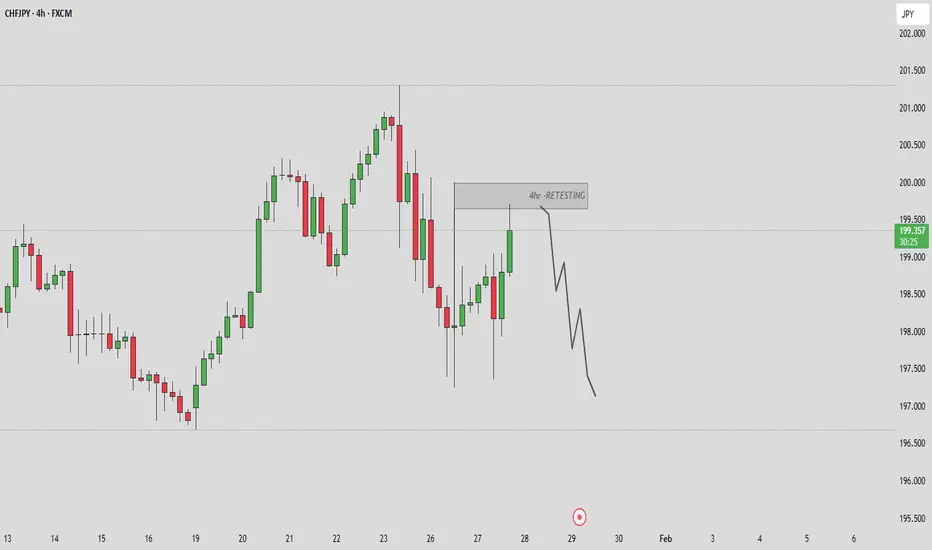
CADJPY 2HR T/F ANALYSIS --- WE NEAD A RETESTING FOR SELL SIDE
📊 Market Structure Explanation (cadjpy – 2hr)
the structure are clear look like a strong bearish formation:- in this selling trend we can se imbalance also and our strong supply of previous demand which are marked clearly into green color they demand copy and past on recent demand bottom to top and now we have a retesting area :-
🔍 What the market can do next:-
Scenario 1 – Pullback / retesting (Needs Confirmation):
For any meaningful retesting to occur, the market must first show clear bear
DAILY FOREX SCAN Session – 20 (28.01.26)Scanning multiple forex pairs to filter high-quality trade setups. No trades are forced—only structure-based opportunities.
Note: There may be a delay in this video due to upload processing time.
Disclaimer: FX trading involves high leverage and substantial risk, and losses can exceed your initial investment. This content is for educational purposes only and should not be considered financial advice. Trade at your own risk.
AUDNZD just touched a sensitive areaThe AUDNZD pair is currently testing a highly sensitive zone that has historically acted as a powerful springboard for price action. We are at a "make or break" junction, watch these levels closely!
1. If the price successfully holds its ground and continues to trade above 1.1565, the historical demand will likely confirm a fresh leg up.
Target: 🎯 1.1620
Sentiment: Strong recovery potential as bulls defend the zone.
2. If the demand fails to hold and we see a slide below 1.1539, the structural
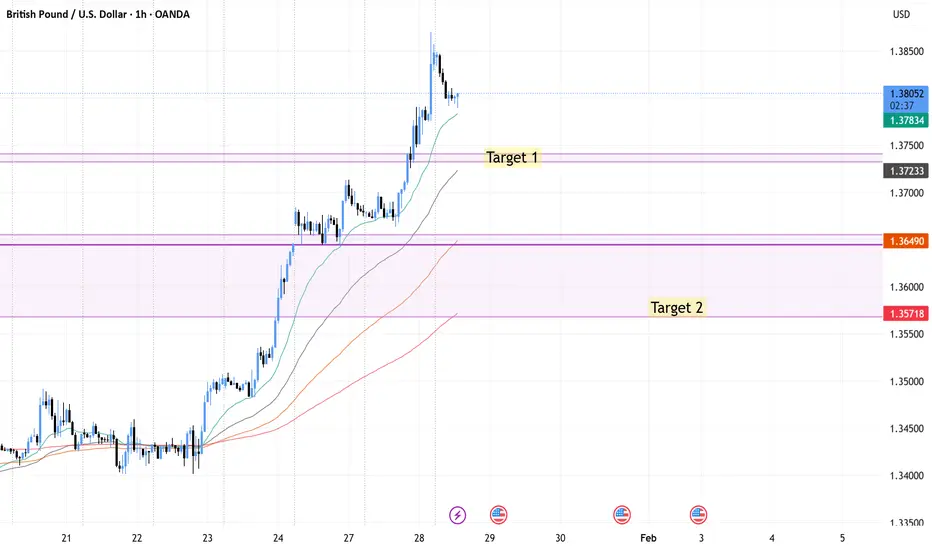
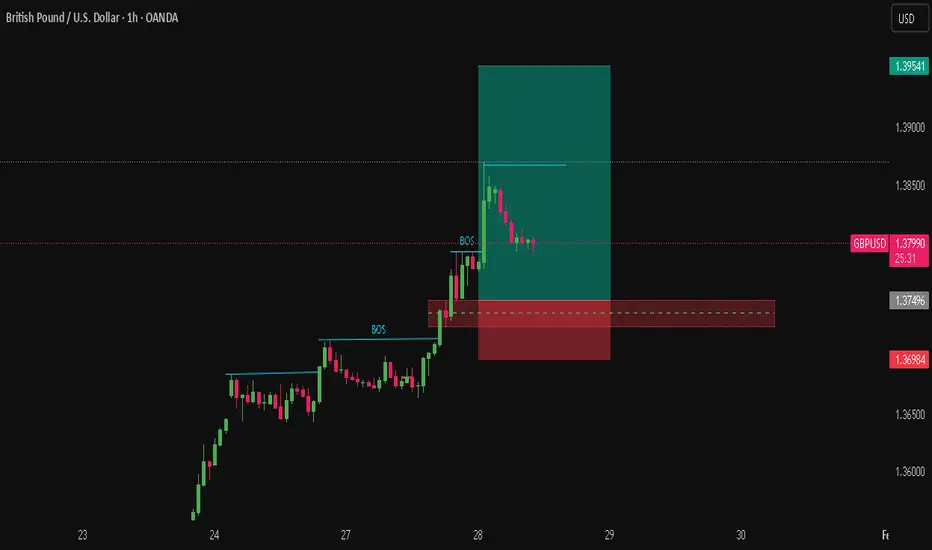
GBPUSD-Retracement Set up.(Not Trend Reversal)
GBPUSD is currently moving bullish, mainly driven by **USD weakness** rather than strong GBP strength.
This move is considered a **retracement**, not a full bearish structure change.
🔹 **Bias:**
➡️ Overall move is corrective
➡️ Bearish continuation only after retracement zones are reached
### 🎯 Key Retracement Zones
**First Retrace Target:**
📍 **1.37240**
**Deep Retrace Zone:**
📍 **1.35726**
### 🧠 Trade Idea Logic
* As long as price stays above retracement zones, market remains **bull
USDCAD at historical demand zoneThe USDCAD pair is currently testing a critical support zone that has historically acted as a trusted base. After a sharp descent, we are seeing signs of life as the price attempts to hold this floor and move higher.
The immediate price action suggests this level is highly decisive for the next major trend. Here are the two primary scenarios to watch:
1. If the current momentum sustains and the base remains intact, the first major target is the overhead resistance at 1.3826.
Continuation: A cle
GBP/AUD: Corrective Rally, Downtrend IntactGBP/AUD is trading in a clear bearish Elliott Wave structure on the 4H timeframe. The market has already completed a strong impulsive decline and is currently moving in a Wave 4 corrective pullback, which is happening inside a downward channel and near key Fibonacci retracement levels. This correction looks weak and corrective, suggesting sellers are still in control. As long as price remains below the invalidation level around 2.0050 , the bearish bias stays valid. The expectation is for the c
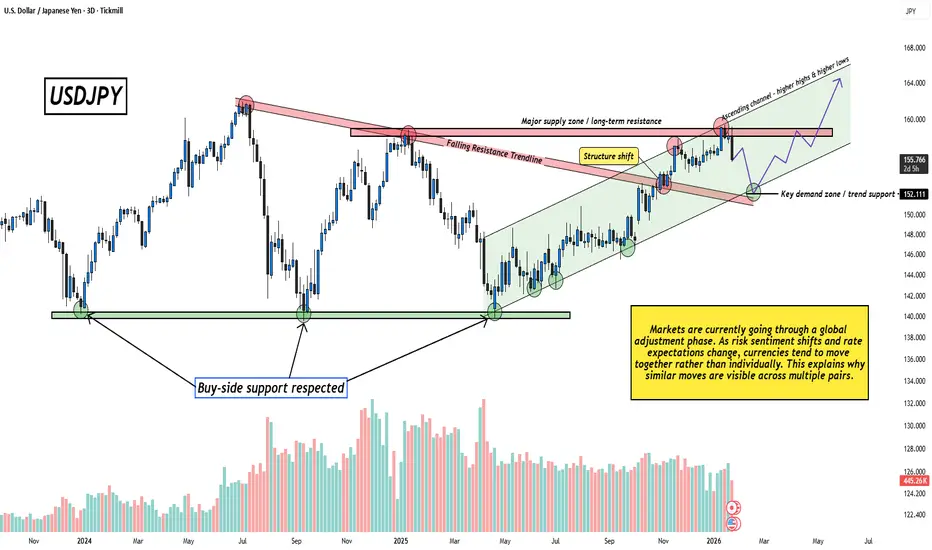
USDJPY – A Global Repricing Phase, Not a Random MoveWhen I look at USDJPY, this move doesn’t feel random to me. It looks like part of a broader global adjustment phase rather than something driven by this pair alone.
Price Context:
Price spent a long time reacting from a major supply zone before showing a clear structure shift. Since then, the market has been respecting an ascending channel, with higher highs and higher lows.
Why this move makes sense:
As global risk sentiment shifts and interest rate expectations change, currencies often m
GBPUSD – Support Holding, Watching Reaction From RangeGBP/USD has reacted from a well-defined support zone, an area where buyers have stepped in multiple times before. Price is currently trading between clear support and resistance, indicating a short-term range environment.
As long as this support holds, upside reactions toward the resistance zone remain possible. A clean break below support, however, would weaken this structure and change the short-term bias.
This is a reaction-based zone, not a prediction. Let price confirm the next move.
Di
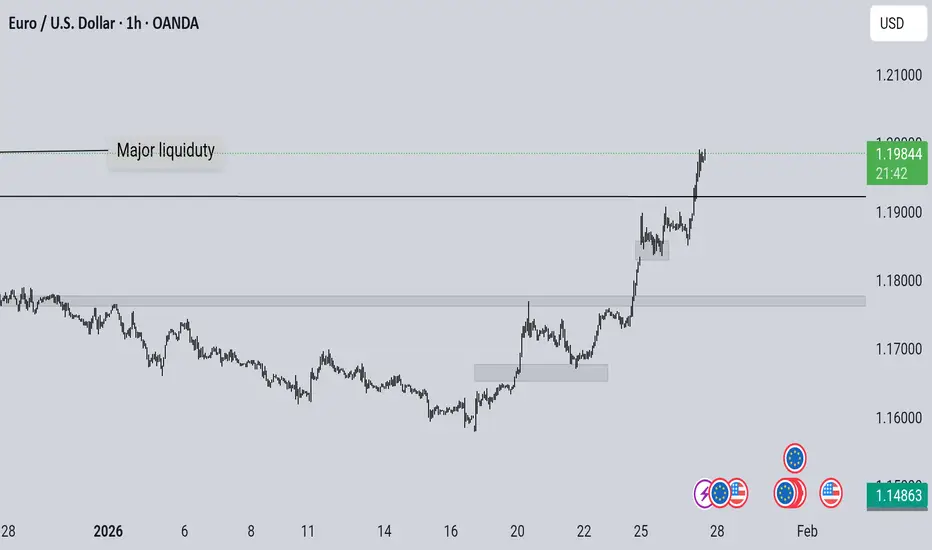
Update on the previous EURUSD bullish setup idea.The price and market is following through almost as we expected , although the price made its new gap and support zone at : "1.18554" and is willing to go to our structural previous daily high at :1.19206.
So far it's still supporting our idea let's see if anything gets different or more precise.