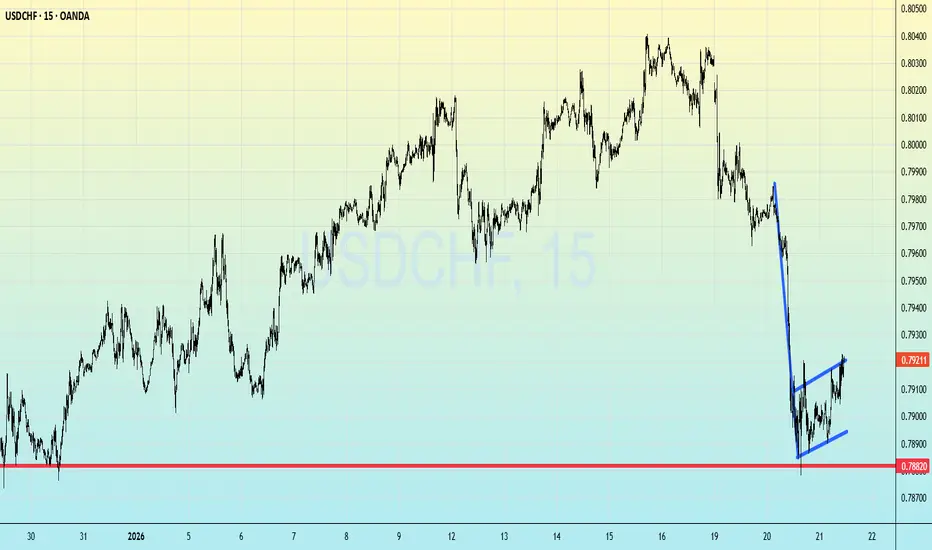
USDCHF trading above Decisive zoneThe USDCHF is currently at a critical "decision zone" after a period of significant volatility. Following a sharp decline earlier this week, price action is now signaling a potential shift in momentum.
1. Key Support Validation
The pair successfully tested a major support zone near 0.7870 – 0.7880. This area is historically significant (acting as a base for major rallies in late 2025) and has once again triggered a strong "buy the dip" response. The rejection at these lows suggests that the bea
Forex market
USDINR at Key Resistance – Break or Rejection?USDINR is currently trading near the upper boundary of a well-defined rising channel — a zone where price has historically faced strong rejection and profit booking.
This rally has been structural, not random. Price has respected the channel multiple times, creating higher highs and higher lows, showing steady demand for dollars over the rupee. However, every strong trend eventually meets a decision zone — and this upper band is one of them.
What makes this level more important is the timing.
USDJPY 4HR T/F ANALYSIS -----
usdjpy 4hr t/f ----- breakdown of curve support which name is black mind curve after breakdown we can measure previous pattern now current scenario previous supply can measure so we can go with trend into down side until supply will not complete /
after supply complete we can see any positive candle on retesting area then we can see demand on retesting then we can go with trend _ remember trend are over all bullish ok ----
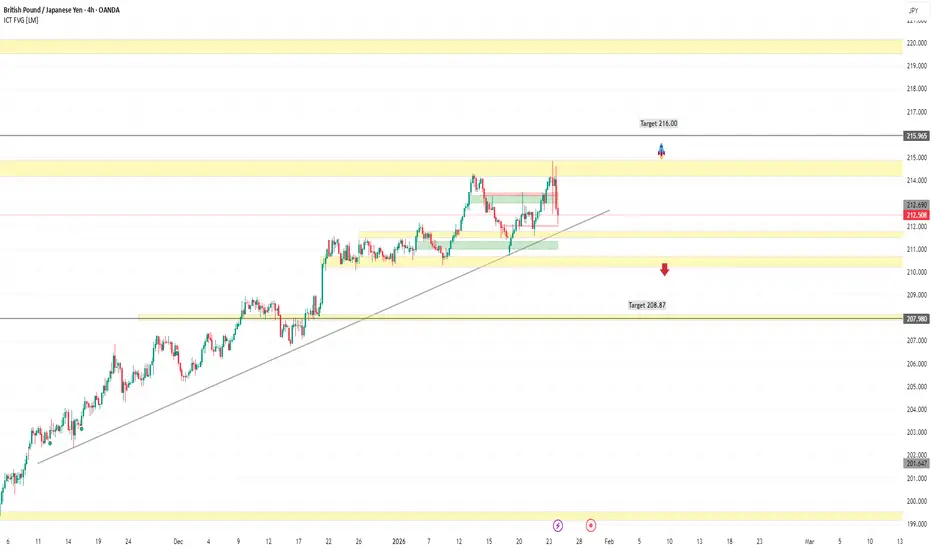
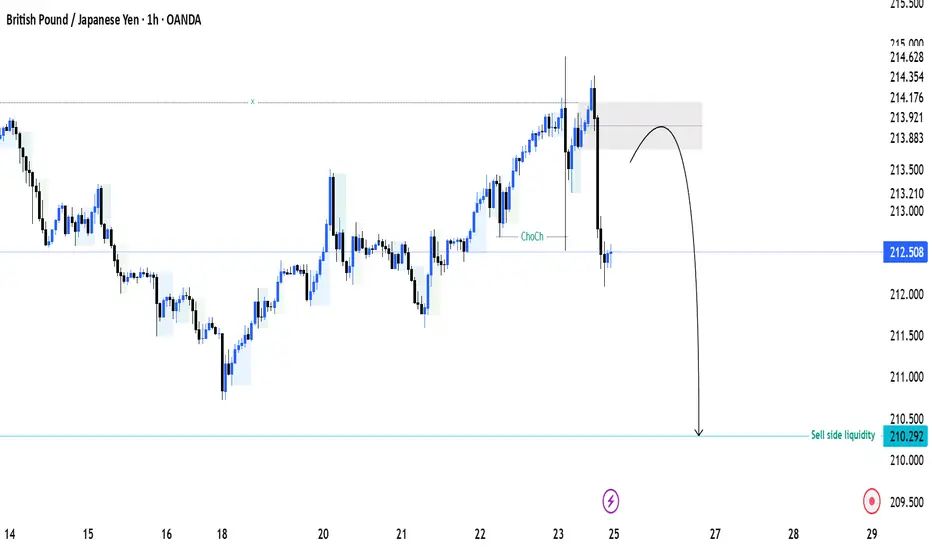
GBPJPY Weekly Outlook: Short Retest Before Bullish Push to 216.0GBPJPY shows strong bullish momentum after recent highs around 213.92, but expect a minor short recovery first. Market likely retests support at 210.44 or deeper to 208.00 before resuming uptrend targeting 216.00 next week. Chart highlights key levels with recent price action from ~210.84 lows.
Key Levels
Support: 210.44 (immediate), 208.00 (stronger retest zone)
Resistance: Recent high ~214, then 216.00 target
Bullish Bias: Above 210.63 for rally continuation
Trade Setup (Next Week)
Wait for d
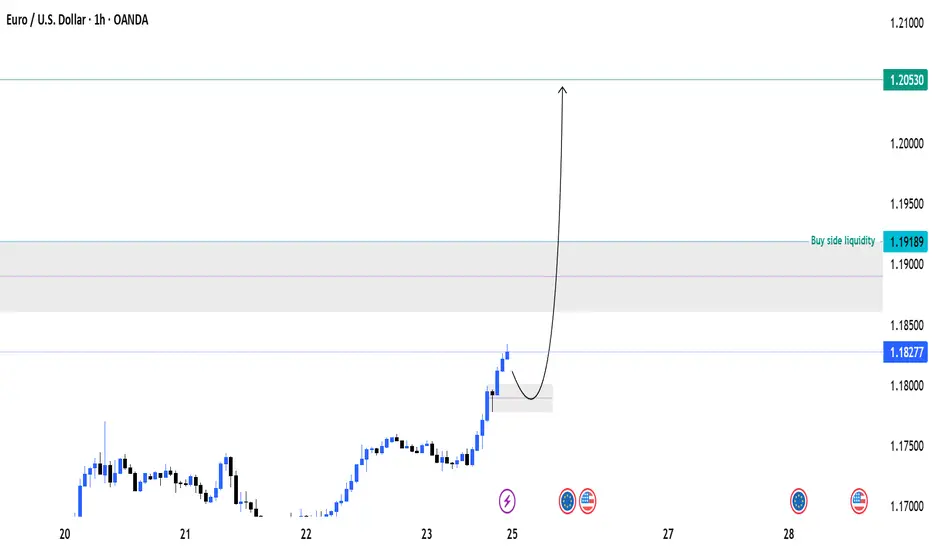
EURUSD HTF BIAS CLARITYThe dollar is free falling as we can see , the eurusd on the other hand is also close to its closest liquidity and major high,
As there is a smt divergence, we can clearly look at eurusd as it didn't make a low but Gbpusd had it , eur/usd is clearly more strong component.
I've made a path , besides it the trade idea will invalidate.
Aligned Timeframes - 3months<1day<4hour.
USD/CHF Approaching Breakdown from RangeUSD/CHF is moving in a sideways corrective pattern, not a strong trend. The price is forming an A-B-C-D-E structure, which usually happens before the market makes a bigger move. Right now, price is in the last part of this pattern (wave E) and is sitting near a resistance area, where it has failed to move higher and has started to turn down. This behavior often means sellers are becoming stronger. As long as the price stays below 0.795–0.798 , the outlook remains bearish, and the market is expe
AUDCAD 4HR T/F ANALYSIS----
audcad 4hr t/f analysis---- red highlighted portion is a arc so it`s dual direction if breakout above breakout line then we can sure previous whole demand can repeat , trend are bullish so we can go with trend | if we want enter in trend then wait for after breakout and retesting then we can plane a trade on retesting point let`s see----
EURUSD – Breakout From Falling Resistance, Retest Holding WellEUR/USD was trading under a falling resistance trendline for a long time, with sellers consistently stepping in at higher levels. Recently, price managed to break above this trendline, which was the first sign that bearish pressure was easing.
After the breakout, price came back for a retest of the broken structure and previous resistance area. This retest is holding well so far, showing that buyers are defending the level and not allowing price to slip back below the structure.
What stands o
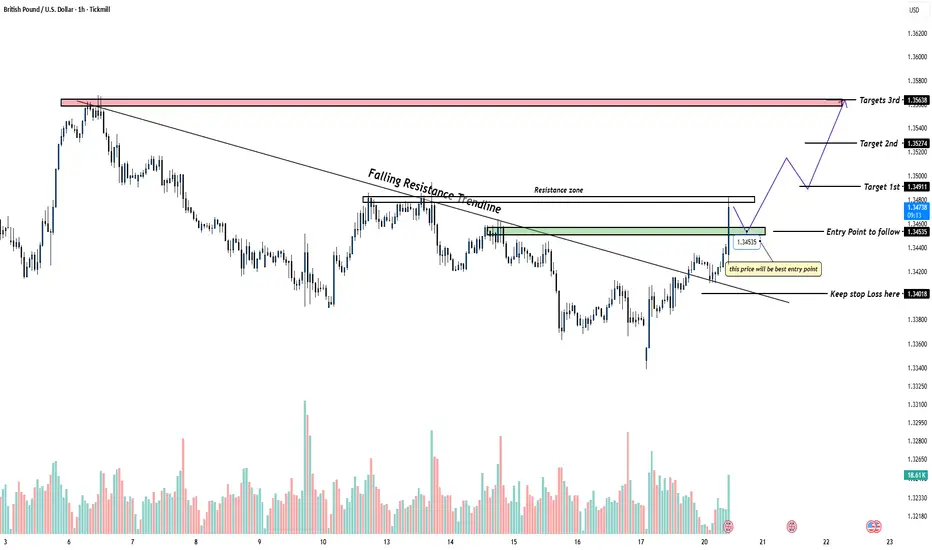
GBPUSD – Breakout Retest Looks Healthy, Bulls in ControlGBP/USD has been trading below a falling resistance trendline for quite some time. Recently, price managed to break above this trendline, which is the first sign that selling pressure is weakening.
After the breakout, price did not continue straight up. Instead, it came back for a retest, and that retest is holding well so far. This is usually a healthy sign, showing that buyers are willing to step in at higher levels instead of letting price fall back below structure.
What Price Is Telling Us
USDCHF – Gap Down From Resistance, Price Testing Key Support!USD/CHF was trading near a well-defined resistance zone where price has faced repeated rejection in the past. This clearly showed that sellers were active at higher levels and the market was struggling to sustain upside momentum.
From this resistance, the market opened with a gap down, which often signals aggressive selling and position unwinding rather than a slow intraday move. The gap was also supported by short-term U.S. dollar weakness, as the market adjusted expectations around risk senti
Bearish on GBPAUDWe have seen a large stretched bullish green candle and instead of continuing the uptrend, Sellers stroke hard, resulting in down red canlde. Now i conclude from this is, upmove was fake and in coming days, we may witness a downfall in this pair. With little higher stoploss, we can sell for a bigger lower target.
AUDUSD – Sell From Weak High RejectionPrice swept the weak high at 0.6772 and immediately rejected, confirming a liquidity grab. Structure shifted bearish, and price is now pulling back toward premium levels for a potential continuation down.
🔍 Bias: Bearish
Entry: 0.67722
Stop Loss: 0.67873 (above sweep)
Take Profit:
TP1: 0.67634
Reasoning: Liquidity sweep + bearish structure shift + clean inefficiencies below acting as magnets.
USDCHF – Liquidity Sweep at Weak Low + Discount Rejection📌 Trade Idea
USDCHF has tapped into a deep discount zone, swept the weak low, and reacted sharply from a higher-timeframe demand region. After the downside sweep, price formed multiple rejection wicks, indicating that sellers are exhausting and buyers are defending this level.
Market structure shows a strong bearish leg, but we have now reached the extreme end of the move, offering potential for a corrective long retracement back into premium levels.
🔍 Key Confluences
Weak Low Taken: Liquidit
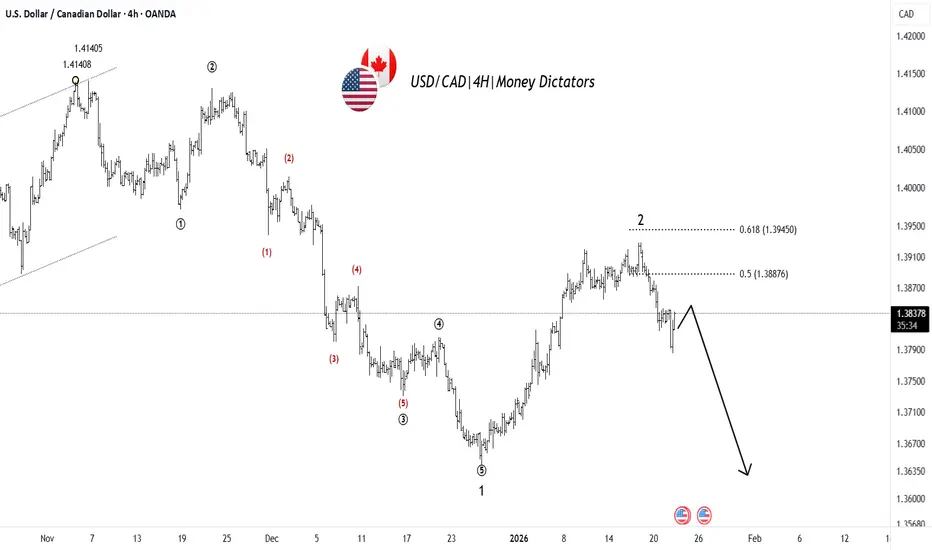
USD/CAD: Elliott Wave Bearish BiasUSD/CAD is showing a bearish Elliott Wave structure on the 4H chart. Price appears to have completed a corrective Wave 2 near the 0.5–0.618 Fibonacci retracement zone, which is a common area for corrections to end. From there, the market has started to turn lower, suggesting the beginning of a new impulsive Wave 3 to the downside, which is usually the strongest bearish wave. As long as price stays below the recent swing high near the retracement zone, the bias remains bearish, with downside targ