EURUSD — Bullish Channel Retest Setup
Fundamental Analysis
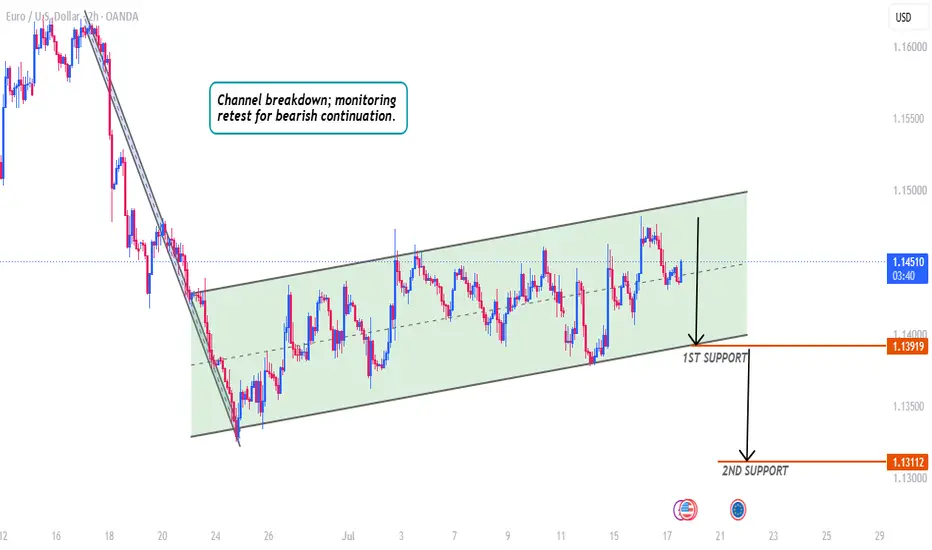
EURUSD is still reacting to USD momentum and upcoming macro data. For now, the short-term structure remains positive while price continues to respect the rising channel.
Technical Analysis
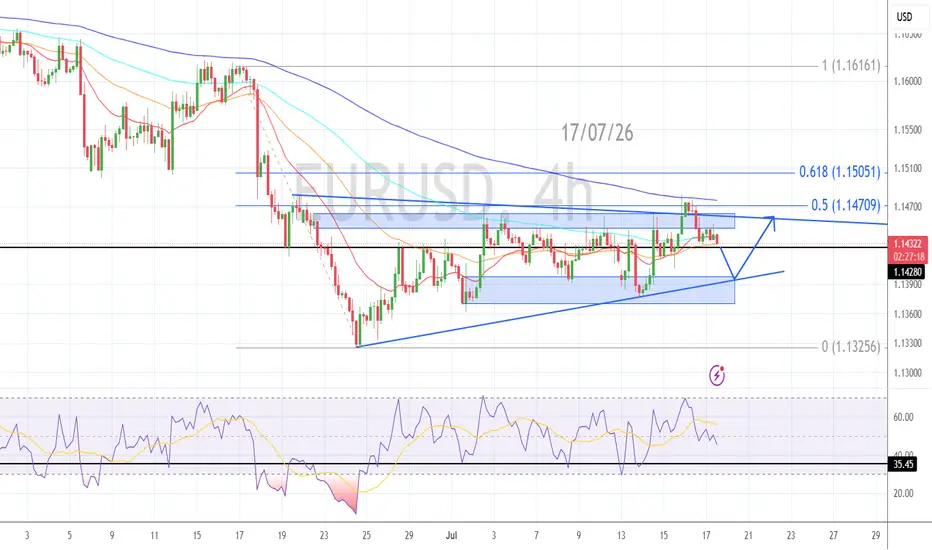
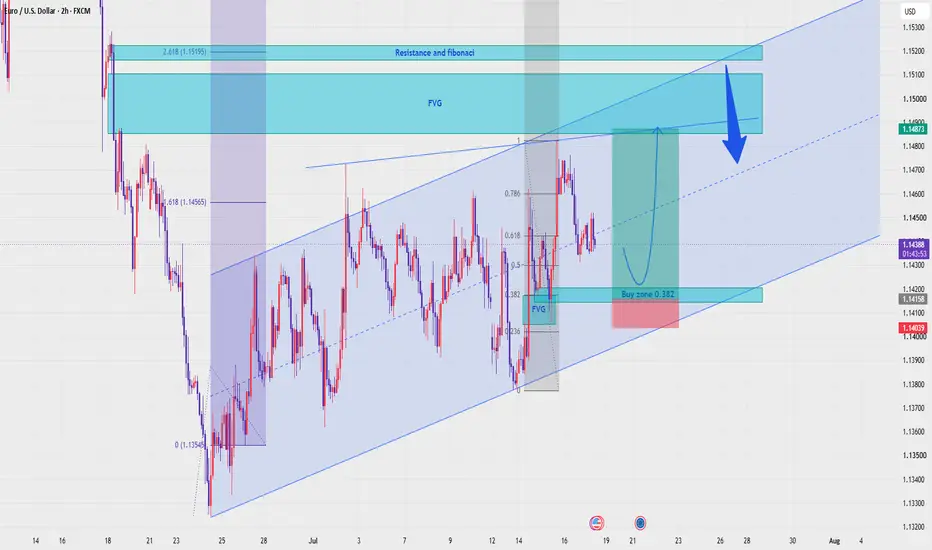
On the 2H chart, EURUSD is trading around 1.1437 and holding inside a clear bullish channel. The key buy zone is around 1.1415 - 1.1420, where the 0.382 Fibonacci area, FVG support, and lower channel reaction align. If price holds this value zone, buyers may push EURUSD back toward 1.1487, then the resistance and Fibonacci target around 1.1519 - 1.1526.
Important Key Levels
Current price: 1.1437
Main buy zone: 1.1415 - 1.1420
Short-term support: 1.1403
Liquidity area: 1.1487
FVG resistance: 1.1490 - 1.1510
Main target: 1.1519 - 1.1526
Invalidation: below 1.1403
Trading Scenario
Main Buy Setup
Entry: 1.1415 - 1.1420
Stop Loss: 1.1403
Take Profit 1: 1.1487
Take Profit 2: 1.1510
Take Profit 3: 1.1519 - 1.1526
Buy Condition
Wait for EURUSD to retest the 1.1415 - 1.1420 buy zone and show bullish rejection. A clean hold above this area keeps the bullish channel valid. If price breaks above 1.1487, upside momentum may extend toward the Fibonacci resistance zone at 1.1519 - 1.1526. If price breaks and holds below 1.1403, the buy setup is invalid.
Overall View
EURUSD remains bullish while price stays inside the rising channel and holds above the 0.382 Fibonacci value zone. The preferred plan is to wait for confirmation around 1.1415 - 1.1420, then look for continuation toward 1.1487 and 1.1519 - 1.1526.
Do you share the same bullish view on EURUSD, or are you waiting for a cleaner retest of the buy zone first?
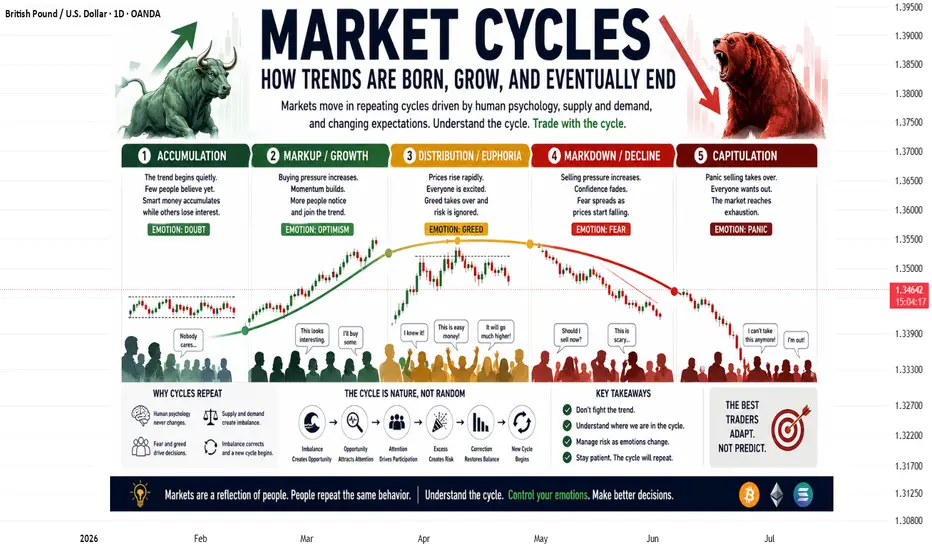
Market Cycles:Every trader has experienced it.
A market that seemed unstoppable suddenly loses momentum.
A long downtrend unexpectedly turns into a powerful rally.
News outlets search for explanations after the move has already happened, while traders wonder how the trend changed so quickly.
The truth is that markets rarely move in a straight line forever.
They evolve through cycles.
Every bull market, every bear market, and every period of consolidation is part of a repeating process driven by human behavior, supply and demand, and changing expectations.
Understanding these cycles doesn't allow you to predict every turning point, but it does help you understand **where the market may be in its journey**.
Every Trend Begins Quietly
Most major trends don't start with excitement.
They begin when very few people believe in them.
After a prolonged decline, pessimism is widespread.
News remains negative.
Many traders have already given up.
Yet beneath the surface, buyers slowly begin accumulating positions.
Price stabilizes.
Selling pressure weakens.
The market stops making aggressive new lows.
This stage is often called accumulation.
Confidence is low, but the balance between buyers and sellers is beginning to shift.
Momentum Attracts Attention
As buying pressure increases, price starts making higher highs and higher lows.
At first, only experienced traders notice.
Then momentum traders join.
Analysts begin changing their outlook.
Positive news becomes more common.
The trend becomes visible to everyone.
This is the growth phase of the cycle.
Confidence replaces doubt, trading volume often increases, and more participants enter the market.
The trend feeds on itself as optimism spreads.
Euphoria Often Appears Near the Top
No trend lasts forever.
As prices continue rising, emotions begin replacing logic.
Success stories dominate social media.
Friends and family who never cared about investing suddenly start asking how to buy.
Many traders stop focusing on risk.
Instead, they believe prices can only move higher.
This is the distribution phase.
Large, experienced participants may begin taking profits while enthusiasm among retail traders reaches its highest level.
The market still looks strong, but the balance between buyers and sellers is quietly changing.
Decline Begins Before Most People Notice
Market tops are rarely obvious.
The first signs often appear as weaker rallies and failed breakouts.
Volatility increases.
Good news has less impact.
Selling pressure gradually grows.
Eventually, confidence gives way to uncertainty.
Some investors take profits.
Others hold on, convinced the correction is temporary.
As selling accelerates, fear spreads.
This marks the beginning of the **markdown phase**, where supply overwhelms demand and prices move lower.
Why Cycles Repeat
Technology changes.
Trading platforms improve.
New financial products appear.
But one thing remains remarkably consistent:
Human nature.
People still experience fear, greed, hope, regret, and overconfidence.
These emotions influence buying and selling decisions just as they did decades ago.
Because human psychology changes very little, market cycles continue to repeat across stocks, forex, cryptocurrencies, commodities, and other financial markets.
The names of the assets may change, but the emotional journey remains surprisingly familiar.
News Usually Follows the Trend
One of the biggest surprises for new traders is realizing that markets often move **before** the headlines explain why.
Positive news frequently appears after a strong rally has already begun.
Negative headlines often dominate after prices have fallen significantly.
This doesn't mean news is unimportant.
It means markets are forward-looking.
Prices reflect expectations about the future, not simply current events.
Understanding this helps traders avoid chasing headlines after much of the move has already occurred.
Recognizing the Stage Matters More Than Predicting the Exact Top
Many traders become obsessed with calling the exact market top or bottom.
In reality, that is rarely necessary.
A more useful approach is asking:
Is the market accumulating or distributing?
Is momentum strengthening or weakening?
Are emotions driven by fear or greed?
Is participation expanding or fading?
These questions provide context.
And context often leads to better decisions than trying to predict exact turning points.
Final words:
Markets don't move randomly from one candle to the next.
They progress through repeating cycles shaped by supply and demand, changing expectations, and human emotion.
Every major trend begins quietly.
It grows as confidence spreads.
It reaches a point where optimism becomes excessive.
Eventually, it weakens as emotions shift and a new cycle begins.
The traders who consistently succeed are not the ones trying to predict every twist and turn.
They are the ones who understand where the market is within the cycle and adapt their decisions accordingly.
Because while markets constantly change, the behavior of the people participating in them rarely does.
Liquidity Sweep - Bullish and Bearish 📌 Overview
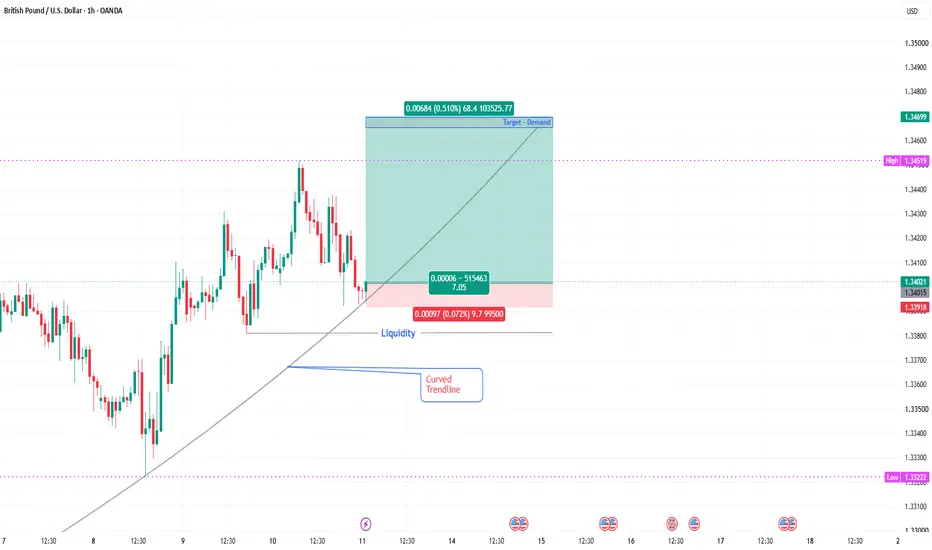
Liquidity Sweeps occur when price briefly moves beyond a significant support or resistance level, triggering stop-loss orders before reversing direction. This concept helps traders understand how liquidity is collected and why confirmation is important before making trading decisions.
___________________________________________________________
📘 Definition
A Liquidity Sweep is a temporary move beyond a key price level that is often followed by a reversal.
Bullish Liquidity Sweep : Price moves below support, sweeps liquidity, and then reverses upward.
Bearish Liquidity Sweep : Price moves above resistance, sweeps liquidity, and then reverses downward.
These movements can occur around important support and resistance zones.
___________________________________________________________
📌 Key Points
Liquidity often exists above resistance and below support.
A temporary break of a key level does not always indicate a true breakout.
Strong rejection after the sweep may indicate a shift in short-term momentum.
Waiting for confirmation can help avoid reacting to false breakouts.
Liquidity Sweeps are commonly analyzed together with market structure and price action.
___________________________________________________________
📊 Chart Explanation
Bullish Example
• Price approaches a support level.
• Price briefly moves below support, sweeping liquidity.
• Buyers regain control and price reverses higher.
Bearish Example
• Price approaches a resistance level.
• Price briefly moves above resistance, sweeping liquidity.
• Sellers regain control and price reverses lower.
The examples shown illustrate possible market behavior and are intended for educational purposes.
___________________________________________________________
📉 Summary
Liquidity Sweeps highlight areas where price may temporarily move beyond important levels before reversing. Understanding this concept may help traders better interpret market behavior and avoid confusing temporary liquidity grabs with confirmed breakouts.
___________________________________________________________
💡Why It Matters
• Helps identify potential false breakouts.
• Improves understanding of market liquidity.
• Encourages waiting for price confirmation instead of reacting immediately.
• Can be combined with support and resistance, trend analysis, and market structure for additional context.
___________________________________________________________
📌 Conclusion
Liquidity Sweeps are a widely discussed price action concept that illustrates how markets can temporarily move beyond key levels before changing direction. Like any technical concept, they should be used alongside confirmation and sound risk management rather than in isolation.
___________________________________________________________
⚠️ Disclaimer
📘 For educational purposes only.
🙅 Not SEBI registered.
❌ Not a buy/sell recommendation.
🧠 Purely a learning resource.
📊 Not Financial Advice GBPUSD: The Current Rally Now Has to Prove Its StrengthGBPUSD has reached a point where the current rally needs to prove it still has enough strength to continue. After a strong recovery from lower levels, price has entered a major resistance zone clearly marked on the chart. This is where I become more cautious, because fast rallies often begin to lose momentum when they revisit areas that previously attracted significant selling pressure.
Simply reaching resistance is not a sell signal for me. What matters is how the market reacts. If price pushes slightly higher but then shows clear rejection, smaller bullish candles, or fails to establish acceptance above the resistance zone, it would suggest that buying pressure is fading. In that case, the current rally could turn into nothing more than a short-term distribution phase before sellers regain control.
If that scenario develops, I'll be watching for a correction toward 1.33850. This target becomes much more convincing if price leaves the resistance zone with clear signs of increasing selling pressure. On the other hand, if buyers manage to break decisively above the resistance and hold that level, the bearish outlook would no longer be valid.
This is simply my personal interpretation of the current market structure and should not be considered financial advice. I prefer to wait for market confirmation rather than react too early, and I always make risk management my highest priority. Head And Shoulders - Bearish Continuation Overview
The Head and Shoulders pattern is one of the most recognized bearish reversal formations in technical analysis. In this chart, price has formed a Left Shoulder, a higher Head, and a Right Shoulder before breaking below the neckline. The current structure suggests that sellers have gained momentum, while a possible retest of the neckline could provide additional confirmation if the pattern remains valid.
___________________________________________________________
Definition
A Head and Shoulders pattern is a price formation consisting of three peaks:
Left Shoulder : The first peak followed by a pullback.
Head : A higher peak followed by another decline.
Right Shoulder : A lower peak that fails to exceed the head.
Neckline : A support line connecting the swing lows. A close below this level is commonly viewed as confirmation of the pattern.
___________________________________________________________
Key Points
• Price formed a clear Left Shoulder, Head, and Right Shoulder.
• The neckline acted as an important support level before the breakdown.
• A close below the neckline increases the probability of continued bearish momentum.
• Price may revisit the neckline before deciding its next directional move.
• A sustained move back above the neckline may weaken the current bearish structure.
___________________________________________________________
Chart Explanation
• The Left Shoulder marked the first attempt by buyers before a pullback.
• Buyers pushed price to a new high, creating the Head.
• The Right Shoulder formed with a lower high, indicating reduced buying strength.
• Price then broke below the neckline, suggesting that sellers gained control.
• The illustrated path shows one possible scenario where price retests the neckline before continuing lower. This projection is for educational purposes and is not a prediction of future price movement.
___________________________________________________________
Summary
The current chart displays a completed Head and Shoulders pattern with a neckline breakdown. As long as price remains below the neckline, the bearish structure remains intact. Market participants may watch future price action around the neckline for additional confirmation or signs of invalidation.
___________________________________________________________
Why It Matters
• Recognizing chart patterns can help identify potential trend changes.
• It helps traders understand shifts in market sentiment.
• It highlights important technical levels for planning entries, exits, and risk management.
• Waiting for confirmation may reduce the likelihood of acting on false signals..
___________________________________________________________
Conclusion
This chart highlights a classic Head and Shoulders structure followed by a neckline breakdown. Whether the market continues lower or invalidates the setup will depend on future price action. As with any technical pattern, confirmation and proper risk management are essential before making trading decisions.
___________________________________________________________
Disclaimer
📘 For educational purposes only.
🙅 Not SEBI registered.
❌ Not a buy/sell recommendation.
🧠 Purely a learning resource.
📊 Not Financial Advice
AUDUSD LONG Although the price action on AUD/USD isn't particularly clear, the pair is still trading above the 50 EMA on the weekly timeframe. Over the past two weeks, we've also seen strong bullish rejections, suggesting that buyers are still defending lower prices.
The 10 EMA and 20 EMA are converging, which indicates slowing momentum, but there's still a reasonable possibility that price could break above the previous week's high.
PDH is cleared.
On the 4-hour timeframe, after the recent rejection, I can identify a good Fibonacci setup. Price has closed above the 61.8% retracement of the last bullish impulse, which adds confluence for a potential long position.
My plan is to look for a long entry and target the previous week's high, with the possibility of extending the target slightly beyond it if momentum continues.
That said, this isn't a perfect setup. There is still a chance that price could break below the previous week's low. Additionally, the 4-hour break of structure isn't very convincing since it was only a wick break rather than a candle close above the level.
Overall, this isn't an A+ setup, but it's a valid trade idea with enough confluence to keep on my watchlist.

 Short
Short