Forex market
AUDUSD H1 — Clean rejection from trendline resistance.Price is showing weakness after tapping the ascending trendline, and sellers are stepping in with momentum.
📍 Entry: 0.7134
🎯 Target: 0.7108
🛑 Stop Loss: 0.7146
Confluence:
• Trendline rejection
• Lower high formation
• Bearish momentum candles
• Liquidity resting near support zone
If sellers maintain control below the trendline, price can continue sliding toward the demand area. Waiting for confirmation and proper risk management is key.
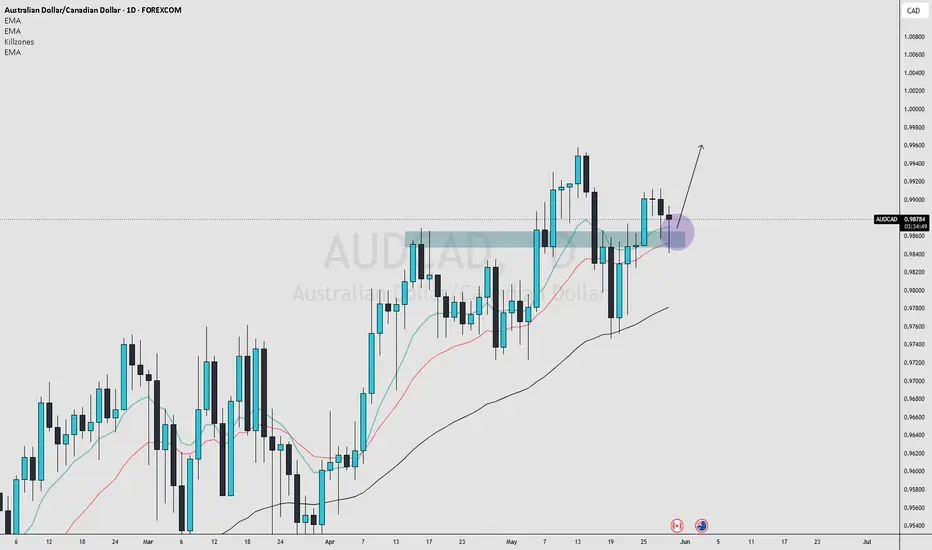
GBPCAD Continuation SetupIn GBPCAD, I can currently spot a strong continuation setup on the daily timeframe. Price is reacting cleanly from the 10–20 EMA zone, and the overall structure remains bullish. Price is trading above the 50 EMA, as well as above the 10 and 20 EMA, which confirms higher timeframe bullish strength. At the same time, price is also bouncing directly from the 10–20 EMA region, making the setup technically clean for possible continuation towards the upside.
Another important factor is that this EMA reaction is aligning with a multi-rejection zone, which adds further confluence to the setup.
However, when looking at the weekly timeframe, the picture becomes less straightforward. The last weekly candle closed as a strong indecision candle after taking out the previous weekly high. Despite breaking the high, price failed to hold the momentum and eventually closed as a doji. This creates the possibility that the previous weekly low could get swept before any major continuation move towards the upside begins.
So overall, the daily setup looks clean and bullish, but the weekly indecision is creating some uncertainty in the short term.
In addition to that, I’m already long on AUDCAD, so I do not want to increase my CAD exposure aggressively at the moment.
For now, I’ll stay patient and observe how GBPCAD unfolds before considering any additional positions.
GBPUSD 2H Structure Repetition SetupWhile analyzing the 2H timeframe, I noticed something very interesting. A similar market structure has already formed in the past, and now the market appears to be creating the same pattern once again.
One of the most important skills in trading is recognizing repeated structures. The market often leaves clues through previous price action, and if we can identify those patterns early, it becomes much easier to understand potential future movement.
In this case, the current structure closely resembles the previous setup. That is why I am paying close attention to the marked reaction zone. If the market is truly repeating the same behavior, then this area should attract buyers once again.
For now, my focus is very simple:
Watching the marked reaction zone carefully
Looking for any strong bullish or positive candle confirmation
Monitoring whether the repeated structure continues to play out
If the market forms a strong positive candle from this zone, then we could see another bullish expansion toward the upside, similar to the previous structure.
Of course, structure repetition is not a guarantee, but when price begins to respect the same pattern multiple times, it becomes an area worth monitoring closely.
The key idea here is that traders should train themselves to remember and recognize recurring market structures. The better you become at spotting repeated behavior, the easier it becomes to understand and solve market movements.
This analysis is based on MMC concepts designed by Candle King. His concepts have helped me understand market structure and price behavior with much greater clarity.
31/05/2026 EUR/USD AnalysisFOREXCOM:EURUSD
This is my analysis for EUR/USD.
EUR/USD is currently trading from its Daily FVG and has the potential to deliver a higher-timeframe market structure shift. On the lower timeframe (15M), price has already shown a market structure shift, indicating a possible change in order flow.
With that in mind, EUR/USD could move lower to sweep the remaining sell-side liquidity before continuing with its intended directional move.
EURUSD Trend Reversal Building From Key Demand ZoneEURUSD is showing early signs of a bullish recovery after an extended bearish move from the rising channel breakdown. Price is currently reacting from a strong demand zone around 1.1600, where buying pressure has started to slow down bearish momentum. The descending trendline remains the key barrier, and a confirmed breakout above it could shift short-term market structure back to bullish.
Higher lows forming near support indicate growing buyer strength, while the recent consolidation suggests accumulation before a larger move. If price breaks above 1.1655, bullish momentum may accelerate toward 1.1717 and eventually 1.1746 resistance levels. However, failure to maintain support could keep the overall bearish trend active and trigger another downside continuation.
USDCHF CONTINUATION SETUPIn USDCHF, I’m currently looking for possible short opportunities. On the daily timeframe, price is closing below a strong multi-rejection zone, which suggests weakening bullish momentum and possible continuation towards the downside.
From the weekly perspective, the last weekly candle closed bearish, adding further confirmation to the bearish higher timeframe bias. In addition to that, price is trading below the 50 EMA as well as the 10–20 EMA cluster on the weekly timeframe, which strengthens the probability of bearish continuation.
There is also a potential liquidity target resting below around the 0.77620 level, where sell-side liquidity may be positioned. That area could act as a possible draw on liquidity if downside momentum continues.
For now, I will wait for proper bearish confirmation and lower timeframe price action before considering any short positions.
No trade until entry conditions are fully satisfied.
AUDUSD CONTINUATION SETUPIn AUDUSD, price is currently trading in a continuation setup around the 10–20 EMA zone. Price remains above the 50 EMA, and at the same time, it is also holding above the 10–20 EMA, which keeps the overall structure bullish.
However, the main concern right now is that the 10–20 EMA is still tightly compressed and not showing strong bullish separation yet, which means momentum confirmation is still somewhat lacking. Despite that, the latest daily candle managed to close strongly above the EMA zone, which is an encouraging sign for buyers.
Another important factor is that the previous weekly candle closed bullish, and at the same time, we are entering a new monthly candle, which can often bring continuation momentum if higher timeframe strength remains intact.
For now, I’m expecting possible bullish continuation, but I want to see strong bullish price action from this zone along with a proper flip and confirmation before considering any long positions.
Until then, waiting for confirmation and observing how AUDUSD unfolds.
GBPUSD REVERSAL SETUPOn the weekly timeframe, the last two candles closed consecutively bullish, and price is currently bouncing above the 50 EMA. At the same time, the latest weekly candle managed to close slightly above the 10–20 EMA zone, and price is now attempting to break and sustain above it. Overall, this is giving a bullish indication from the higher timeframe perspective and suggests a possible continuation towards the upside.
Looking at the daily timeframe, price is still trading below the 10–20 EMA. However, after attempting to push lower following a downside rejection, sellers are clearly failing to maintain control. Price is now trying to reclaim the 10–20 EMA once again, which aligns with the bullish higher timeframe structure.
I can also identify a strong multi-rejection zone on the daily chart. For now, I will wait for a strong daily candle close above this zone before looking for long opportunities in GBPUSD.
No trade until confirmation and entry conditions are satisfied.
EURUSD REVERSAL SETUPOn the daily timeframe, price is closing strongly above the 10 EMA, and the 10–20 EMA appears to be converging, which suggests bullish continuation strength. Overall price action on the daily timeframe remains bullish.
From the weekly perspective, the previous weekly candle also closed bullish, increasing the probability of continuation towards the upside in the coming week.
Based on this higher timeframe bias, I will look for bullish price action confirmation on the 4-hour or 1-hour timeframe near the zone, preferably a break and retest flip before considering an entry.
For now, waiting for confirmation and proper entry conditions to be satisfied.
AUD/USD Moves Within a Consolidation RangeAUD/USD moved within a range-bound consolidation zone during Friday's trading session.
Despite struggling to capitalize on the previous day's strong rebound from levels below 0.7100, the spot price managed to maintain its position above 0.7150.
If this stability holds until the close of the New York session, the Aussie is poised to record a modest weekly gain for the first time in three weeks.
------------------------------------------------------------------------------------------------
✅ Fundamental Dynamics: The Tug-of-War of the Truce vs. RBA Domestic Sentiment
Global capital flows have been mixed in response to geopolitical developments and the latest inflation data:
- 🔸PCE Inflation Blast Wall: However, the Aussie's room for further upside is being constrained by macro data. Yesterday's US PCE release, which surged to 3.8% YoY, confirmed the fastest inflation rate in three years. This has kept the market skeptical of a complete de-escalation and locked bets on a 25-bps Fed rate hike in 2026 at around 50%.
- 🔸RBA Cools: Domestically, Australia's diminishing speculation that the Reserve Bank of Australia (RBA) will raise interest rates at its June meeting has discounted the AUD's strength, forcing the pair to move sideways.
------------------------------------------------------------------------------------------------
✅ Technical Analysis: Testing the Upper Limit of the Consolidation Corridor
Technically, AUD/USD has been trapped within the same consolidation corridor for nearly two weeks. Technical indicators show signs of buyer accumulation but remain tentative:
- 🔸RSI (Near 56): Moving slightly above the midline, indicating gradual daily constructive momentum without risk of overbought.
- 🔸Key Resistance (0.7180 - 0.7185): A close above this area would open a fast path to the structural swing high at 0.7279.
- 🔸Nearest Support (0.7109): The 38.2% Fibonacci retracement level. This support must be maintained to keep the weekly recovery structure alive.
GBPUSD Struggles Below Major EMA ZoneGBPUSD is attempting to recover on H4 after the strong decline from 1.3600, but price still remains below the larger EMA resistance near 1.3450–1.3460.
The rebound from 1.3380 has slowed, suggesting the current move still looks more like a corrective bounce rather than a confirmed bullish reversal.
Trade Plan
Buy setup: only consider longs if GBPUSD breaks and holds above 1.3465. Targets are 1.3500 and 1.3520.
Sell setup: if price rejects again from 1.3450–1.3460, targets are 1.3400 and 1.3380.
Continuation sell: if 1.3380 breaks, the next downside zone becomes 1.3350.
Invalidation: strong H4 close above 1.3465.
USDCAD - 2HUSDCAD has been in a clean bullish structure, but price has now made a sharp bearish displacement from the recent high into the marked lower demand zone. This looks like a possible liquidity grab or mitigation move after the strong upswing, so the next reaction around the zone will be important.
Technical Analysis Support and ResistanceCore of Technical Analysis
Technical Analysis is the study of past price movements, volume, and market trends to predict future price direction.
3 Main Principles:
Market Discounts Everything
All news, emotions, and fundamentals are already reflected in price.
Prices Move in Trends
Markets usually move in uptrend, downtrend, or sideways trends.
History Repeats Itself
Human psychology creates repeating chart patterns.
Key Tools:
Charts (Candlestick, Line, Bar)
Support & Resistance
Trendlines
Indicators (RSI, MACD, Moving Averages)
Volume Analysis
Patterns (Head & Shoulders, Double Top, Triangle)
Goal:
Find good entry, exit, and risk management points for trading.

USD/CAD Strengthens Quite Well for the Medium TermUSD/CAD recorded significant gains for the third consecutive day, successfully building momentum following a breakout of the critical resistance barrier in the 1.3810-1.3815 range.
The spot price surged to the 1.3870 region during the Asian session, marking a new high since April 13th, supported by the overall strength of the US Dollar (USD) in the foreign exchange market.
---------------------------------------------------------------------------------------------
✅ Fundamental Dynamics: USD Safe-Haven Effect Breaks CAD Correlation
Historically, rising crude oil prices strengthen the Canadian Dollar (CAD) as a commodity currency. However, current market dynamics indicate a very bullish anomaly for USD/CAD:
- Shattered Diplomatic Hopes: Reports of new US military airstrikes inside Iran and President Donald Trump's rejection of draft peace terms have dashed hopes for a diplomatic solution to the Gulf War, which is entering its third month.
- Expectations of a Double US Rate Hike: Although crude oil rebounded modestly from a three-week low, its impact on the CAD was significantly outweighed by the strengthening US Dollar.
---------------------------------------------------------------------------------------------
✅ Technical Analysis: Constructive Bullish Structure in Overbought Area
Technically, USD/CAD's success in recording a strong daily close confirms the transition of the medium-term trend to a pure bullish one:
- Key Resistance (1.3875): A breakout of this level will trigger a more pronounced continuation of the uptrend towards the 1.3963 area.
- Key Support Anchor (1.3810): The intersection of the 200-day SMA and the 61.8% Fibonacci level. As long as USD/CAD remains above this horizontal level, the bullish structure is deemed secure and intact.
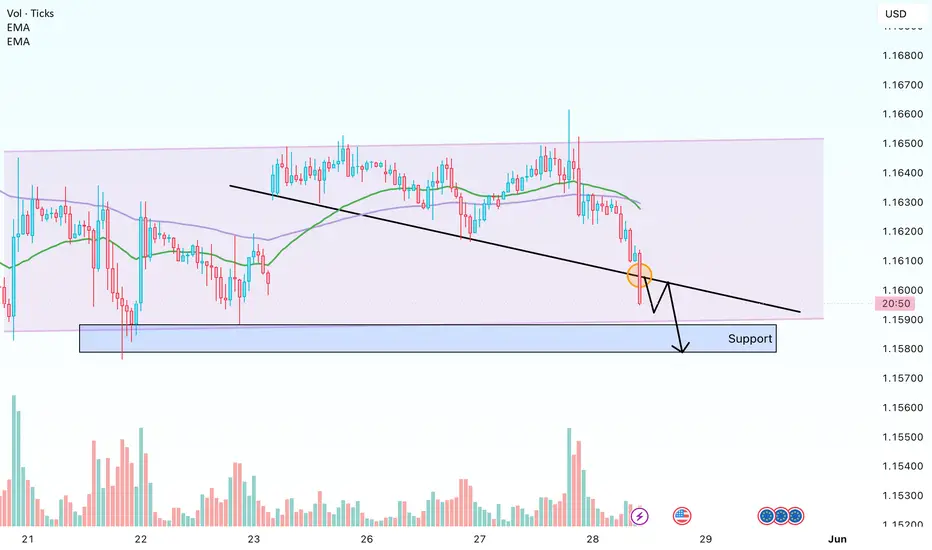
EURUSD Loses Short-Term Momentum on H1EURUSD has dropped back below both EMAs on H1 after failing near 1.1640, showing that buyers are losing momentum again.
The 1.1625–1.1635 zone is now acting as short-term resistance. As long as price remains below this area, sellers still hold the advantage.
Trade Plan
Sell setup: wait for a rebound toward 1.1625–1.1635. If price rejects clearly, targets are 1.1600 and 1.1590.
Continuation sell: if 1.1590 breaks, the next downside zone is 1.1575–1.1565.
Buy setup: only consider buying if EURUSD reclaims 1.1635–1.1640 with a strong H1 close.
Invalidation: clear H1 close above 1.1640.
NZDUSD - 2HNZDUSD has been in a broader bearish structure, but price recently reacted strongly from the lower demand zone and printed a sharp bullish impulsive move. The rally broke short-term structure and pushed price back into the marked supply/resistance area near 0.5915–0.5927, where reaction or rejection is likely.