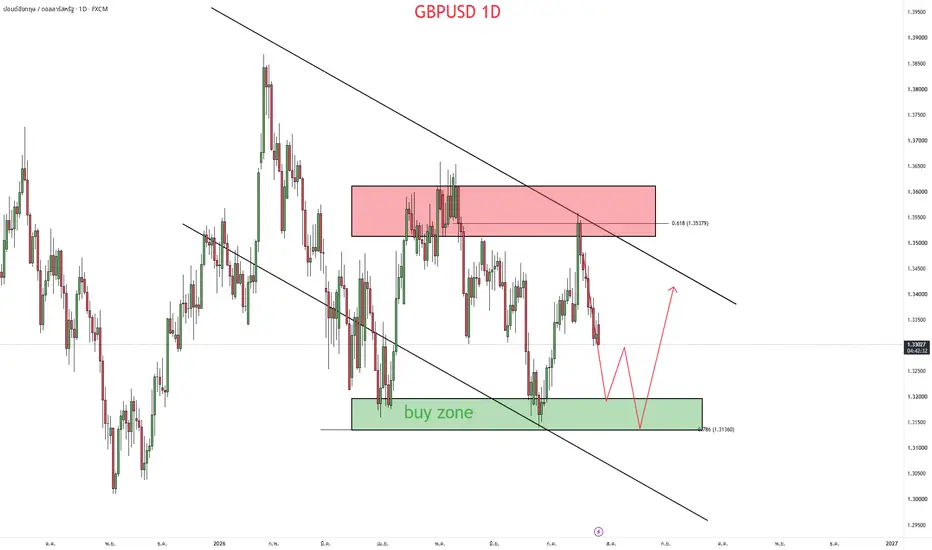
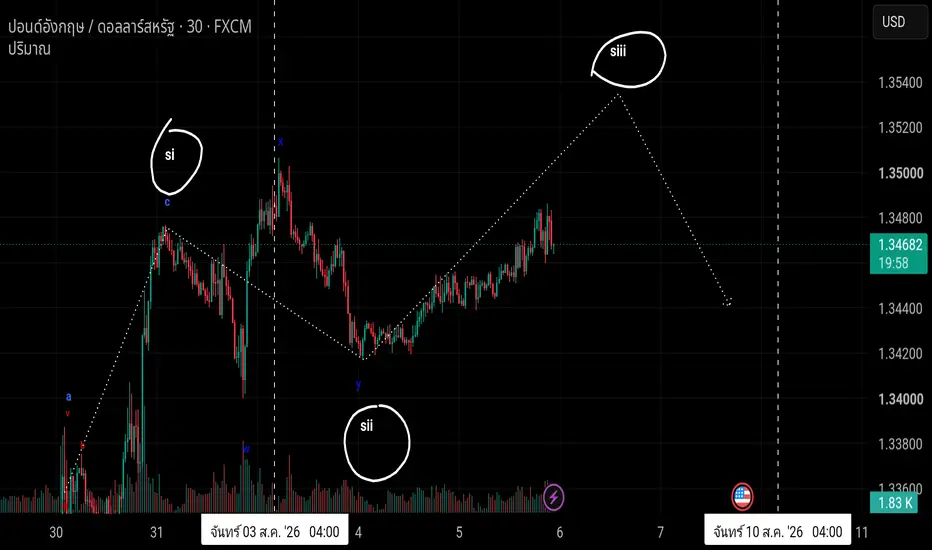
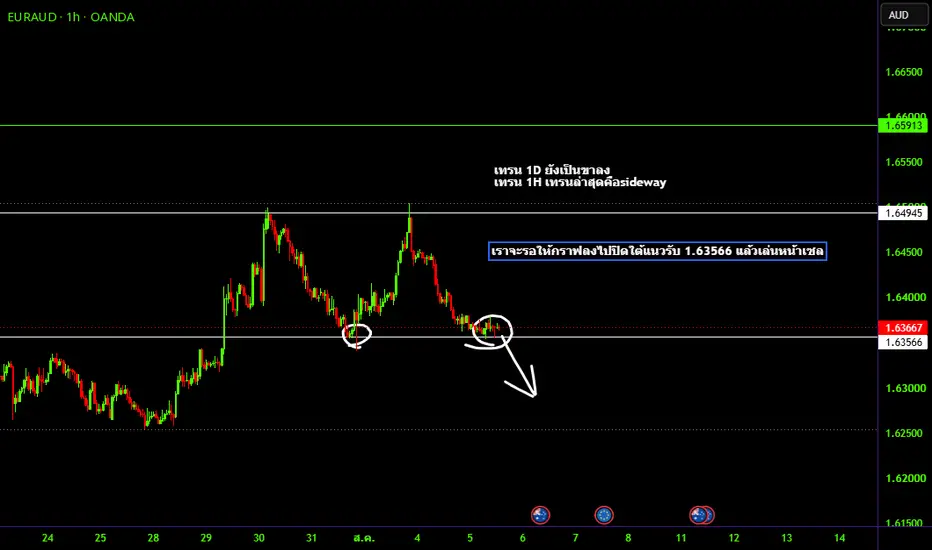
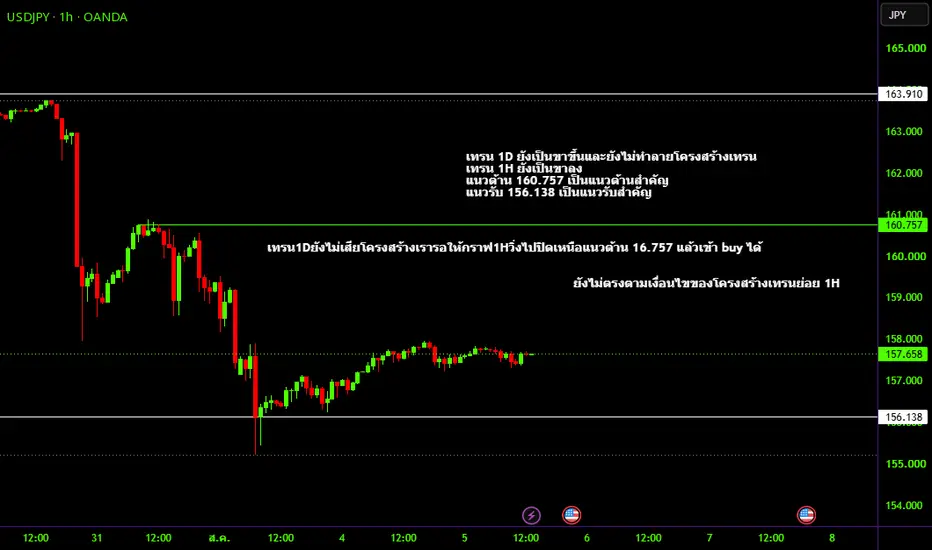
ฝึกอ่านกราฟเพื่อหาจุดเข้าซื้อให้แม่นยำยิ่งขึ้นกำหนดแผนรอกราฟวิ่งเข้ามาตามแผนวิ่งมาในแผนไหนกำหนดเงื่อนไขจุดเข้าซื้อตามแผน
ส่วนตัววิเคราะห์อย่างเดียวไม่เทรดจะเทรดจริงไม่เพียงกี่อย่างเท่านั้น ส่วนกราฟอื่นบนโลกนี้
ใช้เพื่อการฝึกวเคราะห์รูปแบบของตนเองเพื่อกลับมาย้อนดูว่าสิ่งที่วิเคราะห์ไว้เป็น
ไปตามที่วิเคราะห์ ตามค่าสถิติบันทึกการเทรดไว้ใช่หรือไม่เท่านั้น
ตลาดฟอเร็กซ์
ฝึกอ่านกราฟเพื่อหาจุดเข้าซื้อให้แม่นยำยิ่งขึ้นไม่ได้พูดนานแล้ว การวิเคราะห์นี้คือบันทึกการฝึกหาจุดเข้าส่วนตัวไม่ใช่การส่งซิกแนลการเทรดใดๆ
ทั้งสิ้นเป็บสมุดบันทึกการเทรดส่วนตัวเพียงแต่นำมาเพื่อให้ผู้ที่ได้เห็นได้ไปฝึกใช้ให้เข้ากับแนวทางการเทรด
ของตนเองหรือผู้เรียนรู้ใหม่ได้รู้จักตั้งไข่แบบใดยืนให้ได้ด้วยตนเองควรเริ่มเรียนรู้สิ่งใด
ควรฝึกตั้งคำถามและหาคำตอบให้ตนเองเท่านั้น
ฝึกอ่านกราฟเพื่อหาจุดเข้าซื้อให้แม่นยำยิ่งขึ้นกำหนดแผนรอกราฟวิ่งเข้ามาตามแผนวิ่งมาในแผนไหนกำหนดเงื่อนไขจุดเข้าซื้อตามแผน
ส่วนตัววิเคราะห์อย่างเดียวไม่เทรดจะเทรดจริงไม่เพียงกี่อย่างเท่านั้น ส่วนกราฟอื่นบนโลกนี้
ใช้เพื่อการฝึกวเคราะห์รูปแบบของตนเองเพื่อกลับมาย้อนดูว่าสิ่งที่วิเคราะห์ไว้เป็น
ไปตามที่วิเคราะห์ ตามค่าสถิติบันทึกการเทรดไว้ใช่หรือไม่เท่านั้น
ฝึกอ่านกราฟเพื่อหาจุดเข้าซื้อให้แม่นยำยิ่งขึ้นกำหนดแผนรอกราฟวิ่งเข้ามาตามแผนวิ่งมาในแผนไหนกำหนดเงื่อนไขจุดเข้าซื้อตามแผน
ส่วนตัววิเคราะห์อย่างเดียวไม่เทรดจะเทรดจริงไม่เพียงกี่อย่างเท่านั้น ส่วนกราฟอื่นบนโลกนี้
ใช้เพื่อการฝึกวเคราะห์รูปแบบของตนเองเพื่อกลับมาย้อนดูว่าสิ่งที่วิเคราะห์ไว้เป็น
ไปตามที่วิเคราะห์ ตามค่าสถิติบันทึกการเทรดไว้ใช่หรือไม่เท่านั้น
ฝึกอ่านกราฟเพื่อหาจุดเข้าซื้อให้แม่นยำยิ่งขึ้นกำหนดแผนรอกราฟวิ่งเข้ามาตามแผนวิ่งมาในแผนไหนกำหนดเงื่อนไขจุดเข้าซื้อตามแผน
ส่วนตัววิเคราะห์อย่างเดียวไม่เทรดจะเทรดจริงไม่เพียงกี่อย่างเท่านั้น ส่วนกราฟอื่นบนโลกนี้
ใช้เพื่อการฝึกวเคราะห์รูปแบบของตนเองเพื่อกลับมาย้อนดูว่าสิ่งที่วิเคราะห์ไว้เป็น
ไปตามที่วิเคราะห์ ตามค่าสถิติบันทึกการเทรดไว้ใช่หรือไม่เท่านั้น
USDTHB ทรัมป์จ่อเก็บค่าต่ง 20% ที่ผ่านช่องแคบ จับตา CPI คืนนี้ ตลาดหุ้นสหรัฐฯ ถูกกดดันจาก ความตึงเครียดสหรัฐ–อิหร่าน รอบใหม่ หลังปธน. Trump ประกาศฟื้นมาตรการปิดเส้นทางเดินเรืออิหร่านผ่านช่องแคบ Hormuz ส่งผลให้ราคาน้ำมันพุ่ง 4% และหุ้นเทคโนโลยีร่วงแรง Nasdaq -1.55%, S&P 500 -0.79% ขณะที่ Dow เสียหายจำกัดเพราะได้แรงหนุนจากหุ้นพลังงาน
SET Index +26% YTD ติดอันดับตลาดหุ้นดีที่สุดของโลก market cap แตะ ~20 ล้านล้านบาท ADV เพิ่ม +58% YoY เป็น ~66 พันล้านบาท Foreign net buy สะสม YTD ~41 พันล้านบาท (ณ 7 ก.ค.) สะท้อน global portfolio rotation เข้า EM Asia defensive แนะจับตาหุ้น banking (KBANK, SCB), utilities (GULF, GPSC), infrastructure (AOT, BEM) ที่ได้แรงหนุนจาก foreign inflow
"ความตึงเครียดเรื่องสงครามสหรัฐอิหร่านกลับมาเป็นปัจจัยกดดันตลาดหุ้นอีกครั้ง หลังจากเมื่อคืน ประธานาธิบดีโดนัลด์ ทรัมป์ ประกาศว่า สหรัฐฯ จะกลับมาใช้มาตรการปิดล้อมทางทะเลต่ออิหร่าน โดยจะเข้าควบคุมช่องแคบฮอร์มุซ และปฏิบัติภารกิจในการรักษาความปลอดภัยในพื้นที่ดังกล่าว นอกจากนี้ สหรัฐฯ จะเรียกเก็บเงินชดเชยในอัตรา 20% ของมูลค่าสินค้าทั้งหมดที่มีการขนส่งผ่านช่องแคบฮอร์มุซ ซึ่งตลาดรับรู้ก่อนประกาศตัวเลขเงินเฟ้อเพียง 1 วัน ทำให้ ค่าเงินกลับสวนกระแส ที่คาดการณ์เงินเฟ้อจะต่ำลงจากครั้งก่อนที่ 4.2 เหลือ 3.8 ที่จะประกาศค่ำนี้ เป็นปัจจัยที่ต้องติดตาม อาจทำให้ดอลลาร์อ่อนค่าลง ได้หากเงินเฟ้อลดลง และจส่งผลต่อทองคำให้เกิดรอบรีบาว หลังจากหลุดแนวรับจิตวิทยาที่ 4000 US/oz"
ด้านปัจจัยเทคนิค : ราคาฟื้นตัวรีบาวขึ้นมาจากแนวรับ 33.25 ขึ้นมาทดสอบ Order Block ที่โซน 33.53 เป็นแนวต้านสำคัญอีกครั้ง ในขณะที่โมเมนตั้มขายอ่อนแรงในเช้านี้ วัดจาก RSI ที่ปรับตัวลงไปโซน 50% แต่ราคายังทรงตัวอยู่โซน Supply ณ ปัจจุบันยังไม่เสียโครงสร้าง แต่หากลงต่ำกว่า 33.38 ภายในวัน จะเป็นลักษณะ BoS ทำให้เกิดแรงขายกดดันให้ปรับตัวลงต่อได้
"คาดการณ์กรอบ ดอลลาร์ไทยบาทที่ 33.40 - 33.60"
USDTHB ยอดขายบ้านมือสอง ลดลงจากครั้งก่อน โฟลว์หุ้นไทยแรง"Flow ต่างชาติไหลเข้าหุ้นไทยสูงถึง 8.6 พันล้าน เมื่อวานนี้ รวมถึงเช้านี้ SET รีบาวกลับมายืน 1615 จุด บวกขึ้น 9 จุด ทำให้ค่าเงินบาทแข็งค่าขึ้น ในด้านของตลาดหุ้นสหรัฐเมื่อวาน รีบาวขึ้นมาเช่นกัน โดยดัชนี NASDAQ บวกขึ้น 474.53 จุด สะท้อนโมเมนตั้มการซื้อ ในขณะที่ดอลลาร์อ่อนค่าลงไป ดัชนี DXY ย่อตัวลงเหลือ 100.6 จุดเช้านี้ เป็นปัจจัยกดดันดอลลาร์ที่มากขึ้น"
- ตลาดหุ้นสหรัฐฯ รีบาวแรงเมื่อคืนนี้ นำโดยหุ้นกลุ่มชิป/เซมิคอนดักเตอร์ ดัชนี NASDAQ 100 พุ่งขึ้น +474.53 จุด (+1.62%) สะท้อนโมเมนตัมแรงซื้อกลับเข้าสินทรัพย์เสี่ยง แม้สถานการณ์สหรัฐฯ-อิหร่านยังไม่คลี่คลายสมบูรณ์ VIX ร่วงแรง -6.27% เหลือ 15.84 จุด สะท้อนความกังวลตลาดที่ลดลงอย่างมีนัยสำคัญ
- ดัชนีดอลลาร์ (DXY) อ่อนค่าลงเหลือ 100.61 จุด (-0.32%) หลังตัวเลขยอดขายบ้านมือสองสหรัฐฯ เดือน มิ.ย. ลดลงเหลือ 4.09 ล้านหลัง จาก 4.19 ล้านหลัง ต่ำกว่าคาด สะท้อนภาคอสังหาฯ ที่ชะลอตัว ประกอบกับดุลการค้าเยอรมันเกินดุลสูงถึง 19.1 พันล้านยูโร (จาก 14.7 พันล้านยูโร) เป็นปัจจัยกดดันดอลลาร์เพิ่มเติม ทำให้เงินสกุลหลัก G10 แข็งค่าขึ้นเทียบดอลลาร์ทั่วหน้า
- Flow เงินทุนต่างชาติไหลเข้าตลาดหุ้นไทยสูงถึง +8,634.39 ล้านบาทเมื่อวานนี้ ต่อเนื่องมาถึงเช้านี้ที่ SET Index รีบาวกลับมายืนเหนือ 1,615 จุด บวกขึ้น 9 จุด ส่งผลให้เงินบาทแข็งค่าขึ้นตามไปด้วย
- ราคาทองคำแกว่งตัวใกล้ระดับ 4,127.57 ดอลลาร์/ออนซ์ (+0.06%) ขณะน้ำมันดิบ WTI ขยับขึ้นเล็กน้อยสู่ 72.92 ดอลลาร์/บาร์เรล (+0.72%) แม้สถานการณ์อิหร่านยังมีความไม่แน่นอน
คาดการณ์ USDTHB เคลื่อนไหวในทิศทางอ่อนค่า มองกรอบ 33.35 - 33.20"
GBPUSD / British Pound Date: Friday, July 10, 2026GBPUSD / British Pound vs U.S. Dollar CFD 1H Technical Outlook
Date: Friday, July 10, 2026
Instrument: GBPUSD CFD
Timeframe: 1H
Current Price Area: 1.34495
Market Condition: Uptrend / Buy-Side Bias
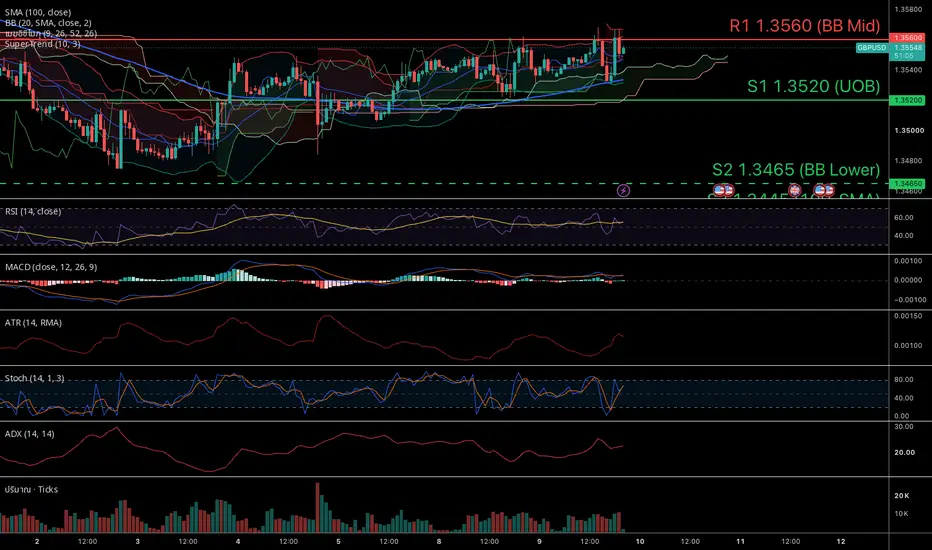
GBPUSD is currently trading around the 1.34495 area on the 1H timeframe. Price has made a strong bullish push and is now trading above the Pivot Point at 1.34046, confirming that buyers are still in control of the short-term structure.
The current move has already cleared R1 at 1.34308 and is now testing the R2 resistance area at 1.34530. This shows strong bullish momentum, but from a CFD trader’s perspective, this is also a zone where late long entries need caution. Price is approaching resistance, and entering without confirmation can expose traders to a pullback or short-term rejection.
The broader structure remains bullish as long as price holds above the pivot zone. The preferred approach is to follow the buy-side bias, but wait for either a confirmed breakout above R2 or a controlled pullback into support.
Key Levels
Resistance Levels:
- R1: 1.34308
- R2: 1.34530
- R3: 1.34792
Pivot Point:
- Pivot: 1.34046
Support Levels:
- S1: 1.33823
- S2: 1.33561
- S3: 1.33339
Trading Tool Perspective
The trading assistant tool currently shows:
- Trend: Uptrend
- Main Plan: Buy-side bias
- Guardrail: Avoid counter Sell
- Nearest Key Level: R2 at 1.34530
- PVA Status: Normal
This confirms that the current structure still favors buyers. The tool is also warning against counter-trend selling, which means short positions should be treated with caution unless price clearly breaks below the bullish structure.
A sustained break and hold above 1.34530 would support bullish continuation toward R3 at 1.34792. If buyers maintain momentum and volume improves, GBPUSD may continue extending the upside move.
On the downside, R1 at 1.34308 becomes the first important support after the breakout. If price pulls back and holds above R1, the bullish structure remains healthy. A deeper pullback toward the Pivot Point at 1.34046 would still be acceptable for the buy-side bias, as long as buyers defend that zone.
The cleaner tactical scenarios are:
1. Bullish continuation scenario:
Price breaks and holds above R2 at 1.34530, confirming continuation toward R3 at 1.34792.
2. Pullback-buy scenario:
Price pulls back toward R1 at 1.34308 or the pivot at 1.34046, holds support, and forms a bullish rejection structure.
3. Bullish failure scenario:
Price loses R1 and then breaks below the pivot at 1.34046, weakening the current buy-side bias and exposing S1 at 1.33823.
For now, GBPUSD remains in an uptrend structure with buy-side control. The preferred trading approach is to avoid counter-trend selling and wait for either a clean breakout above R2 or a disciplined pullback into support.
Risk Warning
This analysis is for educational purposes only and does not constitute financial advice, investment advice, or a trading signal. Trading forex CFDs and leveraged products involves significant risk and may not be suitable for all traders. Leverage can amplify both profits and losses. Always define your risk before entering a position, use proper position sizing, and trade only according to your own strategy, capital size, and risk tolerance.
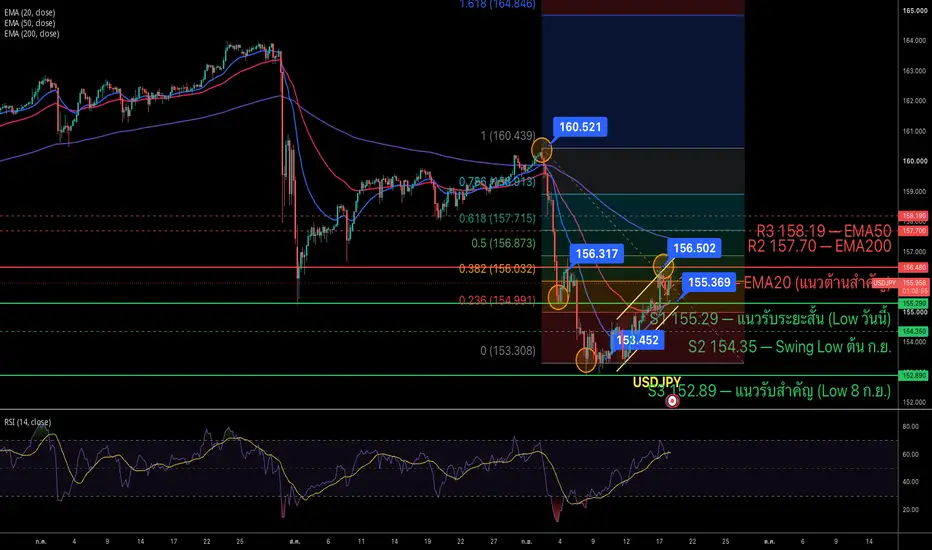
USDJPY: การย่อตัวทางเทคนิคอาจเป็นโอกาสในการเข้าซื้อตามแนวโน้มหลัหลังจากทดสอบเส้นแนวโน้มขาขึ้น (uptrend line) ได้สำเร็จหลายครั้ง ขณะนี้ USDJPY กำลังเข้าสู่ช่วงการปรับฐานเล็กน้อยเพื่อรองรับแรงเทขายทำกำไรในระยะสั้น ในแง่บวก เส้นค่าเฉลี่ยเคลื่อนที่ EMA34 และ EMA89 ยังคงมีทิศทางลาดชันขึ้น ในขณะที่ระดับราคา 161.73 ยังคงทำหน้าที่เป็นแนวรับสำคัญสำหรับแนวโน้มปัจจุบัน
ในมุมมองทางเทคนิค ความเคลื่อนไหวนี้มีลักษณะเป็นการย่อตัวเพื่อปรับฐานตามปกติ (healthy pullback) มากกว่าจะเป็นสัญญาณการกลับตัวของราคา หากราคาย่อตัวลงมาที่โซนแนวรับแล้วมีแรงซื้อกลับเข้ามา จะช่วยตอกย้ำโครงสร้างขาขึ้นให้แข็งแกร่งยิ่งขึ้น และเปิดโอกาสให้ราคาขึ้นไปทดสอบระดับ 162.77 อีกครั้ง ซึ่งระดับดังกล่าวถือเป็นโซนแนวต้านสำคัญในกรอบเวลา H4 ที่ตลาดจะตัดสินว่าแรงส่งฝั่งขาขึ้น (bullish momentum) นั้นแข็งแกร่งพอที่จะผลักดันแนวโน้มให้ไปต่อได้หรือไม่
เนื่องจากปัจจัยพื้นฐานยังคงส่งผลดีต่อค่าเงินดอลลาร์สหรัฐ (USD) กลยุทธ์หลักในขณะนี้จึงยังคงเป็นการมองหาโอกาสเข้าซื้อตามแนวโน้ม (trend-following) มากกว่าการเทรดสวนแนวโน้ม
กลยุทธ์การเทรดที่แนะนำ
จุดเข้าซื้อ (Entry): บริเวณ 161.73
จุดทำกำไร (TP): 162.77
จุดตัดขาดทุน (SL): ต่ำกว่า 161.45
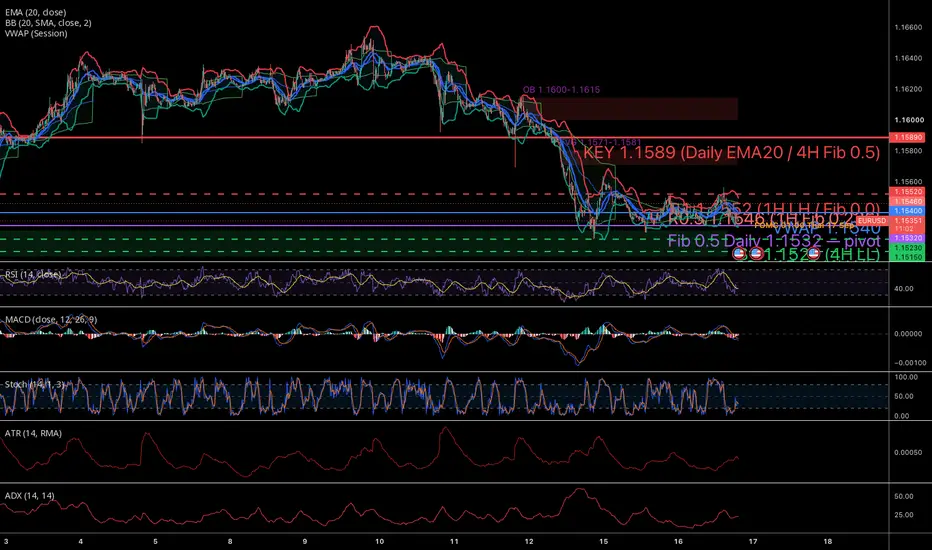
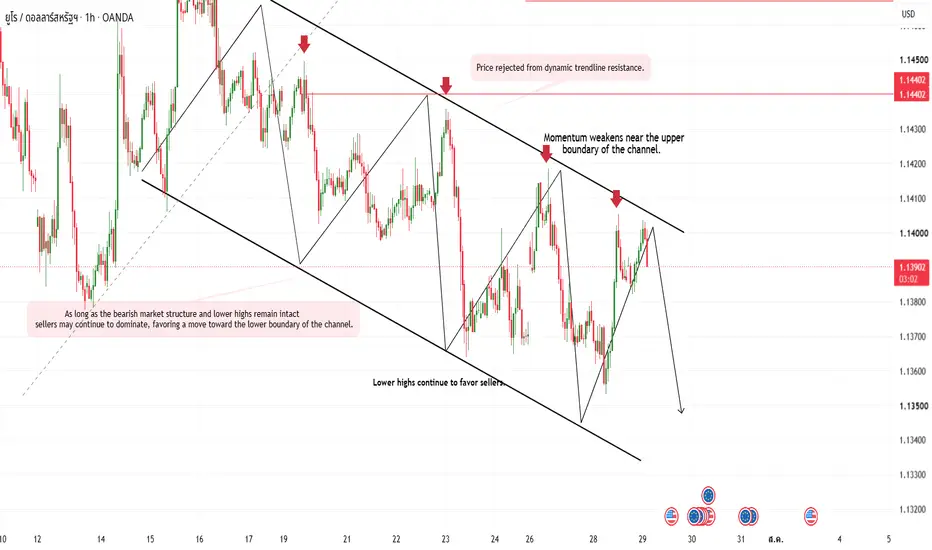
EURUSD: แนวต้านที่ระดับ 1.1455 ยังคงมีอิทธิพลสำคัญคู่เงิน EURUSD ฟื้นตัวได้อย่างแข็งแกร่งหลังจากดีดตัวขึ้นจากระดับ 1.1330 อย่างไรก็ตาม ควรสังเกตว่าการปรับตัวขึ้นทั้งหมดนี้เกิดขึ้นภายใต้แนวโน้มขาลงในภาพใหญ่ ขณะนี้ราคาเริ่มขยับเข้าใกล้โซน Supply (แรงขาย) ที่ระดับ 1.1455 ซึ่งเป็นบริเวณที่มักเกิดแรงเทขายซ้ำๆ ในช่วงที่ผ่านมา อีกทั้งยังเป็นจุดบรรจบกันของเส้น EMA89 และโซนการกระจายตัว (Distribution zone) ในกรอบเวลา H4
ในด้านปัจจัยพื้นฐาน ค่าเงินดอลลาร์สหรัฐยังคงได้รับแรงหนุนจากความคาดหวังของตลาดที่ว่าธนาคารกลางสหรัฐฯ (Fed) จะคงอัตราดอกเบี้ยไว้ในระดับสูงเป็นเวลานาน ในขณะที่ธนาคารกลางยุโรป (ECB) ยังคงเผชิญแรงกดดันจากแนวโน้มการเติบโตทางเศรษฐกิจที่อ่อนแอของยูโรโซน ความแตกต่างของนโยบายการเงินเช่นนี้บ่งชี้ว่า การปรับตัวขึ้นของ EURUSD เป็นผลมาจากปัจจัยทางเทคนิคเป็นหลัก มากกว่าที่จะเป็นการเริ่มต้นของแนวโน้มขาขึ้นรอบใหม่
ในมุมมองทางเทคนิค โครงสร้างราคาปัจจุบันยังคงบ่งชี้ถึงลักษณะการย่อตัวหรือการปรับฐานภายในแนวโน้มขาลง การที่ราคาขยับเข้าใกล้ระดับ 1.1455 โดยไม่สามารถสร้างจุดสูงสุดใหม่ (New High) ได้ สะท้อนให้เห็นว่าแรงซื้อเริ่มอ่อนกำลังลง หากเกิดสัญญาณการปฏิเสธราคา (Rejection signal) ที่โซน Supply ดังกล่าว มีความเป็นไปได้สูงที่ EURUSD จะกลับตัวลงมาทดสอบเส้นแนวโน้มขาขึ้นระยะสั้นบริเวณ 1.1401 อีกครั้ง ก่อนที่จะกำหนดทิศทางราคาในลำดับถัดไป
จุดเข้าเทรด (Entry): ขาย (Sell) ที่ระดับประมาณ 1.1445–1.1455
จุดทำกำไร (TP): 1.1401
จุดตัดขาดทุน (SL): เหนือระดับ 1.1480
USDTHB ยังแข็งค่าต่อเนื่อง จับตาดู FOMC Minutes มีโอกาส Hawkish "ดอลลาร์เคลื่อนไหวในทิศทางแข็งค่าขึ้นจากเมื่อวาน DXY กลับมายืน 101 จุดอีกครั้ง ตลาดหุ้นสหรัฐ ปรับตัวย่อทั้งกระดาน นำโดย NASDAQ ปรับตัวลงกว่า 1.77% ด้านตลาดหุ้นไทย SET เมื่อวานปรับตัวลงกว่า 20 จุด มายืนที่ 1604 จุด Flow ซื้อสุทธิต่างประเทศยังคงแข็งแกร่ง สุทธิ 1054.38 พันล้าน จับตาดู FOMC Minutes คืนนี้ คาดมีเรื่องเกี่ยวกับทิศทางดอกเบี้ยในปี 2026 และมุมมอง hawkish ของ ประธาน FED Kevin
คาดการณ์กรอบค่าเงินดอลลาร์ เคลื่อนไหวในโซน 33.25 -33.45 ภายในวันนี้ และคืนนี้ มีโอกาสทดสอบ 33.45- 33.50"
- คืนนี้ ตี 1 จะมีการเปิดเผย FOMC Minutes ของการประชุมเดือน มิ.ย. ซึ่งตลาดจับตาโทนของถ้อยแถลงอย่างใกล้ชิด หลัง Nonfarm Payrolls เดือน มิ.ย. ออกมาต่ำเพียง
- ตัวเลขยอดขายบ้านมือสอง คาดการณ์ดีกว่าครั้งก่อนที่ 4.2 ล้าน
ทางเทคนิค
ภาพเทคนิคบน 15m ยังเป็นขาขึ้นชัดเจนหลัง breakout จากฐาน 33.28–33.30 EMA สั้น อยู่เหนือ EMAยาว ทั้งหมด สะท้อน momentum เชิงบวก RSI อยู่ที่ 62.97 (Signal 53, STO 58.35) ยังอยู่ในโซนบวกแต่ไม่ overbought เปิดโอกาสให้ราคาไปต่อได้
สอดคล้องกับปัจจัยพื้นฐานฝั่ง THB ที่มี net outflow ในเดือน มิ.ย. และราคาน้ำมันที่ขยับขึ้นจากความเสี่ยงภูมิรัฐศาสตร์ ซึ่งหนุน USDTHB อย่างไรก็ตาม DXY เองอยู่ใกล้จุดต่ำสุดรอบ 3 สัปดาห์และมีความเสี่ยงจากการเปิดเผย FOMC Minutes คืนนี้ ซึ่งเป็นตัวแปรสำคัญที่อาจกำหนดทิศทางระยะสั้นของดอลลาร์ในภาพรวม กลยุทธ์ที่เหมาะสมคือ ย่อซื้อ ตามเทรนด์หลักที่โซนแนวรับ
เป้า 33.40-45
คัท 33.29
ฝึกอ่านกราฟเพื่อหาจุดเข้าซื้อให้แม่นยำยิ่งขึ้นกำหนดแผนรอกราฟวิ่งเข้ามาตามแผนวิ่งมาในแผนไหนกำหนดเงื่อนไขจุดเข้าซื้อตามแผน
ส่วนตัววิเคราะห์อย่างเดียวไม่เทรดจะเทรดจริงไม่เพียงกี่อย่างเท่านั้น ส่วนกราฟอื่นบนโลกนี้
ใช้เพื่อการฝึกวิเคราะห์รูปแบบของตนเองเพื่อกลับมาย้อนดูว่าสิ่งที่วิเคราะห์ไว้เป็น
ไปตามที่วิเคราะห์ ตามค่าสถิติบันทึกการเทรดไว้ใช่หรือไม่เท่านั้น
ฝึกอ่านกราฟเพื่อหาจุดเข้าซื้อให้แม่นยำยิ่งขึ้นกำหนดแผนรอกราฟวิ่งเข้ามาตามแผนวิ่งมาในแผนไหนกำหนดเงื่อนไขจุดเข้าซื้อตามแผน
ส่วนตัววิเคราะห์อย่างเดียวไม่เทรดจะเทรดจริงไม่เพียงกี่อย่างเท่านั้น ส่วนกราฟอื่นบนโลกนี้
ใช้เพื่อการฝึกวเคราะห์รูปแบบของตนเองเพื่อกลับมาย้อนดูว่าสิ่งที่วิเคราะห์ไว้เป็น
ไปตามที่วิเคราะห์ ตามค่าสถิติบันทึกการเทรดไว้ใช่หรือไม่เท่านั้น
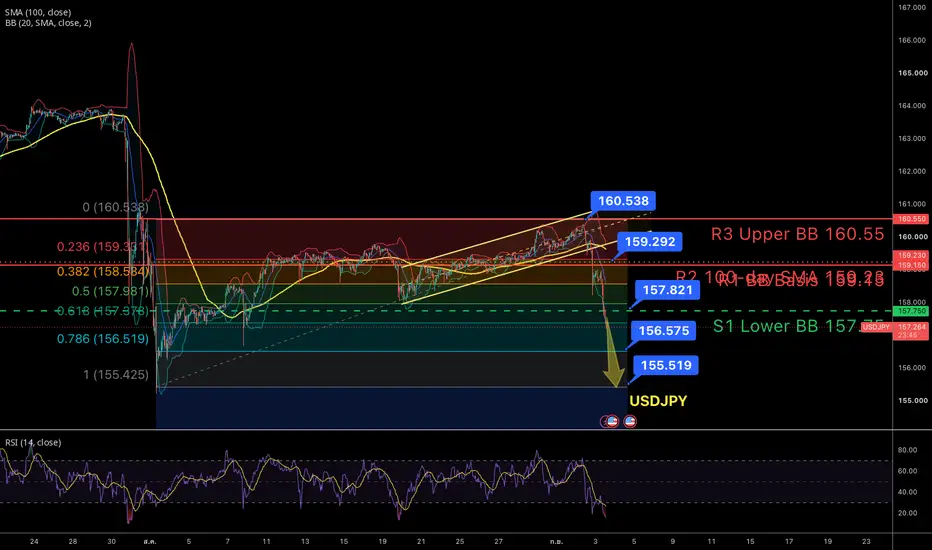
USDJPY 7/7 - การเทรดในช่วงแคบระยะสั้น รอข่าวใหม่เพื่อการเบรคเอาทตั้งแต่ที่นายกรัฐมนตรีญี่ปุ่น ทาคาอิจิ เข้ารับตำแหน่งและตลาดเริ่มเก็งกำไรว่า Fed สหรัฐฯ จะขึ้นดอกเบี้ยในปี 2026 ค่าเงินเยนจึงอ่อนค่าลงอย่างต่อเนื่อง เว็บไซต์ข่าวใหญ่ๆ ต่างโปรโมทว่าเยนกำลังอยู่ในระดับสูงสุดในรอบ 30 ปีตั้งแต่ปี 1990... หากดูกราฟรายวันอย่างละเอียด USDJPY ยังแกว่งตัวอยู่ใกล้จุดสูงสุดในเดือนกรกฎาคม 2024 (ประมาณ 162) ยังไม่ถือเป็นการเบรคเอาท์อย่างเป็นทางการในช่วง 2 ปีที่ผ่านมา เมื่อใดที่ MACD รายวันเกิดการเบี่ยงเบน USDJPY มักจะมีการปรับฐานอย่างชัดเจน แรงขับเคลื่อนชะลอตัวลง แต่การปรับฐานยังไม่เกิดขึ้น ตลาดกำลังรอปัจจัยกระตุ้นใหม่...ปัจจัยกระตุ้นใหม่จะเป็นอะไร...? ดัชนีดอลลาร์สหรัฐจะแข็งค่าขึ้นอีกครั้งและทะลุ 101.80 หรือไม่? สองสัปดาห์ก่อน ธนาคารเพื่อการลงทุนบางแห่งออกรายงานว่าปีนี้จะมีการขึ้นดอกเบี้ย 3 ครั้ง หากดอลลาร์ต้องการแข็งค่าขึ้นอีก ตลาดต้องเริ่มเก็งกำไรว่า Fed จะขึ้นดอกเบี้ยเกิน 3 ครั้งในปี 2026 ซึ่งโอกาสยังไม่มาก... โดยเฉพาะหลังสถานการณ์สหรัฐ/อิหร่านคลี่คลาย โอกาสที่ทิศทางจะกลับตัวสูงขึ้น... ธนาคารกลางญี่ปุ่นจะเข้ามาแทรกแซงอีกครั้งหรือไม่? ตาม IMF ญี่ปุ่นเป็นประเทศที่มีการแลกเปลี่ยนเงินตราเสรี และ BOJ ยังมีโอกาสแทรกแซงอีก 2 ครั้งก่อนเดือนพฤศจิกายน อ้างอิงผลการแทรกแซงครั้งก่อน ผลักดันการปรับฐาน 500 จุด หากแทรกแซงอีกครั้งจะดันลงได้กี่จุด? การแทรกแซงครั้งที่สองมักถูกตลาดตีราคาลดลง ครั้งนี้อาจปรับฐาน 300 จุด? เชื่อว่าครั้งนี้ต้องหนักกว่าครั้งแรก ต้องใช้สำรองเงินตราต่างประเทศมากขึ้นจึงจะมีผล 🤔? ปัจจัย "ไม่ทราบ"? ทำไมถึงพูดแบบนี้ 🤣 เหมือนกับภาษีปี 2025 หรือสถานการณ์อิหร่านเมื่อต้นปี เป็นเรื่องที่ต้องวางแผนอย่างรอบคอบ โครงการที่วางแผนไว้ แน่นอนว่ามีคนรู้ (จากปฏิกิริยาตลาดใน 6 เดือนที่ผ่านมา) แต่ไม่ใช่นักลงทุนทั่วไป และเชื่อว่าจะมีบางอย่างเกิดขึ้นก่อนการเลือกตั้งกลางเทอมของสหรัฐฯ รอไปก่อน... ปัจจุบัน USDJPY สามารถเทรดในช่วงแคบที่ระดับสูงต่อไปได้ ยังไม่มีข่าวใหม่ ช่วงการเทรดจะอยู่ระหว่าง 158(1) ถึง 163 ทำการเทรดในรูปแบบสามเหลี่ยมย่อย USDJPY ต้องหลุดเส้นค่าเฉลี่ย 150 วันจึงจะเกิดการปรับฐานลึกขึ้นแน่นอนว่าไม่สามารถตัดโอกาส USDJPY เบรคเอาท์ขึ้นได้ หากสามารถเคลียร์แรงขายที่ 163 และสังเกตแรงขับเคลื่อนตลาดเพิ่มขึ้น USDJPY จะทดสอบจุดสูงใหม่ เป้าหมายที่ 166.5เริ่มเตรียมตัว คุณพร้อมหรือยัง?
EUR/USD อ่อนตัวใกล้ 1.1400 หลังดอลลาร์ฟื้นตัว# วิเคราะห์ EUR/USD : อ่อนตัวลงใกล้ 1.1400 หลังดอลลาร์สหรัฐฟื้นตัว ท่ามกลางแรงกดดันจากปัจจัยภูมิรัฐศาสตร์
## ภาพรวมตลาด
คู่เงิน **EUR/USD** ปรับตัวลดลงเล็กน้อยและเคลื่อนไหวลงใกล้ระดับ **1.1400** ในการซื้อขายช่วงยุโรปของวันจันทร์ โดยเผชิญแรงขายหลังจาก **ดอลลาร์สหรัฐ (USD)** ฟื้นตัวภายหลังปิดสัปดาห์ก่อนในแดนลบ
ปัจจัยที่ช่วยหนุนค่าเงินดอลลาร์ในระยะสั้น ได้แก่ ความกังวลเกี่ยวกับสถานการณ์ในตะวันออกกลาง และการแข็งค่าของคู่เงิน **USD/JPY** ซึ่งส่งผลให้เงินดอลลาร์กลับมาได้รับแรงซื้อในฐานะสินทรัพย์ปลอดภัย
---
## วิเคราะห์ทางเทคนิค (Technical Analysis)
ในเชิงเทคนิค คู่เงิน EUR/USD ไม่สามารถยืนเหนือระดับ **23.6% Fibonacci Retracement** ของรอบขาลงระหว่างเดือนเมษายน-มิถุนายนได้ และถูกแรงขายกดกลับบริเวณแนวต้านของกรอบขาขึ้น (Ascending Channel) เมื่อวันพฤหัสบดีที่ผ่านมา
การเคลื่อนไหวดังกล่าว ประกอบกับการอ่อนตัวล่าสุด ทำให้โครงสร้างราคายังคงมีลักษณะเป็น **Bearish Flag Pattern** ซึ่งสะท้อนว่าแนวโน้มขาลงยังมีโอกาสดำเนินต่อ
นอกจากนี้ ราคายังคงเคลื่อนไหวต่ำกว่า **เส้นค่าเฉลี่ยเคลื่อนที่แบบเอ็กซ์โปเนนเชียล (EMA) 200 คาบ** บนกราฟ 4 ชั่วโมง ซึ่งทำหน้าที่เป็นโซนอุปทานสำคัญและเป็นแนวต้านที่แข็งแกร่ง
อย่างไรก็ตาม อินดิเคเตอร์โมเมนตัมยังไม่ได้ส่งสัญญาณเชิงลบอย่างชัดเจน โดย
* **RSI** เคลื่อนไหวต่ำกว่าระดับ 60 เพียงเล็กน้อย สะท้อนแรงซื้อที่ยังคงมีอยู่
* **MACD Histogram** ยังคงอยู่ในแดนบวก แม้จะเป็นบวกเพียงเล็กน้อย
ดังนั้น นักลงทุนควรรอให้ราคาสามารถยืนเหนือระดับ **23.6% Fibonacci Retracement** ได้อย่างมั่นคง ก่อนเปิดสถานะฝั่งซื้อเพิ่มเติม เพื่อยืนยันการฟื้นตัวจากบริเวณ **1.1325** ซึ่งเป็นระดับต่ำสุดนับตั้งแต่เดือนพฤษภาคม 2025
### แนวต้านสำคัญ
* **1.1466** : แนวต้านบริเวณกรอบบนของ Ascending Channel
* **1.1516** : EMA 200 คาบ
* **1.1525** : Fibonacci Retracement 38.2%
* หากผ่านได้ มีโอกาสทดสอบ
* **1.1587**
* **1.1649**
### แนวรับสำคัญ
* **1.1371** : กรอบล่างของ Ascending Channel
* **1.1325** : แนวรับสำคัญและจุดเริ่มต้นของกรอบขาขึ้นเดิม หากแรงขายยังคงกดดันต่อเนื่อง
---
## วิเคราะห์ปัจจัยพื้นฐาน (Fundamental Analysis)
แม้ว่าสหรัฐฯ และอิหร่านจะมีข้อตกลงชั่วคราวที่ช่วยลดความตึงเครียดบางส่วน แต่สถานการณ์บริเวณ **ช่องแคบฮอร์มุซ (Strait of Hormuz)** ยังคงเป็นประเด็นที่ตลาดจับตา หลังอิหร่านพยายามเพิ่มการควบคุมเส้นทางเดินเรือยุทธศาสตร์ดังกล่าว
ความเสี่ยงด้านภูมิรัฐศาสตร์ยังคงอยู่ในระดับสูง ส่งผลให้นักลงทุนยังถือครองดอลลาร์สหรัฐในฐานะสินทรัพย์ปลอดภัย ซึ่งเป็นแรงกดดันต่อการฟื้นตัวของ EUR/USD
อย่างไรก็ตาม ฝั่งกระทิงของดอลลาร์ยังไม่กล้าเปิดสถานะเชิงรุกมากนัก หลังตัวเลขตลาดแรงงานสหรัฐที่ประกาศเมื่อสัปดาห์ที่ผ่านมาออกมาอ่อนแอกว่าคาด
รายงาน **Nonfarm Payrolls (NFP)** เดือนมิถุนายนระบุว่า
* การจ้างงานเพิ่มขึ้นเพียง **57,000 ตำแหน่ง**
* ต่ำกว่าที่ตลาดคาดไว้ที่ **110,000 ตำแหน่ง**
ขณะเดียวกัน
* ตัวเลขเดือนก่อนถูกปรับลดจาก **172,000** เหลือ **129,000 ตำแหน่ง**
* อัตราการว่างงานลดลงเล็กน้อยมาอยู่ที่ **4.2%**
นอกจากนี้ ราคาน้ำมันดิบที่ปรับตัวลดลงในช่วงที่ผ่านมา ยังช่วยลดแรงกังวลด้านเงินเฟ้อ ส่งผลให้ตลาดปรับลดคาดการณ์การขึ้นดอกเบี้ยของธนาคารกลางสหรัฐ (Fed)
จากเดิมที่คาดว่าจะขึ้นดอกเบี้ย **1-2 ครั้งในปี 2026** ปัจจุบันตลาดประเมินว่าจะขึ้นเพียง **0-1 ครั้ง** เท่านั้น
ปัจจัยดังกล่าว ประกอบกับบรรยากาศการลงทุนในตลาดหุ้นที่ยังค่อนข้างเป็นบวก ทำให้การแข็งค่าของดอลลาร์ถูกจำกัด และช่วยลดโอกาสที่ EUR/USD จะปรับตัวลงอย่างรุนแรง
ในฝั่งยุโรป ตัวเลขเงินเฟ้อของยูโรโซนที่อ่อนแอกว่าคาด ทำให้นักลงทุนลดความคาดหวังต่อการปรับขึ้นอัตราดอกเบี้ยเพิ่มเติมของ **ธนาคารกลางยุโรป (ECB)** ส่งผลให้การเปิดสถานะฝั่งซื้อยูโรยังควรใช้ความระมัดระวัง
---
## ปัจจัยที่ต้องติดตามในวันนี้
นักลงทุนควรจับตาการประกาศข้อมูลเศรษฐกิจสำคัญ ได้แก่
* ยอดคำสั่งซื้อภาคโรงงานของเยอรมนี (German Factory Orders)
* ดัชนีความเชื่อมั่นนักลงทุนยูโรโซน Sentix
* ดัชนีราคาผู้ผลิต (PPI)
* ยอดค้าปลีก (Retail Sales)
ขณะที่ในช่วงเปิดตลาดสหรัฐฯ จะมีการประกาศ
* ดัชนี ISM Services PMI
* ถ้อยแถลงของกรรมการ FOMC
ซึ่งอาจเป็นปัจจัยสำคัญที่กำหนดทิศทางการเคลื่อนไหวของ EUR/USD ในระยะสั้น
---
### สรุปมุมมอง
ภาพรวมของ EUR/USD ยังคงอยู่ในช่วงฟื้นตัวแต่ยังไม่สามารถยืนยันการกลับเป็นขาขึ้นได้ เนื่องจากราคายังติดแนวต้านสำคัญทั้งบริเวณ **23.6% Fibonacci Retracement** และ **EMA 200 บนกราฟ 4 ชั่วโมง** ขณะที่ปัจจัยพื้นฐานยังคงผสมผสานระหว่างแรงหนุนจากการชะลอคาดการณ์ขึ้นดอกเบี้ยของ Fed และแรงกดดันจากความไม่แน่นอนด้านภูมิรัฐศาสตร์ รวมถึงแนวโน้มการดำเนินนโยบายของ ECB ทำให้ตลาดยังมีโอกาสผันผวนสูงในระยะสั้น
แหล่งที่มา...
www.fxstreet.com
USDTHB Non farm ออกมาต่ำเพียง 57K อัตราว่างงานต่ำลงเหลือ 4.2% ตลาดการเงินโลกคืนที่ผ่านมาเคลื่อนไหวผันผวนหนัก โดยมีแรงขับเคลื่อนหลักจากตัวเลขจ้างงานนอกภาคเกษตร (NFP) เดือนมิถุนายนของสหรัฐฯ ที่ออกมา อ่อนแอกว่าคาดชัดเจน ที่ระดับ +57,000 ตำแหน่ง เทียบกับตัวเลขเดือนก่อนหน้าที่ถูกปรับทบทวนขึ้นเป็น +129,000 ตำแหน่ง ขณะที่อัตราว่างงานลดลงเหลือ 4.2% ซึ่งส่วนหนึ่งมาจากอัตราการมีส่วนร่วมในกำลังแรงงานที่ลดลง สะท้อนภาพตลาดแรงงานสหรัฐฯ ที่กำลังชะลอตัวลงต่อเนื่อง ส่งผลให้ดัชนีดอลลาร์ (DXY) อ่อนค่าลงและตลาดปรับลดคาดการณ์การขึ้นดอกเบี้ยของเฟดในปีนี้ลงอย่างมีนัยสำคัญ
ฝั่งตลาดหุ้นสหรัฐฯ เกิดภาพ Divergence ชัดเจนในกลุ่มเทคโนโลยี ดัชนี Nasdaq ร่วงแรง -479.92 จุด (-1.61%) นำโดยแรงเทขายในกลุ่มเซมิคอนดักเตอร์และอุปกรณ์ผลิตชิป จากความกังวลเรื่อง valuation ที่ตึงตัวและการใช้จ่ายด้าน AI Capex ที่อาจแผ่วลงร่วงหนักถ้วนหน้า ขณะที่หุ้นเทคขนาดใหญ่กลับสวนทางแข็งแกร่ง นำโดย Apple (AAPL) +4.84% สู่ 308.63 ดอลลาร์ หลัง Nikkei Asia รายงานว่า Apple เตรียมเปิดตัว iPhone อย่างน้อย 5 รุ่นในปี 2027 รวมถึงรุ่นพับได้ "iPhone Ultra" ราคาสูงถึง 2,500-3,000 ดอลลาร์ และปรับเป้าผลิตขึ้นเป็น 10 ล้านเครื่อง ด้าน Microsoft +1.62% ยังคงแข็งแกร่ง ส่วน Tesla (TSLA) -7.49% ร่วงแรงสุดในรอบเกือบ 1 ปี แม้ยอดส่งมอบ Q2/2026 จะออกมาดีกว่าคาดที่ 480,126 คัน (+25% YoY เทียบคาด 396,466 คัน) สะท้อนพฤติกรรม "Sell the News" หลังราคาวิ่งขึ้นรับข่าวมาก่อนหน้าแล้ว ด้าน Dow Jones และ DAX กลับปรับขึ้นแรง +1.14% และ +2.16% ตามลำดับ หนุนจากหุ้นกลุ่ม Value/Defensive และแรงซื้อ Rotation ออกจากกลุ่มเทคโนโลยี
ฝั่งไทย แรงซื้อสุทธิจากนักลงทุนต่างชาติกว่า 8,560 ล้านบาท ในวันที่ 2 ก.ค. นำโดยกลุ่ม Defensive Play เป็นปัจจัยหนุนให้เงินบาทแข็งค่า สอดคล้องกับมุมมองของทีมวิจัยที่คาด USDTHB จะเคลื่อนไหวในกรอบ 33.00-33.20 ในวันศุกร์นี้ ขณะที่ราคาทองคำรีบาวด์ขึ้นทดสอบโซน 4,200 ดอลลาร์/ออนซ์ จากแรงหนุนดอลลาร์อ่อนค่าและแรงซื้อสินทรัพย์ปลอดภัย ยังคงเป็นปัจจัยกดดันสินทรัพย์เสี่ยงในระยะสั้น
ทางเทคนิค : ราคาร่วงหลุดกรอบ Uptrend ที่มองไว้ หลังจากตัวเลข NFP ออกมาแย่ ส่งผลให้ดอลลาร์อ่อนค่า คาดการณ์ลงไปวิ่งในโซน 33.00 อีกครั้ง เป็นจุดที่มี Fair value gap จึงมอง bias ลงครับ กลยุทธ์ Short แนวต้านโซน 33.20
Target price 33.00 - 32.90
Cut 33.30 หากรีบาวกลับโซนนี้ ให้ปิด สถานะ short และ wait and see
USDTHB โครงสร้างยังเป็นขาขึ้นระยะสั้น Uptrend channel ชัดด้านปัจจัยพื้นฐาน
-ค่าเงินบาทยังมีโฟลว์ซื้อ จากต่างชาติ หลังจากผลการเลือกตั้งผู้ว่า กทม เป็นไปได้ด้วยดี นำคะแนน โดยชัชชาติ สิทธิพันธ์ ซึ่งอาจเป็น ผู้ว่าต่อในสมัยที่สอง
-หลังจากประกาศเลข ADP Nonfarm ออกมาที่ 98K ตำแหน่ง บ่งชี้ภาคแรงงานที่อ่อนแอลงไป และ PMI ออกมาอยู่โซนขยายตัว แต่ยังอ่อนแอลงกว่าครั้งก่อน ยังเป็นจุดกดดันเงินดอลลาร์เล็กน้อย
แม้ค่ำที่ผ่านมาตลาดหุ้นสหรัฐปรับตัวลงเล็กน้อย นำโดยกลุ่มดัชนี Nasdaq ปรับตัวลงกว่า 4ร้อยจุด ชี้ให้เห็นว่า หุ้นเทคโนโลยีเริ่มมีแรงงานเข้ามาค่อนข้างหน้าแน่น ในขณะที่ DXY ยังสามารถยืน 101.4 จุดได้ เป็นสัญญาณว่าดอลลาร์ยังแข็งแกร่งอยู่เมื่อเทียบกับสกุลท้องถิ่นอื่น
คืนนี้ จับตาดู NonFarm Payrolls ซึ่งคาดการณ์แย่กว่าครั้งก่อน อาจเป็นปัจจัยกดดันดอลลาร์ และมีโอกาสที่นักลงทุน อาจ Priced-In ได้ ก่อนถึงช่วงเวลา
ด้านเทคนิค
โครงสร้างราคาสร้างกรอบขาขึ้นที่ชัดเจน ค่าเงินบาทยังมีโฟลว์ซื้อตลอดสัปดาห์ ทำให้เงินบาทเคลื่อนไหวในโซนแข็งค่าเล็กน้อย แต่เริ่มมีการซื้อที่ลดลง โดยตลาดหุ้นไทยเริ่มมีการขายทำกำไรที่แนวต้าน 1600 ภาย โดย USDTHB ยังมีแนวโน้มปรับตัวขึ้นต่อ หากราคายังไม่เสียโครงสร้าง สามารถ Follow buy ไปยังแนวต้าน 33.50 - 33.75 ด้วยอานิสงค์ของดอลลาร์ที่แข็งค่าขึ้น จากที่ FED มีมุมมอง Hawkish อาจขึ้นดอกเบี้ย จนถึงสิ้นปีนี้
ความเสี่ยง หากเปลี่ยนมุมมองดอกเบี้ย และกระแสซื้อภายในประเทศสูงขึ้น จะเป็นปัจจัยกดดันราคา จุดเสียโครงสร้างคือ หลุด 33.25
Target Price 33.50 - 33.75
Cut 33.25
EURUSD / Euro vs US Dollar Date: Wednesday, July 1, 2026EURUSD / Euro vs US Dollar CFD 1H Technical Outlook
Date: Wednesday, July 1, 2026
Instrument: EURUSD CFD
Timeframe: 1H
Current Price Area: 1.14227
Market Condition: Uptrend / Buy-Side Bias
EURUSD is currently trading around the 1.14227 area on the 1H timeframe. Price has recovered strongly from the previous lower range and is now holding above the Pivot Point at 1.14203, which gives buyers short-term control.
The current structure has shifted from corrective recovery into a more constructive bullish setup. Price is trading above the Dragon structure and maintaining upside pressure near the previous high zone. From a CFD trader’s perspective, the market is showing a buy-side bias, but the current price location is already close to the first resistance zone. That means chasing late entries without confirmation can still carry unnecessary risk.
The key question now is whether buyers can keep price accepted above the pivot and push toward R1 at 1.14439. If price holds above the pivot, the bullish structure remains valid. If price loses the pivot, the short-term buy-side bias may weaken and a pullback toward support can develop.
⸻
Key Levels
Resistance Levels:
* R1: 1.14439
* R2: 1.14593
* R3: 1.14829
Pivot Point:
* Pivot: 1.14203
Support Levels:
* S1: 1.14049
* S2: 1.13813
* S3: 1.13659
⸻
Trading Tool Perspective
The trading assistant tool currently shows:
* Trend: Uptrend
* Main Plan: Buy-side bias
* Guardrail: Avoid counter Sell
* Nearest Key Level: Pivot at 1.14203
* PVA Status: Normal
This confirms that the tool is reading EURUSD with a bullish directional bias. The main plan favors the buy side, while the guardrail warns against counter-trend selling. In practical terms, short positions against this structure should be treated with caution unless price clearly breaks back below the pivot and invalidates the bullish setup.
A sustained move above 1.14439 would support bullish continuation toward 1.14593, with 1.14829 as the next upside reference. If momentum expands with stronger candle structure and better volume confirmation, buyers may continue to control the short-term flow.
On the downside, the pivot at 1.14203 is the immediate decision level. As long as price holds above it, the buy-side structure remains intact. A decisive break below the pivot would reduce bullish pressure and expose S1 at 1.14049. If sellers manage to break S1, the next support zones are 1.13813 and 1.13659.
The cleaner tactical scenarios are:
1. Bullish breakout scenario:
Price breaks and holds above R1 at 1.14439, confirming continuation toward R2 and R3.
2. Pullback-buy scenario:
Price pulls back toward the pivot at 1.14203, holds above it, and forms a bullish rejection structure.
3. Bullish failure scenario:
Price loses the pivot decisively and rotates lower toward S1, weakening the current buy-side bias.
For now, EURUSD remains in an uptrend structure with buy-side control. The preferred approach is to avoid counter-trend selling and wait for either a clean breakout above R1 or a controlled pullback into the pivot area.
⸻
Risk Warning
This analysis is for educational purposes only and does not constitute financial advice, investment advice, or a trading signal. Trading forex CFDs and leveraged products involves significant risk and may not be suitable for all traders. Leverage can amplify both profits and losses. Always define your risk before entering a position, use proper position sizing, and trade only according to your own strategy, capital size, and risk tolerance.
GBPUSD / British Pound Date: Wednesday, July 1, 2026GBPUSD / British Pound vs US Dollar CFD 1H Technical Outlook
Date: Wednesday, July 1, 2026
Instrument: GBPUSD CFD
Timeframe: 1H
Current Price Area: 1.32606
Market Condition: Uptrend / Buy-Side Bias
GBPUSD is currently trading around the 1.32606 area on the 1H timeframe. Price has been building a clear bullish structure after recovering from the previous lower range, and the latest movement shows buyers maintaining control above the Pivot Point at 1.32502.
The market is now trading above the pivot and holding near the previous high zone, which keeps short-term momentum tilted to the upside. From a CFD trader’s perspective, the current structure favors buying continuation or pullback-buy setups rather than trying to fade the move too early.
However, price is also approaching the first resistance zone at R1: 1.32840, so fresh long entries directly into resistance need discipline. The higher-quality setup would be either a clean breakout above R1 or a controlled pullback back toward the pivot where buyers can defend structure.
⸻
Key Levels
Resistance Levels:
* R1: 1.32840
* R2: 1.33023
* R3: 1.33361
Pivot Point:
* Pivot: 1.32502
Support Levels:
* S1: 1.32320
* S2: 1.31982
* S3: 1.31799
⸻
Trading Tool Perspective
The trading assistant tool currently shows:
* Trend: Uptrend
* Main Plan: Buy-side bias
* Guardrail: Avoid counter Sell
* Nearest Key Level: Pivot at 1.32502
* PVA Status: Normal
This confirms that the tool is reading the market with a bullish directional bias. Price is above the pivot, and the main plan supports the buy side. The guardrail also warns against counter-trend selling, which means short setups should be treated with caution unless the bullish structure clearly fails.
A sustained move above 1.32840 would support bullish continuation toward 1.33023, with 1.33361 as the next upside reference. If momentum expands with stronger candle structure and volume confirmation, buyers may continue to control the session.
On the other hand, if price fails to break R1 and pulls back, the key area to monitor is the pivot at 1.32502. As long as price holds above the pivot, the buy-side structure remains valid. A decisive break below the pivot could weaken short-term momentum and expose S1 at 1.32320.
The cleaner tactical scenarios are:
1. Bullish breakout scenario:
Price breaks and holds above R1 at 1.32840, confirming continuation toward R2 and R3.
2. Pullback-buy scenario:
Price pulls back toward the pivot at 1.32502, holds above it, and forms a bullish rejection structure.
3. Bullish failure scenario:
Price loses the pivot decisively and rotates lower toward S1, reducing the strength of the current buy-side bias.
For now, GBPUSD remains in an uptrend structure with buy-side control. The preferred approach is to avoid counter-trend selling and wait for either a breakout above R1 or a pullback into a valid support area.
⸻
Risk Warning
This analysis is for educational purposes only and does not constitute financial advice, investment advice, or a trading signal. Trading forex CFDs and leveraged products involves significant risk and may not be suitable for all traders. Leverage can amplify both profits and losses. Always define your risk before entering a position, use proper position sizing, and trade only according to your own strategy, capital size, and risk tolerance.
GBPUSD / British Pound Date: Monday, June 29, 2026GBPUSD / British Pound vs US Dollar CFD 1H Technical Outlook
Date: Monday, June 29, 2026
Instrument: GBPUSD CFD
Timeframe: 1H
Current Price Area: 1.32108
Market Condition: Sideways / Pivot Reclaim Attempt
GBPUSD is currently trading around the 1.32108 area on the 1H timeframe. Price has recovered from the recent lower range and is now trading slightly above the Pivot Point at 1.32086. This shows that buyers are attempting to regain short-term control, but the broader structure is still not strong enough to classify as a clean bullish trend.
The market remains compressed inside a sideways structure. The first major upside barrier is R1 at 1.32285, which sits close to the recent swing high area. Until GBPUSD breaks and holds above that level, the current move should be treated as a short-term recovery inside a range rather than a confirmed trend continuation.
From a CFD trader’s perspective, this is a tactical zone. Chasing price directly into resistance carries weak risk-to-reward. A cleaner setup would come from either a confirmed breakout above R1 or a controlled pullback back toward the pivot area.
⸻
Key Levels
Resistance Levels:
* R1: 1.32285
* R2: 1.32636
* R3: 1.32835
Pivot Point:
* Pivot: 1.32086
Support Levels:
* S1: 1.31734
* S2: 1.31535
* S3: 1.31184
⸻
Trading Tool Perspective
The trading assistant tool currently shows:
* Trend: Sideways
* Main Plan: Sideways
* Guardrail: Wait for breakout or pullback
* Nearest Key Level: Pivot at 1.32086
* PVA Status: Normal
This confirms that GBPUSD is not yet in a high-conviction trending phase. Price is holding above the pivot, but the tool still reads the broader condition as sideways, and volume remains normal. That means confirmation is more important than prediction.
A sustained break above 1.32285 would strengthen the bullish recovery case and could open a move toward 1.32636, with 1.32835 as the next upside reference. However, if price fails to hold above the pivot and rotates lower, the market could retest S1 at 1.31734.
The cleaner tactical scenarios are:
1. Bullish breakout scenario:
Price breaks and holds above R1 at 1.32285, supported by stronger candle structure and volume confirmation.
2. Pullback-buy scenario:
Price pulls back toward the pivot at 1.32086, holds above it, and forms a bullish rejection structure.
3. Bearish failure scenario:
Price loses the pivot decisively and rotates back toward S1 at 1.31734.
For now, GBPUSD remains in a sideways market condition with a short-term bullish attempt above the pivot. The key confirmation level is R1. Until that level is cleared, patience and risk control remain the priority.
⸻
Risk Warning
This analysis is for educational purposes only and does not constitute financial advice, investment advice, or a trading signal. Trading forex CFDs and leveraged products involves significant risk and may not be suitable for all traders. Leverage can amplify both profits and losses. Always define your risk before entering a position, use proper position sizing, and trade only according to your own strategy, capital size, and risk tolerance.
EURUSD / Euro vs US Dollar l Date: Monday, June 29, 2026EURUSD / Euro vs US Dollar CFD 1H Technical Outlook
Date: Monday, June 29, 2026
Instrument: EURUSD CFD
Timeframe: 1H
Current Price Area: 1.13823
Market Condition: Downtrend / Sell-Side Bias
EURUSD is trading around the 1.13823 area on the 1H timeframe after a short corrective bounce from the recent lower range. The broader market structure remains bearish, with price previously forming a clear sequence of lower highs and lower lows.
The current price action is sitting below the pivot area and still trading under the broader dynamic structure. From a CFD trader’s perspective, this remains a sell-side market unless price can reclaim and hold above the pivot with strong confirmation.
The trading tool is also showing a Downtrend condition with a Sell-side bias, which means counter-trend buying should be treated with caution. At this stage, buying into strength without confirmation would carry poor risk-to-reward because the dominant structure still favors sellers.
⸻
Key Levels
Resistance Levels:
* R1: 1.14252
* R2: 1.14694
* R3: 1.14960
Pivot Point:
* Pivot: 1.13986
Support Levels:
* S1: 1.13544
* S2: 1.13278
* S3: 1.12836
⸻
Trading Tool Perspective
The trading assistant tool currently shows:
* Trend: Downtrend
* Main Plan: Sell-side bias
* Guardrail: Avoid counter BUY
* Nearest Key Level: Pivot at 1.13986
* PVA Status: Normal
This suggests the market is still structurally bearish, but current volume is not showing extreme participation. The main tactical focus is whether EURUSD can reject from the pivot zone or reclaim it.
A rejection below 1.13986 keeps the downside scenario active, with 1.13544 as the first support target. If sellers maintain pressure below S1, the next downside references are 1.13278 and 1.12836.
On the other hand, if EURUSD breaks and holds above the pivot, short-term bearish momentum may weaken, and price could rotate toward 1.14252. However, as long as price remains below the resistance structure, the higher-probability bias stays with sell-side continuation.
The cleaner tactical scenarios are:
1. Bearish continuation scenario:
Price rejects the pivot area and breaks back toward S1 at 1.13544.
2. Pullback-sell scenario:
Price retests the pivot or R1, fails to hold above resistance, and prints bearish confirmation.
3. Invalidation / recovery scenario:
Price closes above the pivot and holds above R1, reducing the strength of the current sell-side bias.
For now, EURUSD remains under bearish pressure. The preferred approach is to avoid counter-trend buying and wait for either a clean rejection from the pivot or a confirmed breakdown toward support.
⸻
Risk Warning
This analysis is for educational purposes only and does not constitute financial advice, investment advice, or a trading signal. Trading forex CFDs and leveraged products involves significant risk and may not be suitable for all traders. Leverage can amplify both gains and losses. Always define your risk before entering a position, use proper position sizing, and trade only according to your own strategy, capital size, and risk tolerance.
USDJPY June 25 , 2026 USDJPY M30 Chart Analysis
Overall bias: Bullish / Buy-side bias
The Dragon Flow panel shows:
Item Reading
Price 161.821
Trend Uptrend
Pivot 161.784
Main Plan Buy-side bias
Guardrail Avoid counter Sell
Price is currently above Pivot 161.784, and the short-term structure is still bullish. This is a cleaner buy-side setup than EURUSD.
⸻
Market Structure
USDJPY has been forming higher highs and higher lows on M30. There was a sharp liquidity sweep down near 161.55–161.60, followed by a strong recovery. That tells us buyers defended the lower zone aggressively.
Observation Meaning
Price above Pivot Buyers still have control
Price above moving averages Bullish momentum remains active
Recent strong recovery from wick low Demand appeared near lower support
Price now near R1 Do not chase blindly
The trend is bullish, but current price is already close to resistance, so the best entries are either pullback buys or breakout-retest buys.
⸻
Key Resistance Levels
Level Meaning
161.881 R1 / immediate upside target
161.937 R2
162.034 R3 / major short-term target
The nearest resistance is 161.881. Price needs to break and hold above this level to continue cleanly toward 161.937–162.034.
⸻
Key Support Levels
Level Meaning
161.784 Pivot / main intraday support
161.728 S1
161.700–161.728 Gap / support zone
161.631 S2
161.575 S3
The most important buy zone is:
161.728–161.784
If price pulls back into this area and rejects, it gives a cleaner buy setup.
⸻
Trading Plan
Plan A: Buy Pullback
Best buy zone:
161.728–161.784
Buy confirmation:
* Bullish rejection candle
* Long lower wick
* Bullish engulfing
* M30 candle closes back above 161.784
* Price holds above the moving averages
Targets:
Target Level
TP1 161.881
TP2 161.937
TP3 162.034
Stop-loss idea:
* Conservative SL: below 161.728
* Wider SL: below 161.631
⸻
Plan B: Breakout Buy
If price breaks above 161.881:
1. Wait for a retest of 161.881
2. If price holds above it, look for buy continuation
3. Target 161.937
4. Next target 162.034
This is better than buying directly into resistance.
⸻
When Bullish Bias Becomes Invalid
The buy-side view weakens if:
1. Price closes M30 below 161.784
2. Price breaks below 161.728
3. Price loses 161.631
If price breaks below 161.631, the bullish structure is damaged and USDJPY may rotate lower toward 161.575 or below.
⸻
Straight Conclusion
USDJPY M30 is currently bullish.
Best plan:
* Buy zone: 161.728–161.784
* Breakout buy: Above 161.881, then retest hold
* Main targets: 161.881 → 161.937 → 162.034
* Avoid counter-trend sells unless price breaks below Pivot and S1 clearly
Current view: Bullish continuation, but avoid chasing directly under R1. Wait for pullback or confirmed breakout.
EURUSD June 25 , 2026 EURUSD H1 Chart Analysis
Overall read: Bearish trend, but current setup is mixed.
The Dragon Flow panel shows:
Item Reading
Price 1.13543
Trend Downtrend
Pivot 1.13523
Main Plan Mixed signal
Guardrail Wait below Pivot
Price is currently slightly above Pivot 1.13523, so this is not a clean sell entry yet. The broader H1 trend is still bearish, but the short-term price action is consolidating around the pivot.
⸻
Market Structure
EURUSD had a strong selloff from the upper zone around 1.1450 down to the 1.1325–1.1330 area. After that, price bounced and is now moving sideways near 1.1350–1.1365.
Observation Meaning
Main H1 structure is still lower highs / lower lows Bearish trend remains
Price bounced from recent low Sellers are losing short-term momentum
Price is around Pivot Market is indecisive
Dragon Flow says “Mixed signal” Do not force entry
This pair is less clean than GOLD and SILVER. GOLD/SILVER had clearer sell-side bias. EURUSD needs confirmation.
⸻
Key Resistance Levels
Level Meaning
1.13634–1.13695 Immediate resistance / recent reaction high
1.13688 R1
1.13842 R2
1.14007 R3
1.13968–1.14000 Larger resistance area
The most important short-term sell zone is:
1.13630–1.13690
If price rejects this zone, sell continuation becomes valid again.
⸻
Key Support Levels
Level Meaning
1.13523 Pivot
1.13369 S1
1.13204 S2
1.13050 S3
The key level to watch now is 1.13523.
If price falls back below this level and holds below it, sellers regain control.
⸻
Trading Plan
Plan A: Sell Below Pivot
This is the cleaner bearish setup.
Sell condition:
* Price closes below 1.13523
* Retest of Pivot fails
* Bearish rejection candle appears
Entry zone: around 1.13520–1.13540 after failed retest
Targets:
Target Level
TP1 1.13369
TP2 1.13204
TP3 1.13050
Stop-loss idea:
* Above 1.13630
* Wider SL above 1.13690
⸻
Plan B: Sell from Resistance
If price pushes higher first, do not chase. Wait for rejection.
Sell zone:
1.13630–1.13690
Confirmation:
* Bearish engulfing
* Long upper wick
* Failed breakout above R1
* H1 candle closes back below 1.13630
Targets:
* TP1: 1.13523
* TP2: 1.13369
* TP3: 1.13204
Stop-loss:
* Above 1.13720
* Wider stop above 1.13842
⸻
Plan C: Buy Only After Breakout
Buy is not the main plan, but it becomes valid if price confirms strength.
Buy condition:
* H1 candle closes above 1.13688
* Price holds above R1
* Pullback does not break back below 1.13630
Targets:
Target Level
TP1 1.13842
TP2 1.14007
Stop-loss:
* Below 1.13523
* Aggressive SL below 1.13630
⸻
Straight Conclusion
EURUSD H1 is not a clean immediate sell yet.
Best action:
* Wait below Pivot 1.13523 for sell confirmation.
* Best sell zone above price: 1.13630–1.13690
* Downside targets: 1.13369 → 1.13204 → 1.13050
* Buy only if price breaks and holds above 1.13688
Current view: Bearish trend, but short-term mixed. Avoid entering inside the pivot chop zone.