Elliott Wave Basics📌 Overview
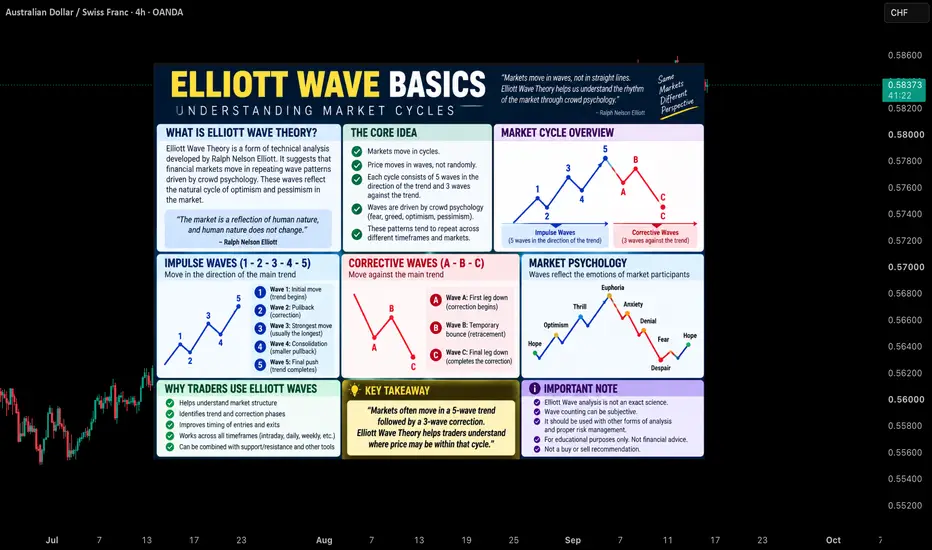
Elliott Wave Theory is a method of technical analysis developed by Ralph Nelson Elliott. The theory suggests that financial markets move in repetitive wave patterns driven by crowd psychology and investor sentiment. These recurring patterns help traders understand market cycles, trend development, and corrective phases within price action.
---------------------------------------------------------------
📘 Definition
Elliott Wave Theory states that markets move in recognizable wave structures that reflect the collective emotions of market participants.
A complete market cycle generally consists of:
Impulse Waves (1-2-3-4-5) – Five waves moving in the direction of the primary trend.
Corrective Waves (A-B-C) – Three waves moving against the prevailing trend.
Market Cycle – The complete sequence of an impulse phase followed by a corrective phase.
Crowd Psychology – Market movements influenced by optimism, fear, greed, and uncertainty.
Wave Structure – The recurring pattern that forms trends and corrections across all timeframes.
Fractal Nature – Elliott Wave patterns can appear within larger and smaller wave structures.
---------------------------------------------------------------
📌 Key Points
• Markets move in waves rather than straight lines.
• A complete cycle consists of 5 impulse waves and 3 corrective waves.
• Impulse waves move with the trend.
• Corrective waves move against the trend.
• Wave patterns reflect crowd psychology and market sentiment.
• Elliott Wave structures can be found on all timeframes.
• The theory helps traders understand where price may be within a market cycle.
---------------------------------------------------------------
📊 Chart Explanation
• The chart illustrates a complete Elliott Wave market cycle.
• Waves 1, 3, and 5 represent the primary trend movement and are known as Impulse Waves.
• Waves 2 and 4 represent temporary pullbacks within the larger trend.
• After the completion of Wave 5, the market typically enters a corrective phase labeled A-B-C.
• Wave A begins the correction, Wave B forms a temporary retracement, and Wave C completes the corrective structure.
• The diagram also highlights how market psychology evolves throughout the cycle, from optimism and confidence to fear and uncertainty.
• The example is an educational illustration designed to explain the basic concepts of Elliott Wave Theory.
---------------------------------------------------------------
📉 Summary
Elliott Wave Theory provides a structured framework for understanding market cycles. The theory proposes that markets often progress through a five-wave trend phase followed by a three-wave corrective phase. Recognizing these patterns can help traders better interpret market structure and price behavior.
---------------------------------------------------------------
💡 Why It Matters
• Helps traders understand overall market structure.
• Provides insight into trend and correction phases.
• Improves awareness of crowd psychology.
• Assists in identifying potential stages of a market cycle.
• Can be combined with support, resistance, trendlines, and other technical tools.
• Builds a foundation for more advanced Elliott Wave analysis.
---------------------------------------------------------------
📌 Conclusion
Elliott Wave Theory remains one of the most widely recognized market cycle models in technical analysis. By understanding the relationship between impulse waves, corrective waves, and crowd psychology, traders can develop a deeper understanding of how markets often move through recurring cycles.
---------------------------------------------------------------
⚠️ Disclaimer
📘 For educational purposes only.
🙅 Not SEBI registered.
❌ Not a buy/sell recommendation.
🧠 Purely a learning resource.
📊 Not Financial Advice. EURUSD: The Pressure Is Building — A Bigger Drop Could Be NextEURUSD is still trading with a clear bearish bias , supported by both the current macro environment and the technical structure on the H1 chart.
From a macro perspective, the U.S. dollar continues to have the advantage. Markets are pricing a high probability of a 25-basis-point Fed rate hike , while elevated U.S. Treasury yields continue to support the dollar. EURUSD has consequently remained under pressure ahead of the Fed decision. The ECB’s recent tightening provides some support for the euro, but in the short term, Fed expectations and U.S. yields remain the stronger drivers for this pair.
Technically, the picture is particularly interesting. Following the strong sell-off, EURUSD has formed what looks like a symmetrical triangle on the H1 timeframe , with price becoming increasingly compressed between descending resistance and rising support. Because this pattern is developing after a strong bearish move , I see it more as a potential continuation structure than an early signal of reversal. Price also remains below the Ichimoku Cloud, reinforcing the broader bearish trend.
The key now is the lower boundary of the triangle. If EURUSD produces a clean bearish breakout , the compression could release into another strong selling wave, with the 1.1490 area becoming the next downside target. Until price breaks above the triangle and successfully reclaims the Ichimoku resistance, I continue to favor SELL opportunities and expect the broader downtrend to remain in control . Liquidity Explained📌 Overview
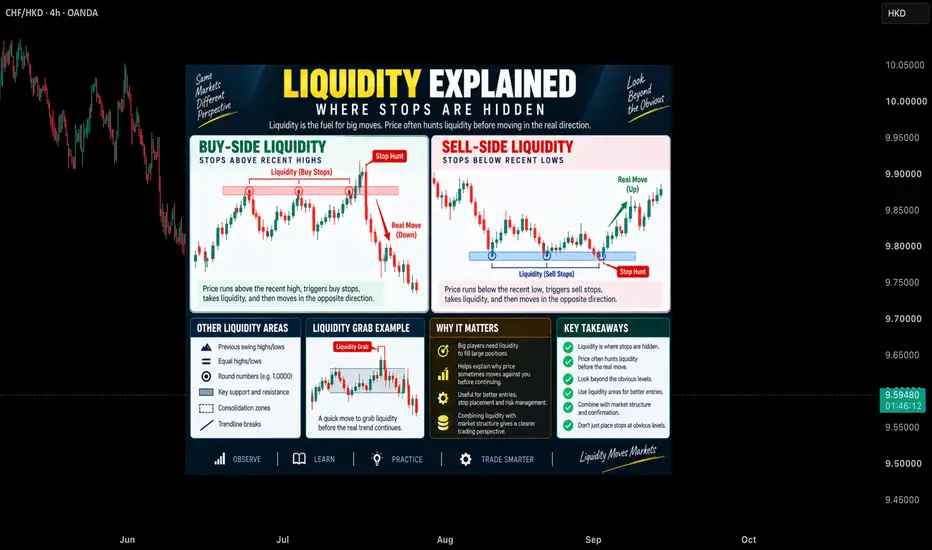
Liquidity refers to areas in the market where a large number of pending orders and stop-losses are concentrated. These zones often attract price because market participants seek liquidity to execute orders efficiently. This educational infographic explains Buy-Side Liquidity, Sell-Side Liquidity, Liquidity Grabs, and why understanding liquidity can help traders better interpret market behavior.
___________________________________________________________
📘 Definition
Liquidity is the availability of orders in the market that allows transactions to occur efficiently. In technical analysis, liquidity is commonly found around previous highs, previous lows, equal highs, equal lows, support, resistance, and other obvious price levels.
Buy-Side Liquidity – Areas above recent highs where buy stop orders and short-seller stop-losses may accumulate.
Sell-Side Liquidity – Areas below recent lows where sell stop orders and long-position stop-losses may accumulate.
Liquidity Grab – A temporary move into a liquidity zone where price collects available orders before potentially moving in another direction.
Stop Hunt – A market movement that reaches areas where many stop-loss orders are clustered.
Liquidity Zone – A price area where a significant number of orders are expected to be located.
Market Participants – Traders and institutions whose orders contribute to market liquidity.
___________________________________________________________
📌 Key Points
• Liquidity often exists around obvious swing highs and swing lows.
• Price may react strongly when liquidity areas are reached.
• Buy-Side Liquidity is commonly located above previous highs.
• Sell-Side Liquidity is commonly located below previous lows.
• Liquidity Grabs can occur before a larger market movement.
• Liquidity should be combined with market structure and confirmation.
• Liquidity concepts help traders understand price behavior, not predict future outcomes.
___________________________________________________________
📊 Chart Explanation
• The Buy-Side Liquidity example highlights how price can move above recent highs where buy stops may be clustered.
• The Sell-Side Liquidity example shows how price can move below recent lows where sell stops may be located.
• The Liquidity Grab example demonstrates a temporary move into a liquidity zone before a potential market reaction.
• The infographic identifies common liquidity locations including swing highs, swing lows, support, resistance, consolidation zones, and trendline areas.
• The examples are educational illustrations intended to explain liquidity concepts and market mechanics.
___________________________________________________________
📉 Summary
Liquidity is an important concept in market analysis because it helps explain why price frequently reacts around certain levels. Understanding Buy-Side Liquidity, Sell-Side Liquidity, and Liquidity Grabs can provide additional context when studying market structure and price action.
___________________________________________________________
💡 Why It Matters
• Helps identify areas where price may attract order flow.
• Improves understanding of market behavior.
• Explains why price may move beyond obvious levels.
• Encourages traders to look beyond simple support and resistance.
• Supports a more structured approach to market analysis.
• Builds a stronger foundation for learning advanced trading concepts.
___________________________________________________________
📌 Conclusion
Liquidity plays a significant role in how markets move. By understanding where liquidity is commonly located and how price may interact with these areas, traders can develop a deeper understanding of market structure and price action behavior.
___________________________________________________________
⚠️ Disclaimer
📘 For educational purposes only.
🙅 Not SEBI registered.
❌ Not a buy/sell recommendation.
🧠 Purely a learning resource.
📊 Not Financial Advice.
GBPNZD 4H Short Setup | Supply Rejection & Mean-Reversion ThesisGBP/NZD 4H — Short Setup | Supply Rejection & Mean-Reversion Thesis
Trade Structure
Bias: Bearish
Instrument: GBP/NZD
Timeframe: 4H
Entry: 2.32679
Stop: 2.33354
Target: 2.31750
R-Score: 2.27
Investment Thesis
GBP/NZD is trading into a well-defined 4H supply zone following an extended upside impulse. The current price location presents a favorable tactical opportunity to express a short bias, provided the market confirms seller absorption and a subsequent loss of bullish structure.
The setup is based on a simple premise:
Price has delivered into overhead supply. If demand fails to support further upside at this location, the next logical repricing is toward the underlying support and liquidity zone.
The trade is therefore not predicated on calling an exact market top. It is a location-driven short with predefined structural invalidation, seeking to monetize a potential mean-reversion move following an extended upside auction.
Market Structure
The recent GBP/NZD advance has been characterized by a sequence of higher highs and higher lows, accompanied by increasing participation as price moved toward the upper end of the current range.
That bullish structure has now delivered price directly into the 2.3286–2.3335 supply region.
This creates an important inflection point.
At current levels, the risk/reward profile of initiating fresh longs becomes less attractive because price is approaching an area where historical selling pressure is expected to emerge.
Conversely, a confirmed failure to auction higher creates an opportunity to position for a rotation back into the lower part of the recent range.
Supply & Liquidity
The 2.3286–2.3335 region is the primary supply area for this thesis.
This zone represents the area where the market is expected to encounter meaningful overhead inventory.
The upper boundary around 2.3335 is particularly important.
A sustained acceptance above this level would indicate that the market has successfully absorbed the available supply and that the bearish thesis is no longer valid.
Until that occurs, the area remains a potential distribution / rejection zone.
Imbalance / FVG
The recent upside displacement has left an identifiable fair value gap (FVG) within the price delivery.
From a market-structure perspective, this provides an additional reference point for a potential retracement.
If the supply zone produces a rejection, the market does not need to immediately reverse into a full-scale downtrend.
A more realistic base case is:
Supply interaction → failure to extend → bearish displacement → imbalance retracement → continuation toward support.
The FVG therefore functions as part of the expected path of price rather than being treated as an independent entry signal.
Volume & Participation
The volume profile provides additional context.
Participation has increased as GBP/NZD advanced toward the upper portion of the structure.
This is important because the market is not reaching supply after an inactive, low-participation drift.
The current area is being tested following a period of expansion and increased market participation.
The key question is therefore whether that participation produces continued price acceptance above supply or absorption followed by rejection.
If buyers fail to generate additional upside despite elevated participation, that would strengthen the bearish interpretation.
Trade Expression
Short Entry — 2.32679
The position is designed to express the bearish thesis from within the supply region rather than chase price after a downside move has already occurred.
The objective is to establish exposure while the market is still close to the structural invalidation point.
This creates a clearly defined asymmetric trade:
Known risk above supply → potential repricing toward support.
Risk Management
Stop Loss — 2.33354
The stop is positioned above the identified supply region.
This is a thesis-based stop, not an arbitrary distance from entry.
If GBP/NZD trades through the supply zone and establishes acceptance above 2.3335, the market is providing evidence that the anticipated seller response is not materializing.
At that point, the original trade thesis is invalidated.
There is no reason to remain structurally committed to a short position after the market has invalidated the premise on which the position was established.
Downside Objective
Take Profit — 2.31750
The primary objective is the 2.3150–2.3175 support zone.
This area represents the opposing structural reference and provides a logical destination for a short-term mean-reversion trade.
The thesis does not require GBP/NZD to establish a larger bearish trend.
The trade only requires sufficient downside repricing from the supply region into the underlying support.
Expected Price Path
The preferred scenario is:
2.3286–2.3335 Supply
↓
Seller Absorption / Rejection
↓
Bearish Displacement
↓
Break of Short-Term Structure
↓
FVG / Imbalance Repricing
↓
2.3175 Support
This is the path that would validate the trade.
Confirmation Framework
The supply zone itself is not the complete signal.
The highest-quality outcome would be evidence that buyers are unable to sustain the auction above the supply region, followed by a meaningful bearish displacement.
The critical distinction is:
> Supply provides the location.
> Structure provides the confirmation.
A simple wick into supply without follow-through is not sufficient confirmation.
Conversely, a decisive rejection followed by a break of short-term bullish structure materially improves the probability of a downside rotation.
Invalidation
The bearish thesis is invalidated by sustained acceptance above 2.3335.
A temporary liquidity sweep above the level does not automatically invalidate the setup.
What matters is whether price can reclaim, hold, and continue trading above the supply zone.
If that occurs, the market is effectively communicating that available supply has been absorbed and that the prior bearish assumption is incorrect.
No averaging down. No widening the stop. No thesis modification after invalidation.
The predefined risk level exists to eliminate that discretion.
Trade Management
Once the position moves in the anticipated direction, management should be driven by price behavior rather than emotion.
The preferred outcome is a clean bearish repricing away from supply.
If price fails to produce downside displacement and instead continues consolidating around the entry area, the expected trade efficiency deteriorates.
The position should therefore be evaluated based on whether the market continues to confirm the original thesis.
Why This Trade Exists
This is fundamentally a risk-defined tactical short at a structurally unfavorable location for fresh longs.
The trade is not based on:
* guessing the top,
* predicting a crash,
* selling simply because price is overextended,
* or relying on a single candlestick pattern.
It is based on the convergence of:
Supply + Liquidity + Price Extension + Imbalance + Volume Expansion + Structural Invalidation + Defined Downside Objective.
The edge comes from where the position is established and how risk is defined, not from certainty about the next candle.
Final Trade Thesis
GBP/NZD is approaching a significant 4H supply region after an extended upside expansion. I am looking for evidence that the market cannot sustain acceptance above this area and that sellers regain control following the supply interaction.
The tactical objective is a rotation from the 2.3286–2.3335 supply region toward the 2.3150–2.3175 support zone.
The thesis remains valid below 2.3335 and is invalidated by sustained acceptance above that level.
Trade: Short 2.32679
SL: 2.33354
TP: 2.31750
R-Score: 2.27
> The objective is not to predict the market. The objective is to define an asymmetric opportunity, identify the conditions that validate the thesis, and know precisely when the thesis is wrong.
Rayen | Independent Market Research
Quantitative research • Risk & performance analytics
Independent analysis of financial markets, trading strategies, market behaviour and risk. Research is based on historical data, quantitative methods and observed market structure.
Disclaimer: All content is provided for educational and informational purposes only. It is not investment advice, a recommendation, solicitation, or an offer to buy or sell any financial instrument. Trading and investing involve substantial risk, and past performance or research results do not guarantee future results. Readers are responsible for their own investment decisions and risk management.
#GBPNZD #Forex #FX #PriceAction #MarketStructure #SupplyAndDemand #Liquidity #FVG #RiskManagement #TradingSetup #TechnicalAnalysis