AUDJPY SELL SETUP🚨 AUDJPY SELL SETUP 🚨
📍 Supply Zone Rejection
⚡ Clean Institutional Level
🐻 Sellers Waiting at Premium Price
💡 Trade Plan:
➡️ Price taps supply zone
➡️ Rejection confirmation candle
➡️ Execute SELL with discipline
🎯 Target:
📉 Previous Demand / Liquidity Sweep
🛑 Stop Loss:
🔺 Above Supply Invalidity Level
⚖️ Risk Management:
✅ 1–2% Risk Only
✅ Patience Before Entry
❌ No FOMO Trades
🧠 “The market rewards patience, not prediction.”
📊 Strategy:
Zone + Confirmation + Execution
Forex market
AUDCAD BUY SETUP🚨 AUDCAD BUY SETUP 🚨
📍 Demand Zone Reaction Trade
💥 Strong Bounce from Key Level
📊 Market Showing Buyer Strength
💡 Entry Plan:
➡️ Price returns to demand zone
➡️ Wait for rejection confirmation
➡️ Execute BUY with discipline
🎯 Target:
📈 Previous High / Liquidity Area
🛑 Stop Loss:
🔻 Below Strong Support Zone
⚖️ Risk Rule:
✅ Only 1–2% Risk
❌ No emotional trading
🧠 “I trust my zone, not the noise.”
EURUSD Rejection at Supply – Bearish Continuation in PlayEURUSD has pushed into a key resistance zone and is now showing signs of rejection, aligning with the broader bearish structure. The move up appears corrective after breaking out of the descending channel, but price is still forming lower highs overall, keeping downside pressure intact.
The current zone acts as a strong supply area where sellers are stepping back in. A lack of strong follow-through above resistance suggests a potential fake breakout or liquidity grab above recent highs. This increases the probability of a reversal rather than sustained bullish continuation.
If price fails to hold above this level, we can expect a pullback toward lower demand zones, targeting liquidity below. However, a clean break and acceptance above resistance would invalidate the bearish bias and shift momentum in favor of buyers.
For now, the market remains in a decision zone — rejection favors selling, while breakout confirmation is required for bullish continuation.
EURUSD – Short Trade Idea📍 Entry: 1.17394 (Sell)
🛡️ Stop-Loss: 1.17560 (16.6 pips)
🎯 Take-Profit: 1.17049 (34.5 pips)
📈 Bias: Bearish Rejection From Premium Zone
Price has tapped into a higher-timeframe premium zone / supply, showing signs of exhaustion after sweeping liquidity above the previous strong high.
The market also retested a break of structure level and reacted bearish from the mitigation area.
📉 Trade Reasoning
Price swept the strong high → liquidity grab
Price entered the premium supply zone
Reaction from mitigation of trendline break
Clear risk-to-reward ~1:2.1
TP set near the equilibrium / discount zone
📝 Trade Setup Summary
Look for continuation to the downside
Protect the trade if price returns back inside the supply zone
Ideal for intraday to short-swing timeframe
USD/CHF – 4H Supply Rejection | Staggered Sell LimitsThis setup reflects a multi-timeframe, liquidity-based approach using passive execution (sell limits) aligned with institutional supply zones and session-driven volatility.
Context (HTF Bias):
Price is currently trading within a broader 1D demand zone, but has retraced into a well-defined 4H supply region nested inside a larger bearish structure. The descending trendline overhead reinforces directional pressure and suggests continuation potential after mitigation of supply.
LTF Alignment:
Within the 4H supply, a 30M supply zone provides refined entry precision. The recent market structure shift (MSS) to the downside confirms short-term bearish intent following a corrective rally.
Execution Model:
Rather than chasing price, I’ve deployed staggered sell limit orders across the 4H supply zone. This allows:
* Improved average entry price
* Reduced slippage
* Passive participation at key liquidity levels
Risk Management:
* Fixed fractional model: 1% risk per trade idea
* Positions are distributed across the zone to optimize fill efficiency
* Invalidation sits above the supply structure
Targets:
Primary objective is a return into the 1D demand imbalance, with partials taken at intermediate inefficiencies and prior lows.
Trade Logic Summary:
* HTF demand + LTF supply = internal rebalancing
* Entry at premium pricing within supply
* Confluence: trendline resistance + MSS + session timing
* Execution during London/New York sessions only
Key Insight:
This is not a breakout trade. It’s a liquidity-based mean reversion entry within a broader range, exploiting inefficient pricing at supply before continuation.
---
Disclaimer: This is a discretionary trade idea based on personal analysis and risk framework. Not financial advice.
EURUSD: Discount Grab Before Repricing HigherDowntrend on the surface. Accumulation underneath.
EURUSD has been printing lower lows, keeping the bearish narrative alive. But zoom in… and you’ll notice something different now.
Price has tapped into a clean discount zone, swept sell-side liquidity, and is starting to show reaction where it actually matters.
This isn’t random buying.
This is positioning.
Current structure:
Sell-side liquidity taken below equal lows
Reaction from higher-timeframe demand
Early shift in short-term order flow
What I’m anticipating:
A controlled pullback into nearby inefficiency, followed by continuation to the upside targeting premium liquidity.
That green zone above?
That’s the draw.
Key concept:
Reversals don’t begin with strength.
They begin with the end of selling pressure.
USDCHF_H1USDCHF has delivered a clean bullish leg and tapped into a premium array, leaving behind a well-defined H1 FVG. Now we’re at a decision point where most participants start forcing bias instead of reading delivery.
Here’s the framework:
Price is currently reacting inside the imbalance.
If this FVG holds, continuation higher remains valid.
But if price accepts below it, the narrative shifts completely.
My expectation:
Failure to hold the H1 FVG
Weak reaction / no displacement
Breakdown through short-term structure
Expansion towards draw on liquidity below
EURUSD lates structure on 4 hrThe 4 hr chart on EURUSD seems is forming structures for upside and downside both. An upside to target break of the last high of 1.1850x and then downside after the break of 1.1850 from somewhere around 1.1900x
As you can see the support on the chart from where price can bounce and cross the 1.1850 high and the resistance around 1.1900 from where EURUSD should turn down to up to .1500-1.1400.
Look out for setups at these levels per your own trading strategies. I am sharing my analysis and thoughts, this doesn't constitute and investment advice.
EUR/GBP Intraday Long Setup (30M) – Higher Low ContinuationThe chart shows a developing bullish structure on EUR/GBP after a period of consolidation. Price action has formed a higher low followed by a series of higher highs, indicating a potential shift toward short-term upside momentum.
After a sharp impulsive move upward, price pulled back in a controlled manner, respecting a rising trendline. This corrective phase suggests accumulation rather than distribution, with buyers stepping in at higher levels.
Trade Idea:
Entry: Around 0.8663 (near current price and trendline support)
Stop Loss: 0.8650 (below recent swing low, protecting against structure breakdown)
Target: 0.8684 (previous resistance zone / projected continuation area)
The risk-to-reward ratio remains favorable, with the setup aiming to capitalize on continuation after a pullback. A break and hold above minor resistance strengthens the bullish bias.
Key Observations:
Trendline support holding firm
Higher low structure intact
Momentum building after consolidation
Clean risk management with defined invalidation level
As long as price maintains above the stop-loss zone, the bullish scenario remains valid. A breakdown below would invalidate the setup and suggest further range or downside movement.
EURJPY Short Trade SetupPair: EURJPY
Direction: Sell / Short
Entry: 186.970
Stop Loss: 187.178 (20.8 pips risk)
Take Profit: 186.359 (61.1 pips reward)
Risk-to-Reward Ratio: 1 : 2.94 ✅
Trade Thesis:
EURJPY is showing rejection near intraday premium supply zone after a corrective move into resistance. Price tapped higher liquidity levels and failed to sustain above the zone, suggesting sellers defending the area. Momentum favors a downside rotation back toward discount / equilibrium support.
Confluence:
Rejection from resistance / supply zone
Lower timeframe weakness after liquidity sweep
Short aligned with mean reversion from premium pricing
Clean RR near 1:3
Execution Plan:
Enter short at market / confirmation near 186.970
Invalidate if price closes above SL zone
Partial profits can be booked near 186.600
Hold runner to 186.359 final TP
Risk Management:
Risk only fixed % of capital (1% preferred). Do not widen stop.
Trader Mindset:
This is a probability play, not certainty. Let edge play out. One clean execution matters more than forcing multiple trades.
GBPUSD MTFAHello traders, here is the full multi-timeframe analysis for this pair. Let me know in the comment section below if you have any questions. The position will be taken only if all rules of the strategies are satisfied. Wait for more price action to develop before taking any position. I suggest you keep this pair on your watchlist and see if the rules of your strategy are satisfied.
🧠💡 Share your unique analysis, thoughts, and ideas in the comments section below. I'm excited to hear your perspective on this pair.
💭🔍 Don't hesitate to comment if you have any questions or queries regarding this analysis.
EURUSD Trade Breakdown 27th AprilEURUSD Trade Breakdown | 27th April | Smart Money Perspective
This wasn’t a random move.
It was a setup.
In this video, I break down a EURUSD trade from 27th April using ICT and Smart Money concepts, focusing on how liquidity was engineered before the move actually played out.
No indicators. No guessing.
Just structure, liquidity, and execution.
What you’ll see inside:
How price reacted around a key demand zone
Why the pullback wasn’t bearish… it was inducement
The logic behind the entry and targeting external liquidity
How market structure and liquidity aligned for a clean move
The idea behind the trade
Most traders see movement and react.
But the real edge comes from understanding why price moves in the first place.
In this setup, price was simply doing what it always does:
Build liquidity → take liquidity → expand
Once you start seeing that clearly, trading becomes less emotional and more… mechanical.
Quick note
This is not about being right on every trade.
It’s about being aligned with the intent behind price.
GBPJPY – Sell Setup High-Probability Reversal Trade🔥 Trade Setup
Entry: 215.854
Stop Loss: 34 pips
Take Profit: 70.7 pips
Risk–Reward: ≈ 1:2.07 (solid RRR)
🎯 Target Explanation
TP aligns with:
Next clean liquidity zone
Previous structure imbalance
Fair value gap area
🛡️ Stop Loss Justification
SL sits safely above:
Liquidity sweep
Supply zone high
Recent candle structure
📌 Bias: SELL
GBPJPY has tapped into a premium zone, reacting strongly from previously identified supply.
Price is showing exhaustion after sweeping liquidity above recent highs.
🧠 Reasoning
Price entered a higher-timeframe supply zone and rejected.
Clear liquidity grab above the previous swing high.
Strong bearish reaction showing displacement.
Market is likely to retrace back toward equilibrium / demand below.
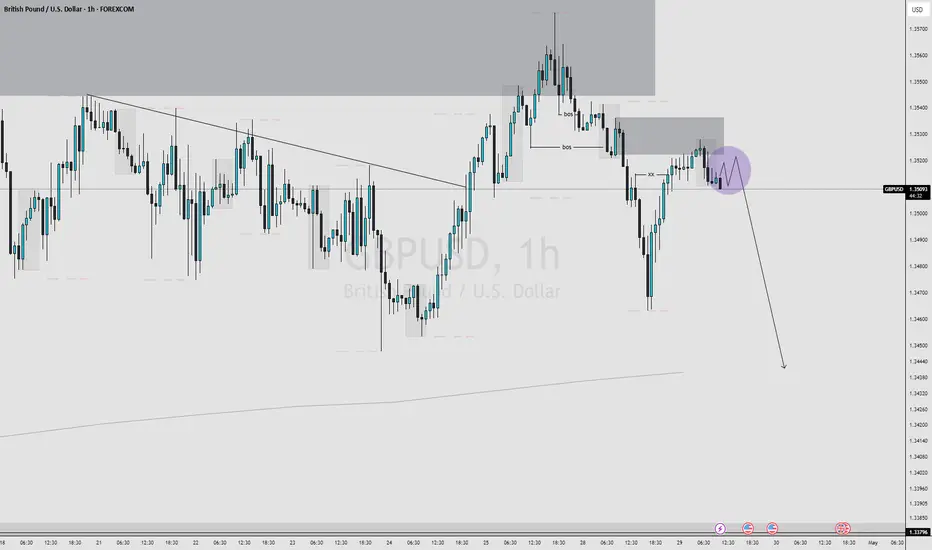
GBPUSD – Short Setup💼 Pair: GBPUSD
📉 Bias: Short
🔽 Entry: 1.35535
⛔ Stop-Loss: 21 pips
🎯 Take-Profit: 42 pips
⚖️ Risk:Reward: 1:2
📌 Trade Idea Explanation
Price has tapped into a premium zone after an extended upside move, showing signs of exhaustion. The pair reached a key supply area aligned with previous structure, suggesting a potential reversal.
The short entry at 1.35535 is positioned right as price reacts from the supply region, giving a high-probability short setup.
SL of 21 pips is placed safely above the structural sweep to protect against liquidity grabs.
TP of 42 pips is placed at the next major demand area, where price is likely to retrace.
📊 Market Structure
Market is forming lower highs in the intraday timeframe.
Liquidity has been collected at the top, increasing probability of downside continuation.
Clean imbalance below provides magnet for price.
🔻 Summary
Selling GBPUSD at 1.35535 with a 1:2 RR offers a clean, structured, and disciplined setup based on supply–demand + liquidity behavior.
CADCHF: Bullish Setup After WXY CompletionCADCHF has likely finished its correction phase (called a W-X-Y in Elliott Wave), which basically means the market has already gone through a messy sideways/down move and may now be ready to trend. Price recently dipped below support (a fake breakdown) and quickly reacted, suggesting sellers are losing control.
Right now, the market is trying to form the first move up (Wave 1), but it’s not confirmed yet. For real strength, currency needs to break and hold above the marked resistance level. Breakout above wave B will confirm the bullish cycle.
Bullish targets are 0.5148 - 0.5751+ . We can extend the targets after the breakout of wave X.
We will update with further information soon.
By @BrightRally_Research
NZDUSD Weekly Outlook: Hunting for the Next Order BlockBased on the current market data and technical structure for NZDUSD as of late April 2026, here is a technical analysis of your requested breakout levels.
Current Market Context
Current Price: Approximately 0.5861
Trend: The pair is currently in a recovery phase after testing multi-month lows near 0.5680 in early April. It is currently consolidating between the 0.5850 support and the 0.5930 resistance zone.
Scenario 1: Bullish Breakout (Long)
If price breaks 0.5902 → Target 0.5923
Confirmation: The 0.5900–0.5902 area is a significant psychological and technical pivot. A sustained move above this level on the 1H or 4H timeframe confirms bullish momentum.
Target Analysis: Your target of 0.5923 aligns perfectly with the recent swing high and a key Fibonacci retracement level identified at 0.5930.
Technical Support: Indicators like the RSI (14) are currently hovering near 60, suggesting there is still room for upward movement before becoming overbought.
Scenario 2: Bearish Breakdown (Short)
If price breaks 0.5840 → Target 0.5817
Confirmation: The level 0.5840 sits just below the recent cluster of support at 0.5850. Breaking 0.5840 would signal that the recent "Hammer" reversal on the daily chart has failed.
Target Analysis: Your target of 0.5817 is technically sound, as it aligns with the S3 Pivot Point (0.5816) and a historical pullback support level.
Risk Note: Below 0.5817, the next major "floor" is the April war-time low of 0.5774.
Trader's Note
Market volatility has been influenced by the ongoing RBNZ hawkish sentiment and global risk shifts. Ensure you watch for volume confirmation on these breaks, as the 0.5880–0.5900 area has shown several "fake-outs" in the past week.
EURUSD_M15Price is currently printing into a very interesting narrative if you’re viewing it through a proper ICT lens.
We’ve just seen a clean expansion leg to the upside, which effectively engineered liquidity above previous intraday highs. That buy-side liquidity has now been tapped, and price is beginning to show the first signs of displacement to the downside. This is where things get surgical.
The current draw on liquidity appears to be resting below, into that refined demand zone, which aligns with a previous imbalance and a short-term discount array. Notice how price is not randomly pulling back — it’s repricing into inefficiency. That’s intent, not noise.
What I’m anticipating here is a deeper retracement into the 1.1715–1.1705 region, where we have:
A confluence of imbalance (FVG)
A refined demand block
A discount zone relative to the recent dealing range
If price delivers into this area with proper displacement and fails to continue lower, that sets the stage for a classic ICT reversal model:
liquidity grab → inefficiency fill → continuation.
The projected path is simple but not easy:
engineer sell-side liquidity → rebalance → expansion targeting external range highs.
Upside objective remains the buy-side liquidity sitting above 1.1760.
Key thing I’m watching is how price trades into the zone, not just if it gets there.
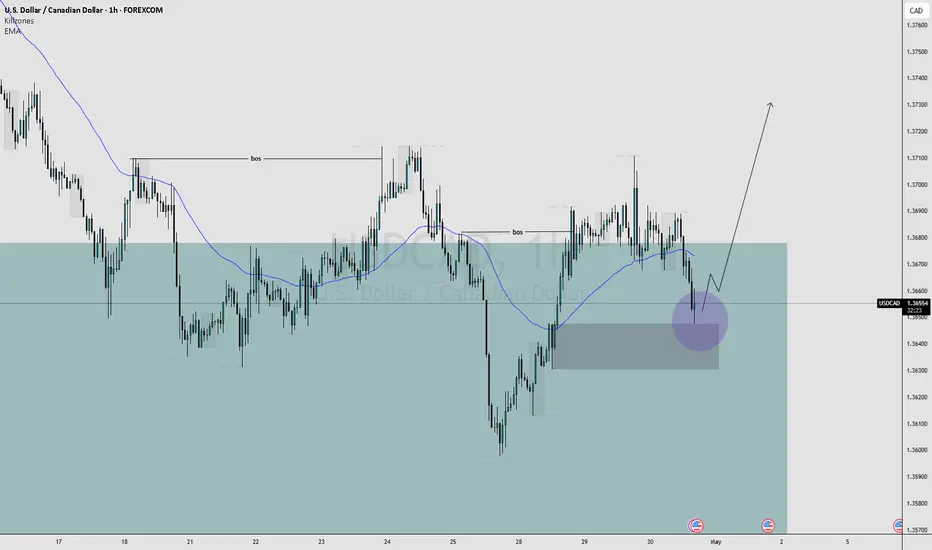
USD/CAD Continues to Weaken FurtherUSD/CAD traded sideways around 1.3650 during today's trading session.
The market is caught between weakening safe-haven demand for the US dollar and pressure on crude oil prices, which is weighing on the Canadian currency (Loonie), ahead of policy releases from two major central banks this week.
✅ Fundamental Dynamics: Peace Hopes vs. Commodity Pressure
This pair is influenced by the tug-of-war of contradictory global sentiment:
- Iran's New Proposal: Reports that Iran has presented a new proposal to the US to reopen the Strait of Hormuz and end the conflict have revived diplomatic hopes. This has reduced investors' need for the USD as a safe haven asset.
- Crude Oil Correlation: Peace optimism actually puts downward pressure on crude oil prices (due to expectations of normalized supply). Given Canada's status as a major oil exporter, oil weakness drags the Loonie (CAD) down, which automatically provides a breather for USD/CAD to remain at current levels.
- Event Risk (Central Banks): Traders are likely to be passive ahead of the Bank of Canada (BoC) and the FOMC (Fed) policy announcements on Wednesday. Uncertainty about the direction of interest rates in Ottawa and Washington has kept the market from taking aggressive positions.
✅ Key Levels to Watch
- Key Resistance (1.3700 - 1.3703): A close above this area is needed to invalidate the bearish bias and trigger a rebound towards 1.3750.
- Critical Support (1.3630): Last week's swing low. A sustained break below this level would be a "green light" for sellers to target the 1.3580 - 1.3550 area.
- Pivot Point (1.3650): The current price is acting as a consolidation magnet ahead of Wednesday's data releases.