Forex " pairs in play " session 38 10.03.26Currently managing a few open positions while keeping risk controlled with breakeven stops. The focus right now is mostly on trade management rather than opening new positions.
I’m also monitoring a few pairs closely — particularly USDJPY, AUDUSD, EURUSD, Gold, and USDCHF — to see if any clean setups develop according to my multi-timeframe framework. Patience is key here; I’d rather wait for proper structure shifts and confirmation instead of forcing trades at low expected value areas.
Let’s see how the market unfolds.
⚠️ Disclaimer: This content is for educational and journaling purposes only and does not constitute financial advice. Forex trading involves significant risk, especially when using leverage, and may not be suitable for all investors. Always do your own analysis and manage risk responsibly.
Forex market
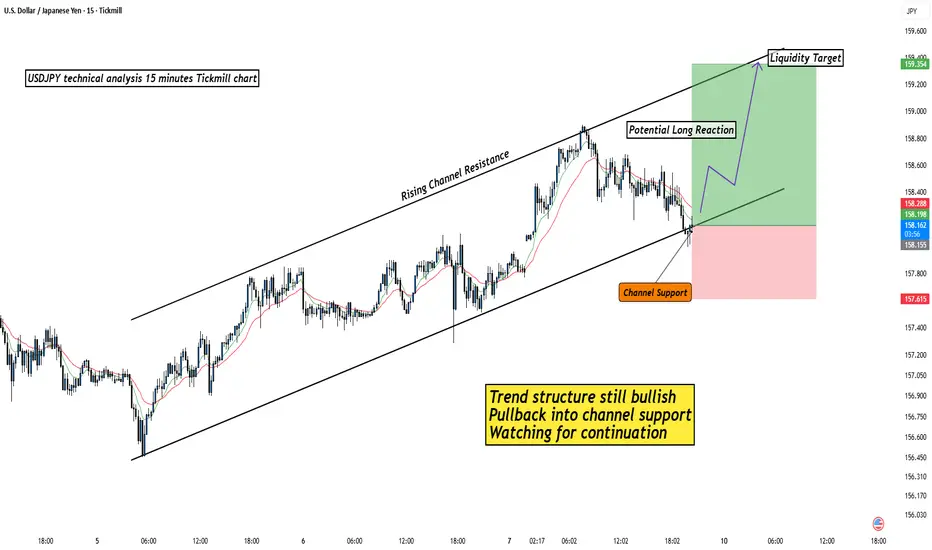
USDJPY Pullback Into Channel Support – Continuation Next?USDJPY continues to trade inside a well-defined rising channel, maintaining a clear bullish structure. After a strong push toward the upper boundary, the market has started to pull back toward the channel support. Moves like this are common within trending markets, where price retraces before attempting the next continuation move.
The key level to watch is the channel support area. If buyers step in and the structure holds, the market could attempt another move toward the upper boundary where liquidity is likely resting.
For now, the focus remains on how price reacts around this support zone.
Disclaimer: This analysis is for educational purposes only and does not constitute financial advice. Trading involves risk.
Gold daily update xauusd*🟡 XAUUSD (Gold) – TODAY UPDATE 🟡 ⏰*
*Validity: 10-03-26*
*🔹 Bullish Scenario (BUY)*
*• Trend Confirmation: Above 5225*
*• Targets: 5300– 5400*
*🔻 Bearish Scenario (SELL)*
*• Trend Confirmation: Below 5010*
*• Targets: 4935 – 4850*
*🔄Key Reversal / Entry Level: 5119*
#GoldTrading #freevipsignal #eurusdsignal #viral #trading #EURUSD #anantmoney #goldsignal
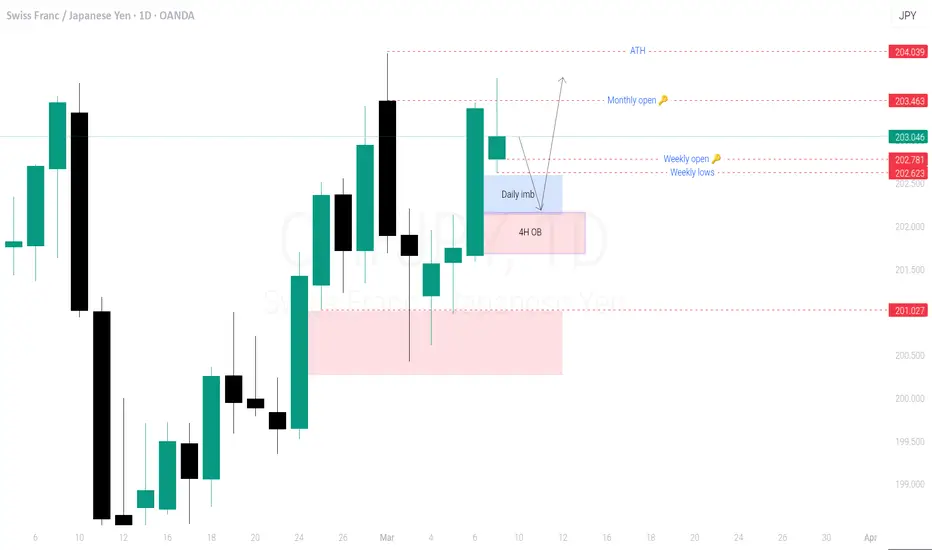
Chfjpy expecting Buyside delivery Setup will be only valid if the next day (daily new candle ) fills this daily imbalance, after it fills ,we can expect bullish pullback till above monthly open .
Following reasons to trust this setup
*Price coming from 201.027 ' it reacted from that daily imb ,which promotes an indication to take liquidity above
*ChF is fundamentally stronger(Safe heaven currency)
*monthly open is more nearer, it has high possibility to take the opening and flip bullish
*current monthly candle opens and takes the liquidity above then clean out all down side till the daily imbalance around 201.027 , now it's expecting opposite which can probably flip the monthly bullish and There will be good rally we can expect till Highs.
GBP/USD Bearish Momentum: Rejection at 1.3400 → Next Leg Down chart for GBP/USD captures a classic bearish setup unfolding from early March 2026, with price action reflecting a sustained downtrend amid weakening the pound.the pair trades at an ask price of 1.3393, down significantly from the session high near 1.3580 and testing lows around 1.3253. This aligns with broader multi-week bearish structure, where GBP/USD has shed over 3% from February highs, breaking key range lows and an ascending trendline.  The chart visually depicts lower highs and lower lows within a descending channel, with a recent breakdown below 1.3400 signaling potential for further downside. Below, I’ll break down the technical, fundamental, and trading implications in detail, emphasizing the bearish case while noting neutral/contrarian elements for balance.
1. Technical Analysis: Clear Bearish Momentum on 4H Timeframe
The chart illustrates a textbook bearish continuation pattern, with price consolidating in a descending channel since March 5. Candles show repeated rejections at the upper channel boundary (around 1.3480–1.3500) and acceleration lower after breaching horizontal support at 1.3400. This isn’t just noise—it’s a structural shift, confirmed by multiple indicators.
• Trend Structure and Price Action:
• Lower Highs/Lows: From the March 5 open near 1.3500, price formed a high at ~1.3580 (early in the period) before carving out progressively lower peaks (e.g., ~1.3440 mid-period) and troughs (dipping to 1.3253 by March 9). The arrow on the chart points to a breakdown below 1.3297, reinforcing the bearish impulse.
• Descending Channel: The parallel lines (visible as the slanted box) connect the swing high at 1.3580 to the recent low, with price hugging the lower boundary. A close below 1.3280 (the channel’s projected lower rail) would invalidate any short-term bounce and target the next support cluster. 
• Broken Trendline: An ascending trendline from February lows (around 1.3200) has been decisively violated, opening the door for a measured move decline of ~470 pips from the 1.3580 high—potentially to 1.3110.  On the 4H, this aligns with a symmetric triangle breakdown earlier in the week, biasing sellers on any retest of 1.3414. 
USDINR - The Final TOP!USDINR - Has been moving between 90 - 92 forming marginally higher highs/ higher lows, in what is called an Ending Diagonal in Elliot Waves.
This should form a medium term top in USDINR and lead to a 4% if not 10% fall.
Reasons:
1. Crude spike cool off
2. Signs of recovery in economy leading to better GDP
These should lead to stocks doing better.
Strengthening currency and improved GDP number + corporate results should attract FII inflows, which should further fuel the stock market.
Too early, but the path looks clear!
EURUSD Long – Mean Reversion Opportunity📊 Trade Setup
Entry: 1.15179
Stop Loss: 37 pips below entry
Take Profit: 98 pips above entry
Risk-Reward: ~1:2.6
After a sharp sell-off, EURUSD has reached a strong intraday support zone where buyers previously stepped in. The recent liquidity sweep below the lows followed by a strong rejection suggests that the market may be preparing for a mean reversion move back toward the equilibrium area.
Price is currently attempting to reclaim the short-term structure, and if buyers maintain momentum, we could see a continuation toward the upper imbalance zone.
🔎 Key Technical Factors
Liquidity sweep below recent lows
Strong rejection wick signaling demand
Mean reversion toward the fair value area
Favorable risk-to-reward structure (~1:2.6)
🧠 Trade Thesis
The market flushed liquidity below support and quickly rebounded, which often indicates smart money absorption of selling pressure. If price holds above the reclaimed level, buyers could push the pair back toward the prior consolidation range.
A successful reclaim of this zone would likely trigger short covering and momentum buying, fueling the move toward the target area.
⚠️ This setup follows a mean-reversion framework where price tends to revert back toward its average after an extreme move.
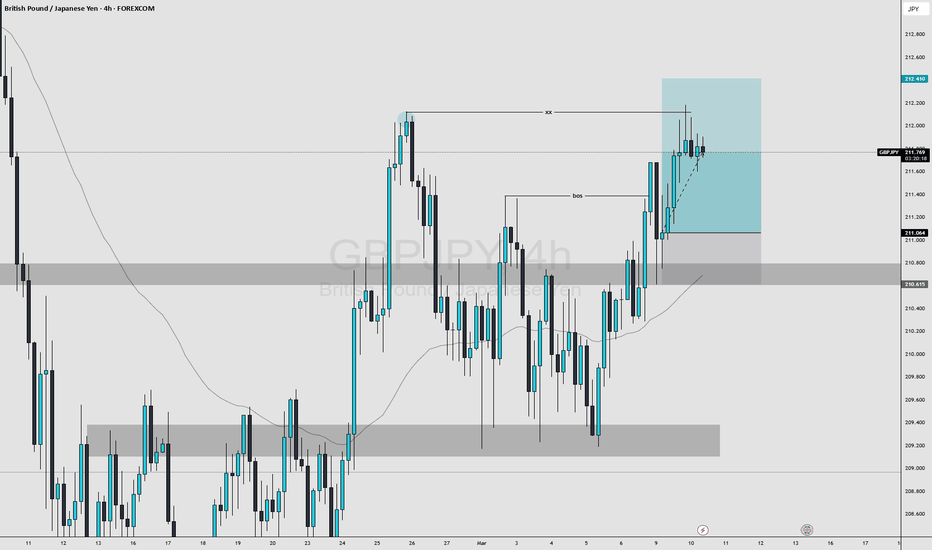
FX Breakdown: GBPJPY Long ,USDJPY, EURAUD, USDCHF watchlistCurrent market breakdown and trade plan.
• GBPJPY – Long position targeting 220.385 after rejection from a key daily flip level.
• USDJPY – Bullish monthly impulse structure, expecting continuation above highs.
• EURAUD – Monitoring for potential short if 4H bearish confirmation appears.
• USDCHF – Watching for a 4H bearish close to enter shorts targeting previous lows.
• GBPUSD & Gold – No trades yet, waiting for structure shifts.
Multi-timeframe analysis from Monthly → Weekly → Daily → 4H focusing on impulse-correction structure.
NZD/USD remains in bearish controlNZD/USD is struggling to recover from a four-day low around 0.5845.
✅ Fundamental Factors: USD Dominance & Antipodean Sentiment
NZD/USD's current movement is dictated by geopolitical dynamics and interest rate expectations:
- ⚡Safe-Haven USD: The escalation of conflict in the Middle East (day 10 of the US-Israel-Iran war) continues to push investors toward the US dollar. The Dollar Index (DXY) has now reached its highest level since November 2025.
- ⚡Energy Crisis & Inflation: Surging crude oil prices have fueled concerns about global inflation, reducing the likelihood of an interest rate cut by the Federal Reserve in the near future. This has pushed US Treasury yields up, directly pressuring the risk-sensitive NZD.
- ⚡Support from China: Some positive sentiment came from higher-than-expected Chinese inflation data. As a major trading partner, China's strong economic data has provided a breather for the NZD to prevent a further decline.
---------------------------------------------------------------------------------------------------------
✅ Technical Indicators: Bearish Momentum Strengthens
Technically, the price structure indicates significant medium-term weakness:
- ⚡Price has fallen below this crucial moving average. Failure to return above 0.5876 signals a loss of medium-term support.
- ⚡RSI (39.6): Is below 50 but has not yet entered oversold territory (oversold <30). This indicates there is still room for the price to decline further before a technical correction occurs.
Conclusion:
NZD/USD remains in bearish control as long as it trades below the 200-day SMA.
Tonight's market focus will be on whether the New York session will bring further dollar buying that could push the Kiwi toward 0.5800.
GBPJPY MULTI TIME FRAME ANALYSISHello traders , here is the full multi time frame analysis for GBPJPY , let me know in the comment section below if you have any questions , the position will be taken only if all rules of the strategies will be satisfied. wait for more price action to develop before taking any position. I suggest you keep this pair on your watchlist and see if the rules of your strategy are satisfied.
🧠💡 Share your unique analysis, thoughts, and ideas in the comments section below. I'm excited to hear your perspective on this pair .
💭🔍 Don't hesitate to comment if you have any questions or queries regarding this analysis.
EURUSD Weekly Outlook (SMC + HTF Resistance Confluence)📊 Market Structure Overview
EURUSD is currently trading into a major weekly supply / resistance zone while respecting a long-term descending trendline connecting multiple swing highs. Price has approached this area several times historically and reacted with strong bearish momentum — making it a high-probability reaction zone on the HTF.
🔎 Key Technical Observations
Price is testing a multi-year descending trendline → strong dynamic resistance.
Presence of SMC concepts on chart: BOS / CHoCH and visible FVG zones below current price.
Current rally looks like a liquidity grab into premium pricing within weekly structure.
Equal / relative highs marked — potential buy-side liquidity before reversal.
HTF structure overall remains bearish / corrective, not a confirmed bullish trend reversal.
📍 Trading Plan (Idea — Not Financial Advice)
➡️ Primary Bias: Bearish from weekly resistance.
➡️ Entry Concept:
Wait for lower-timeframe confirmation such as:
Bearish engulfing candle
Pin bar rejection
Market structure shift / CHoCH
➡️ Targets:
First reaction → mid FVG / internal demand
Major target → HTF demand zone around parity region (~1.00 area)
Extended bearish scenario → deeper weekly demand near lower red zone
⚠️ Risk Factors / Invalidation
Strong weekly close above trendline and resistance zone.
Bullish continuation with sustained higher highs + higher lows on HTF.
Macro catalysts (ECB/Fed policy shifts) could accelerate volatility.
🧠 Final Thoughts
This setup aligns with a classic premium sell model — price rallies into HTF supply + trendline confluence before targeting imbalances below. Patience is key: confirmation matters more than prediction.
USDCHF MULTI TIME FRAME ANALYSISHello traders , here is the full multi time frame analysis for USDCHF , let me know in the comment section below if you have any questions , the position will be taken only if all rules of the strategies will be satisfied. wait for more price action to develop before taking any position. I suggest you keep this pair on your watchlist and see if the rules of your strategy are satisfied.
🧠💡 Share your unique analysis, thoughts, and ideas in the comments section below. I'm excited to hear your perspective on this pair .
💭🔍 Don't hesitate to comment if you have any questions or queries regarding this analysis.
USDJPY MULTI TIME FRAME ANALYSISHello traders , here is the full multi time frame analysis for this pair , let me know in the comment section below if you have any questions , the position will be taken only if all rules of the strategies will be satisfied. wait for more price action to develop before taking any position. I suggest you keep this pair on your watchlist and see if the rules of your strategy are satisfied.
🧠💡 Share your unique analysis, thoughts, and ideas in the comments section below. I'm excited to hear your perspective on this pair .
💭🔍 Don't hesitate to comment if you have any questions or queries regarding this analysis.
gold weekly Updates *🟡 XAUUSD(GOLD) – WEEKLY UPDATE 🟡 ⏰*
*Validity: 9-03-26 to 13-03-26*
*🔹 Bullish Scenario (BUY)*
*• Trend Confirmation: Above 5450*
*• Targets: 5610 – 5810*
*🔻 Bearish Scenario (SELL)*
*• Trend Confirmation: Below 4950*
*• Targets: 4780 – 4550*
*🔄 Key Reversal / Entry Level: 5190*
#GoldTrading #freevipsignal #eurusdsignal #viral #trading #EURUSD #anantmoney goldsignal
GBPUSD MULTI TIME FRAME ANALYSISHello traders , here is the full multi time frame analysis for this pair, let me know in the comment section below if you have any questions , the entry will be taken only if all rules of the strategies will be satisfied. wait for more price action to develop before taking any position. I suggest you keep this pair on your watchlist and see if the rules of your strategy are satisfied.
🧠💡 Share your unique analysis, thoughts, and ideas in the comments section below. I'm excited to hear your perspective on this pair .
💭🔍 Don't hesitate to comment if you have any questions or queries regarding this analysis.
EURUSD MULTI TIME FRAME ANALYSISHello traders , here is the full multi time frame analysis for this stock , let me know in the comment section below if you have any questions , the position will be taken only if all rules of the strategies will be satisfied. wait for more price action to develop before taking any position. I suggest you keep this pair on your watchlist and see if the rules of your strategy are satisfied.
🧠💡 Share your unique analysis, thoughts, and ideas in the comments section below. I'm excited to hear your perspective on this pair .
💭🔍 Don't hesitate to comment if you have any questions or queries regarding this analysis.
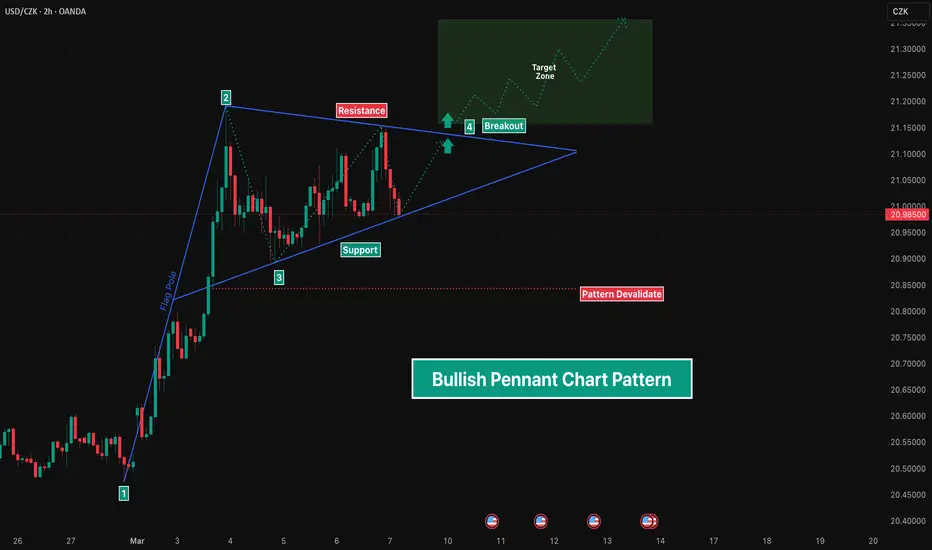
Bullish Pennant Chart PatternOverview
A Bullish Pennant is a continuation pattern that forms after a strong upward price movement. It represents a brief consolidation phase where the market pauses before potentially continuing in the direction of the prevailing trend.
The pattern consists of a sharp impulsive rally known as the flagpole, followed by a small symmetrical triangle consolidation called the pennant. When price breaks above the upper boundary of the pennant, it often signals continuation of the uptrend.
⸻⸻⸻⸻⸻⸻⸻⸻⸻⸻⸻
Key Features
• Strong Impulse Move (Flagpole)
A rapid upward price movement creates strong bullish momentum.
• Triangle Consolidation (Pennant)
Price consolidates inside converging trendlines, forming a tight structure.
• Volume Contraction
Trading activity often decreases during consolidation.
• Breakout Confirmation
A breakout above the upper trendline indicates continuation of bullish momentum.
• Measured Move Target
The projected target is often estimated using the height of the flagpole.
⸻⸻⸻⸻⸻⸻⸻⸻⸻⸻⸻⸻
Chart Explanation
1️⃣ Flagpole Formation
Price makes a strong impulsive rally, creating the initial upward momentum.
2️⃣ Resistance Reaction
After the rally, price begins consolidating as buyers temporarily pause and profit-taking appears.
3️⃣ Support Formation
Higher lows develop within the structure, showing buyers are still defending price.
4️⃣ Pennant Structure
Price compresses between descending resistance and rising support, forming the pennant.
5️⃣ Breakout Scenario
A breakout above the upper trendline may trigger continuation toward the projected target zone.
⸻⸻⸻⸻⸻⸻⸻⸻⸻⸻⸻⸻
Observation
• Strong bullish momentum preceded the consolidation.
• Price is compressing within a tightening triangle structure.
• Breakout direction will determine the next phase of the trend.
⸻⸻⸻⸻⸻⸻⸻⸻⸻⸻⸻⸻
Summary
The Bullish Pennant represents a temporary pause within a strong uptrend. If price breaks above the pennant resistance, it may signal continuation of the existing bullish momentum toward higher levels.
⸻⸻⸻⸻⸻⸻⸻⸻⸻⸻⸻⸻
Conclusion
📘 For educational purposes only.
🙅 Not SEBI registered.
❌ Not a buy/sell recommendation.
🧠 Purely a learning resource.
📊 Not Financial Advice.
Bearish View on GBPJPY📉 Market Structure explanation ( GBPJPY - 1week )
The market has shown a long supply but the supply was slow and was not strong compared to its previous supply . And forming a down side liquidity and a NEEDED VOLUME .At 1 week time frame bearish engulfing candle is formed but the size of the candle is to big so we need a retest
So what to do Next
1) Wait for retest atleast 60 % of the bearish engulfing candle
2) Look for the negative candle stick at (1D Time frame)
3) If no negative candle stick what for the chart patterns
NOTE if the market has given the supply by consolidating, forming chart patterns than there is high chance that the market give demand by forming (chart patters , consolidating ) or by doing FMFR ( first move fake than reversal )
#(If supply is slow than demand could be Fast)
Global Market Rates Impact1. Understanding Global Market Rates
Global market rates generally refer to the interest rates set by central banks and the yields on government bonds in major economies such as the United States, the European Union, Japan, and emerging markets. Key rates include the Federal Reserve rate in the United States, the European Central Bank policy rate, and other benchmark rates around the world.
These rates determine the cost of borrowing money and the return on savings and investments. When central banks increase interest rates, borrowing becomes more expensive, while saving becomes more attractive. When rates are reduced, borrowing becomes cheaper, encouraging spending and investment.
Global market rates often move together because the world’s financial markets are interconnected. For example, if interest rates rise in a major economy like the United States, it can influence markets in Europe, Asia, and developing countries.
2. Impact on Stock Markets
Changes in global market rates significantly affect stock markets. When interest rates rise, the cost of borrowing increases for companies. This can reduce corporate profits because businesses must pay more interest on loans. As a result, stock prices may decline.
Higher interest rates also make fixed-income investments like bonds more attractive compared to stocks. Investors may shift their money from equities to bonds, which can cause stock market declines.
On the other hand, when interest rates fall, borrowing becomes cheaper. Companies can invest more in expansion, production, and innovation. Lower rates also encourage investors to move money into equities, often leading to stock market growth.
Technology and growth companies are particularly sensitive to interest rate changes because their valuations depend heavily on future earnings.
3. Impact on Currency Exchange Rates
Global market rates strongly influence currency values in the foreign exchange market. When a country raises interest rates, it often attracts foreign investors looking for higher returns. These investors buy the country's currency to invest in its financial assets, which increases demand for the currency and causes its value to rise.
For example, if interest rates increase in the United States, investors from around the world may buy US dollars to invest in US bonds or other assets. This can strengthen the dollar relative to other currencies.
Conversely, when interest rates decrease, investors may move their money to other countries with higher returns. This can weaken the country’s currency. Currency fluctuations affect international trade, tourism, and global investment flows.
4. Impact on Global Capital Flows
Global market rates influence how money moves across international markets. Investors often seek the best returns while managing risk. When interest rates rise in developed economies, capital may flow from emerging markets to developed markets.
This shift can create challenges for emerging economies. If investors withdraw funds from emerging markets, local stock markets may fall, currencies may weaken, and borrowing costs may increase.
Conversely, when interest rates are low in developed markets, investors may look for higher returns in emerging markets. This can lead to increased foreign investment, stronger currencies, and economic growth in those countries.
5. Impact on Inflation
Interest rates are one of the main tools used by central banks to control inflation. When inflation rises too quickly, central banks typically increase interest rates to reduce spending and borrowing. Higher rates slow down economic activity, which helps bring inflation under control.
When inflation is low or economic growth slows, central banks may reduce interest rates to encourage borrowing, spending, and investment.
Global market rates can therefore influence inflation levels across many countries. If major economies raise rates simultaneously, it may reduce global demand and slow inflation worldwide.
6. Impact on Bond Markets
Bond markets are directly affected by changes in global market rates. When interest rates rise, bond prices generally fall. This happens because new bonds are issued with higher yields, making older bonds with lower yields less attractive.
Investors holding long-term bonds may experience price declines when rates increase. Conversely, when interest rates fall, existing bonds with higher yields become more valuable, causing bond prices to rise.
Government bond yields also serve as benchmarks for many other interest rates, including mortgage rates, corporate loan rates, and credit card rates.
7. Impact on Business and Corporate Investment
Businesses rely on borrowing to finance expansion, infrastructure, research, and operations. When global market rates increase, the cost of financing rises. Companies may delay or reduce investments because borrowing becomes expensive.
Higher rates can also affect corporate profits, especially for companies with large amounts of debt. This may lead to reduced hiring, slower growth, and lower stock valuations.
In contrast, when interest rates are low, companies can borrow more easily and invest in growth opportunities. This can lead to increased production, job creation, and economic expansion.
8. Impact on Consumers and Households
Global market rates indirectly affect consumers as well. Higher interest rates often lead to higher mortgage rates, car loan rates, and credit card interest rates. This reduces consumer spending because people must allocate more income to interest payments.
Lower interest rates make borrowing cheaper, encouraging people to buy homes, cars, and other goods. Increased consumer spending supports economic growth.
Savings accounts and fixed deposits are also influenced by market rates. When rates rise, savers receive higher returns, while lower rates reduce income from savings.
9. Impact on Emerging Markets
Emerging markets are particularly sensitive to global market rate changes. Many developing countries rely on foreign capital and external borrowing. When global interest rates rise, it becomes more expensive for these countries to borrow money.
Higher global rates may also cause investors to move their funds to safer developed markets, leading to capital outflows from emerging economies. This can create currency volatility, inflation pressures, and financial instability.
However, when global rates are low, emerging markets often benefit from increased foreign investment and stronger economic growth.
10. Impact on Global Economic Growth
Global market rates play an important role in determining the pace of global economic growth. Low interest rates usually support economic expansion by encouraging borrowing, spending, and investment.
High interest rates can slow economic growth because businesses and consumers reduce spending. While higher rates may help control inflation, they can also increase the risk of economic slowdown or recession if raised too aggressively.
Central banks therefore try to maintain a balance between controlling inflation and supporting economic growth.
Conclusion
Global market rates are one of the most powerful forces shaping the world’s financial system. Changes in these rates influence stock markets, bond markets, currency values, capital flows, corporate investment, and consumer spending. They also play a critical role in controlling inflation and maintaining economic stability.
Because global financial markets are highly interconnected, interest rate changes in major economies can quickly impact markets around the world. Investors, businesses, and policymakers must closely monitor global market rates to make informed financial decisions and manage economic risks effectively.
Understanding the impact of global market rates helps individuals and institutions navigate the complexities of the global economy and adapt to changing financial conditions.
Smart Money Sweep Above Highs – What’s Next for GBPUSD?GBPUSD recently pushed into the major supply zone and swept liquidity above the previous highs. That move looked aggressive, but instead of continuation, we’re now seeing a pullback.
For me, this pullback is not weakness, it looks more like a reset into demand.
Price is currently moving back toward the protected demand zone and deeper discount area. If buyers step in here and structure holds, the market could attempt another move toward the highs. The overall structure remains intact as long as the deeper demand zone is respected.
Right now, the focus is simple:
Reaction inside demand will decide the next leg.
No need to predict. Just watch how price behaves at key levels.
Disclaimer: This analysis is for educational purposes only and does not constitute financial advice. Trading involves risk. Always manage your risk properly.
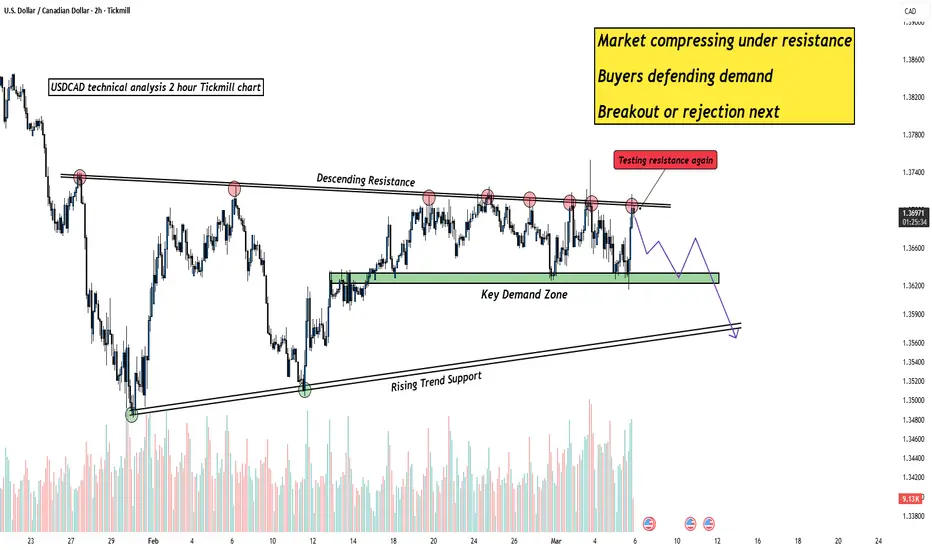
USDCAD Compression Setup – Big Move Loading?USDCAD has been trading between a well-defined demand zone and a descending resistance line. Price has already reacted multiple times from both areas, which shows that the market is respecting these levels.
Recently, buyers stepped in again from the demand zone, pushing price back toward the resistance area. However, the market still remains capped under the descending resistance.
When price continues to move between tightening boundaries like this, it often signals compression. The next significant move will likely depend on how the market reacts around this resistance.
For now, the structure remains simple: demand below, resistance above, and price caught in between.
Disclaimer: This analysis is for educational purposes only and does not constitute financial advice. Trading involves risk.
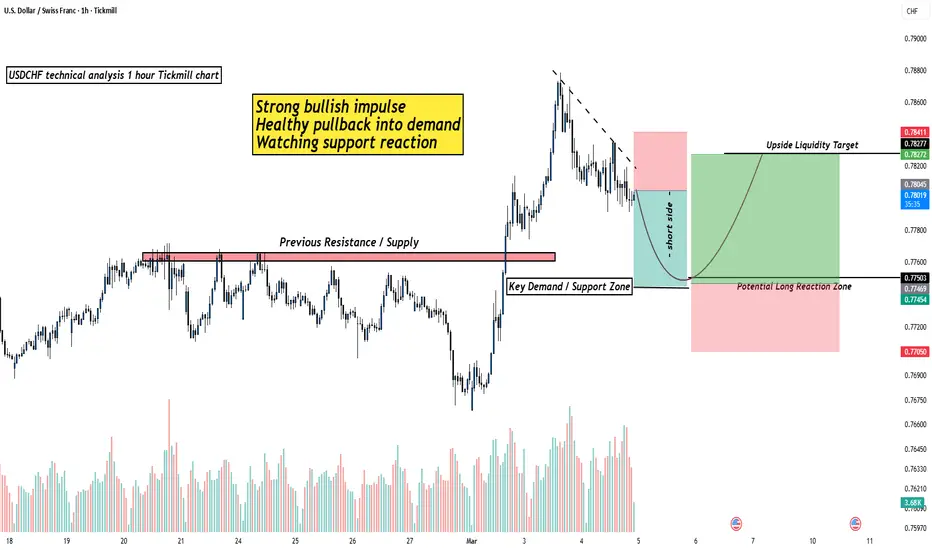
USDCHF Pullback After Breakout – Watching Demand ReactionUSDCHF recently broke above a previous resistance zone and showed a strong bullish impulse. Moves like this often need a pause, and the market now appears to be pulling back toward a key demand area.
For me, this pullback looks more like a healthy retracement rather than weakness. Markets rarely move in a straight line, they expand, retrace, and then decide the next direction based on reaction at important levels.
If the demand zone holds, the market could attempt another move toward the upside liquidity area. However, the reaction at support will be the key factor to watch.
At the moment, the focus is simple:
Observe how price behaves inside the demand zone.
Disclaimer: This analysis is for educational purposes only and does not constitute financial advice. Trading involves risk.
AUDUSD Short : Hedge or overexposure ? Dollar strength is starting to build while my USDCAD short isn’t playing out as expected. Instead of closing the position, I’m looking at AUDUSD for a potential short to see if it can partially offset the exposure.
Top-down view:
Monthly: Price rejecting from a key resistance area after a strong impulsive move up → possible deeper correction.
Weekly: Confluence around the 38.2 retracement and a major level, suggesting room for a pullback.
Daily: Price reacting from an important zone that has acted as resistance multiple times.
Trade Idea:
Waiting for a 4H bearish close to consider a short with a tight stop above the recent high, targeting around 1:3 RR.
Question is:
Is this a smart hedge… or just adding more USD exposure?