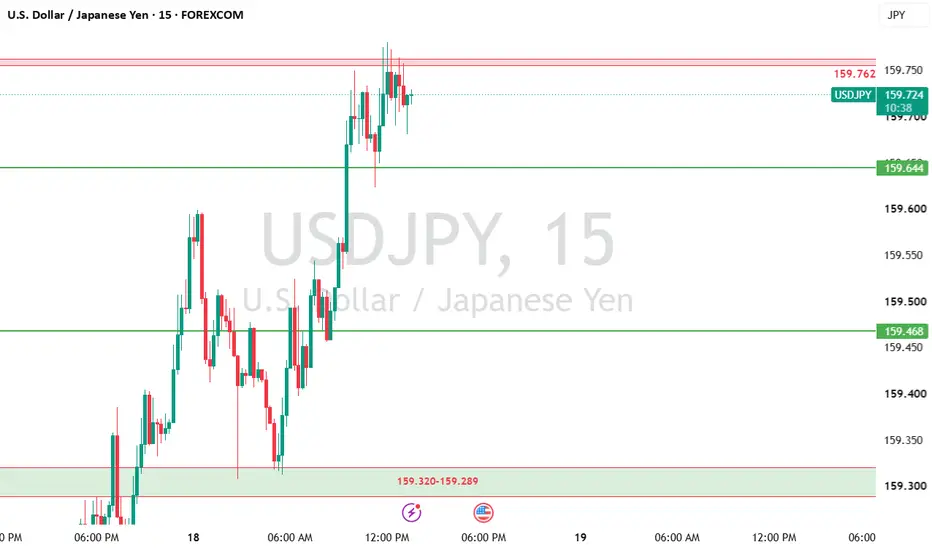
USDJPY 7/7 - S-T Range Trading Awaiting New Breakout catalyst...Since Japanese Prime Minister Takaichi took office and the market began speculating that the US Fed. will raise rates in 2026, the yen has been weakening. Major news sites have been promoting that the yen is at a 30-year high since 1990... Looking closely at the daily chart, USDJPY is still consolidating near the July 2024 high (around 162), not a confirmed breakout yet.
In the past 2 years, whenever the daily MACD showed divergence, USDJPY experienced a clear correction. Momentum has slowed, but the correction has yet to appear, as the market awaits a new catalyst...
What will the new catalyst be...?
Will the US Dollar Index strengthen again, breaking above 101.80? Two weeks ago, some investment banks reported three rate hikes this year. For the dollar to strengthen further, the market would need to speculate on more than three hikes by the Fed in 2026, which seems unlikely for now... Especially after the US/Iran situation eased, the chance of a reversal is higher...
Will the Bank of Japan intervene again? According to the IMF, Japan is a currency free convertibility country, and the BOJ still has two chances to intervene before November. Referring to the last intervention effect, it only pushed a 500-point adjustment. If they intervene again, how many points can they push down? The market usually discounts the second intervention, so this time a 300-point adjustment? It is believed this time they must act more aggressively, using more foreign reserves to be effective 🤔?
"Unknown" factors? Why say that 🤣 Just like the 2025 tariffs or the Iran situation earlier this year, these are items requiring careful planning. Planned items are known to some (based on market reactions over the past six months), but certainly not to general investors. I believe something will appear before the US midterm elections, so just wait...
Currently, USDJPY can only continue narrow range trading at high levels. Without new news, the trading range is between 158(1) and 163, operating within a consolidating triangle. USDJPY must break below the 150-day moving average to see a deeper correction.
Of course, a breakout upwards cannot be ruled out. If selling pressure above 163 clears and market momentum increases, USDJPY will retest new highs with a target of 166.5.
Start preparing, are you ready?
Forex market
AUDUSD Recovery May Fade Near 0.6960AUDUSD has bounced after weeks of weakness, but the move is now testing a major resistance area around 0.6950–0.6960. Unless buyers break this zone with strength, the recovery may remain only technical.
The softer US Dollar has helped the Aussie, but the broader trend still needs stronger confirmation.
Trade Setup:
Sell Zone: 0.6950 – 0.6960
Stop Loss: 0.6990
Take Profit 1: 0.6910
Take Profit 2: 0.6885
AUDUSD getting ready for a rally?After a decline of 5.6% that we saw form 6th may 2026 to 30th June 2026, price has formed a bottoming formation at a strong Support, from where it has seen bounce backs earlier, after the breakout of the bearish trendline and sustaining comfortably above the neckline we might expect a good rally from the current levels.
Important levels:
0.6921 is an immediate support and below it 0.6883 can act as strong support. where as no any significant resistance is seen below 0.7041.
Structurally AUDUSD seems to be transforming form bearish to bullish.
In summary: Bullish for upcoming days but for fresh entries wait for the pullbacks!
For Educational Purposes only, Not an Investment Advice, Always use strict Risk management measures.
Regards CrazyTrades247.
Advanced Options TradingIn options trading, institutional traders usually have advantages over retail traders because they have access to better technology, market data, and experienced analysts. Institutions often use options to hedge portfolios, manage market exposure, and improve investment returns. For example, a fund manager may buy put options to protect investments during uncertain market conditions. Their trading strategies are usually more disciplined and data-driven compared to individual investors.
EURUSD Recovery Weakens Below Key ResistanceEURUSD is struggling to extend its recent recovery, with buyers losing momentum below the 1.1450 resistance area. The stronger US Dollar, supported by solid employment data and higher Treasury yields, continues to weigh on the pair.
Trade Setup:
Buyers should be cautious unless EURUSD breaks above resistance.
Sell Zone: 1.1440 – 1.1450
Stop Loss: 1.1485
Take Profit 1: 1.1420
Take Profit 2: 1.1380
GBPUSD Technical Analysis (4H Timeframe) 📊 GBPUSD Technical Analysis (4H Timeframe) — Potential Bearish Reaction Setup 📉
🔍 Technical Overview:
On the 4-hour chart of GBPUSD, the price has successfully broken out of a major descending channel, displaying a strong bullish corrective phase. Currently, the price is approaching a key higher-timeframe supply zone / resistance block. We are monitoring this area closely for potential signs of exhaustion or price rejection, which could lead to a structural pullback to mitigate lower liquidity pools.
📈 Strategy & Risk Management:
This setup relies strictly on structural confluence at key technical levels, focusing on disciplined risk allocation and solid invalidation criteria.
Direction: Potential Short / Rejection Opportunity 🔴
Invalidation (Stop Loss): Should be placed strictly above the structural resistance high to maintain tight risk parameters. 🛑
Target (Take Profit): Aiming for the internal liquidity levels and the breakout retest zones below. 🎯
⚠️ Disclaimer:
This analysis represents a personal chart study for educational purposes only. It is not financial advice, and trading forex involves substantial risk to capital
EURUSD Technical Analysis (15m Timeframe) — Bullish📊 EURUSD Technical Analysis (15m Timeframe) — Bullish Continuation Setup 🚀
🔍 Market Structure & Technical Overview:
Looking at the 15-minute chart of EURUSD, the market has recently shifted its character (CHOCH) to the upside, signaling a strong shift from a bearish to a bullish order flow.
Following the aggressive bullish impulse, the price entered a corrective phase, forming a descending channel/trendline to mitigate internal liquidity. Currently, the price has tapped into a key internal demand zone / bullish order block, showing signs of price rejection and initial accumulation.
📈 Execution Plan & Risk Management:
This setup is based strictly on structural alignment and a highly favorable risk-to-reward ratio. We are anticipating a bullish continuation from this demand area to target the recent swing highs.
Position: Long / Buy Limit 🟢
Invalidation Level (Stop Loss): Placed tightly just below the recent demand zone structural low to ensure strict risk control. 🛑
Target Level (Take Profit): Targeting the major liquidity pool at the recent swing high. 🎯
⚠️ Risk Disclaimer:
This analysis is purely for educational purposes and chart study. It does not constitute financial advice. Foreign exchange trading carries a high level of risk. Always manage your risk according to your personal trading plan.
What are your thoughts on this EURUSD setup? Let me know in the comments below, and don't forget to follow for more clean, institutional price action setups! 📈✨
Accumulation Market StructureOverview
The Accumulation Market Structure typically develops after a sustained downtrend, where price shifts from declining into a period of sideways consolidation. During this phase, selling pressure gradually weakens while buying interest steadily increases, resulting in a well-defined trading range. As buyers begin to absorb available supply, the market establishes a stronger foundation. A confirmed breakout above resistance may indicate the transition into the Markup Phase although confirmation should always come from price action.
---------------------------------------------------------------
Definition
Accumulation is a market phase that typically develops after a prolonged downtrend, where price stops making lower lows and begins consolidating within a defined range. During this period, selling pressure gradually weakens while buying interest steadily increases, creating a temporary balance between supply and demand. A confirmed breakout above the consolidation range may indicate the beginning of a new bullish trend.
---------------------------------------------------------------
Concept
The Accumulation Market Structure represents a transition from a bearish trend into a period of consolidation. During this phase, selling pressure gradually weakens while buyers steadily absorb available supply. Price remains within a defined trading range as supply and demand move toward equilibrium. The accumulation phase concludes only when price confirms a breakout or breakdown from the established range.
---------------------------------------------------------------
Chart Explanation
The chart begins with a clear bearish trend.
Price then enters a sideways consolidation range.
Support repeatedly attracts buying interest and prevents further declines.
Resistance continues to cap upward price movement during consolidation.
Multiple reactions at both boundaries validate the trading range.
A confirmed breakout above resistance may signal the beginning of the **Markup Phase**.
---------------------------------------------------------------
Key Observations
- Selling pressure gradually weakens throughout the consolidation.
- Buyers continue to defend the established support zone.
- Price remains confined within a clearly defined trading range.
- The accumulation range reflects temporary equilibrium between buyers and sellers.
- The market structure remains neutral until a confirmed breakout or breakdown occurs.
---------------------------------------------------------------
Why It Matters [ /b]
Understanding the Accumulation Market Structure helps market participants identify periods where price transitions from a bearish trend into consolidation. Recognizing this phase improves the interpretation of support, resistance, and overall market structure. Waiting for breakout confirmation encourages a disciplined approach instead of anticipating a trend reversal too early.
---------------------------------------------------------------
Conclusion
The Accumulation Market Structure demonstrates how markets often stabilize after a decline before establishing their next directional move. As long as price remains within the consolidation range, support and resistance continue to define market behavior. A confirmed breakout above resistance may indicate the beginning of the **Markup Phase**, while continued consolidation suggests the market is still building a foundation.
---------------------------------------------------------------
⚠️ Disclaimer
📘 This publication is intended for educational purposes only.
🙅 Not SEBI registered.
❌ This is not a buy or sell recommendation.
🧠 Purely a learning resource focused on market structure and price action.
📊 Not Financial Advice.
GBPEUR Breakout up-move going to persist?Price gave breakout above the year long consolidation, structurally the consolidation seems like a complex inverse head and shoulder pattern, which eventually broke above the level of 1.1630 (Neckline of the formation). The whole consolidation structure is at support of multi year rising trendline, taking support of which price has shown multiple bounce backs in the upper direction.
We are expecting a sustained up-move and eventual breakout of 1.216 which was previous upswing's high. Bullishness is going to persist for the next 1-2 quarters.
Resistance 1: 1.1934
Resistance 2: 1.2131
Support 1: 1.1510
For fresh entries, I would wait for a pullback, consolidation & upon continuation of the move in the upper direction. I would be interested in taking long entries.
In summary: Bullish for up coming days but for fresh entries wait for the pullbacks!
For Educational Purposes only, Not an Investment Advice, Always use strict Risk management measures.
Regards CrazyTrades247.
GBP/USD Technical Analysis (30-Min Chart) 📊💷 GBP/USD Technical Analysis (30-Min Chart) 🇬🇧🇺🇸
🟢 Market Outlook: Bullish Continuation Expected
The overall trend remains bullish, with price maintaining a strong market structure. The recent pullback appears to be a healthy correction into a key demand area before the next potential upward move.
📈 Market Structure
✅ Bullish Trend Confirmed
Higher Highs (HH) and Higher Lows (HL) remain intact.
Multiple Breaks of Structure (BOS) confirm buyers are in control.
The ascending trendline continues to support the bullish trend.
📦 Key Demand Zone (FVG)
🟩 Fair Value Gap (FVG): 1.3330 – 1.3350
This zone represents a potential institutional buying area where price may find support before continuing higher.
👀 What to Watch
✅ Strong bullish rejection candles
✅ Increased buying momentum
✅ Confirmation before entering a trade
🚀 Bullish Scenario
📍 Buy Zone: 1.3330 – 1.3350
🎯 Target 1: 1.3380
🎯 Target 2: 1.3404 (Major Resistance)
A successful bounce from the FVG could drive price toward the resistance level.
🔴 Bearish Scenario
If price closes below 1.3319, it would indicate:
❌ Failure of the demand zone
❌ Weakening bullish momentum
❌ Higher probability of a deeper correction toward the next support level
🔑 Key Levels
🟢 Resistance: 1.3404
🟡 Current Price: 1.3352
🟦 Demand Zone (FVG): 1.3330 – 1.3350
🔴 Invalidation Level: 1.3319
🟣 Major Support: 1.3213
📋 Trading Plan
✅ Wait for price to retest the FVG.
✅ Look for bullish confirmation (Bullish Engulfing, Pin Bar, or lower-timeframe BOS).
✅ Enter only after confirmation.
🛑 Stop Loss: Below 1.3319
🎯 Take Profit 1: 1.3380
🎯 Take Profit 2: 1.3404
⭐ Final Outlook
📈 Bias: 🟢 Bullish
As long as price remains above 1.3319, buyers are likely to stay in control. A confirmed reaction from the Fair Value Gap (FVG) could provide an opportunity for the next bullish move toward 1.3404.
⚠️ Disclaimer: This analysis is for educational purposes only. Always use proper risk management and wait for trade confirmation before entering the market.
One chart. Two opinions. What's yours?price is approaching a demand zone (blue area). A bullish fractal forming inside that zone would strengthen Option A (direct bullish move). If price first creates a bearish fractal and sweeps lower into the deeper demand, then Option B becomes more likely before the bullish continuation.
EURUSD — Bearish EMA Trend, Sell From Fibonacci Value Zone
Fundamental Analysis
EURUSD remains under pressure as traders continue to watch USD momentum, Fed expectations, and upcoming macro data.
For now, the main structure still favours sellers while price trades below the higher EMA resistance zone. Any recovery should be viewed as a corrective pullback unless EURUSD can reclaim the main sell zone with strong confirmation.
Technical Analysis
On the 2H chart, EURUSD is still moving in a bearish structure. EMA 34, EMA 89, and EMA 200 remain positioned above the key recovery area, showing that the main trend is still controlled by sellers.
Price is currently around 1.1417 after a short-term rebound from the lower area. However, this recovery is moving toward the Fibonacci value zone, where sellers may look for continuation entries.
The first reaction zone is around 1.1435 - 1.1440, where price has already tested the Fibonacci area. The stronger sell zone is around 1.1458 - 1.1474, which aligns with Fibonacci retracement, previous structure, and EMA resistance.
If price reaches this sell zone and rejects, the bearish continuation scenario remains valid. The main downside target is the Fibonacci extension zone around 1.1297.
Important Key Levels
Current price area: 1.1417
Fibonacci reaction zone: 1.1435 - 1.1440
Main sell price zone: 1.1458 - 1.1474
EMA resistance area: 1.1474 - 1.1490
Short-term support: 1.1390 - 1.1360
Fibonacci target: 1.1297
Invalidation area: above 1.1490
Trading Scenario
Main Sell Scenario
Entry: 1.1458 - 1.1474
Stop Loss: 1.1490
Take Profit 1: 1.1390
Take Profit 2: 1.1360
Take Profit 3: 1.1297
Sell Condition
The preferred setup is to wait for EURUSD to recover into the 1.1458 - 1.1474 sell zone. This area is important because it combines Fibonacci retracement, EMA resistance, and previous bearish structure.
A sell setup becomes more valid if price forms bearish rejection from this zone, such as a long upper wick, bearish engulfing candle, failed breakout, or lower high below the EMA structure.
If price rejects from the sell zone and breaks back below 1.1390, the bearish continuation view becomes stronger. The next downside focus would be 1.1360, followed by the Fibonacci target around 1.1297.
Alternative Buy Scenario
Entry: 1.1390 - 1.1400
Stop Loss: 1.1360
Take Profit 1: 1.1435
Take Profit 2: 1.1458
Take Profit 3: 1.1474
Buy Condition
This is only a short-term corrective bounce setup, not the main trend view. A buy setup is valid only if EURUSD holds above 1.1390 and forms clear bullish rejection.
If price fails to hold this area, the bounce setup is invalid and sellers may push directly toward the Fibonacci target zone.
Entry Conditions
Wait for price to retest 1.1458 - 1.1474.
Look for bearish rejection before entering sell.
Do not sell aggressively at the low without a pullback.
A break below 1.1390 confirms stronger downside pressure.
If price breaks and holds above 1.1490, the sell setup is invalid.
Overall, the main view remains bearish while EURUSD trades below the EMA resistance structure. The preferred plan is to wait for a corrective pullback into the Fibonacci value zone, then look for sell confirmation toward 1.1390, 1.1360, and the Fibonacci target around 1.1297.
Do you share the same bearish view on EURUSD, or are you waiting for a cleaner rejection from the Fibonacci value zone first?
USDJPY Pullback May Offer a Fresh Buy SetupUSDJPY has cooled off after touching 162.70, but the broader bullish structure is still alive. The current move looks more like profit-taking than a confirmed trend reversal.
The key support now sits around 160.50–160.70. If this zone holds, buyers may attempt another push toward 161.80 and 162.50.
Trade Setup:
Buy Zone: 160.50 – 160.70
Stop Loss: 160.10
Take Profit 1: 161.80
Take Profit 2: 162.50
Rising Channel Market StructureOverview
This chart highlights a Rising Channel Market Structure, where price continues to trade within two upward-sloping parallel trendlines. The formation reflects a sustained bullish trend, with higher highs and higher lows indicating continued buying interest.
⸻⸻⸻⸻⸻⸻⸻⸻⸻⸻⸻
📘 Key Price Action
Price continues to respect the lower channel support.
Higher Highs (HH) and Higher Lows (HL) confirm the bullish trend.
The upper channel continues to provide dynamic resistance.
The lower channel continues to provide dynamic support.
Price remains confined within the ascending channel structure.
⸻⸻⸻⸻⸻⸻⸻⸻⸻⸻⸻
📊 Chart Explanation
- The lower boundary of the channel acts as dynamic support.
- The upper boundary of the channel acts as dynamic resistance.
- Buyers continue to defend higher price levels.
- Sellers remain active near the upper channel.
- Higher highs and higher lows reinforce the prevailing bullish market structure.
- The ascending channel continues to guide price movement.
⸻⸻⸻⸻⸻⸻⸻⸻⸻⸻⸻
Observation
- The market continues to maintain a healthy bullish trend.
- Price remains well supported within the channel.
- Both channel boundaries continue to influence market direction.
- No confirmed breakdown of the channel structure has occurred.
⸻⸻⸻⸻⸻⸻⸻⸻⸻⸻⸻
## Future Outlook
The bullish trend remains intact while channel support holds.
Continued respect of channel support may favor further upside movement.
A breakout above the upper channel could strengthen bullish momentum.
A close below the lower channel may indicate weakening momentum and a potential trend reversal.
⸻⸻⸻⸻⸻⸻⸻⸻⸻⸻⸻
📌 Summary
Price continues to trade within a well-defined Rising Channel Market Structure. As long as the lower channel support remains intact, the broader bullish trend continues to favor buyers. The channel boundaries remain the key areas to monitor for future market direction.
⸻⸻⸻⸻⸻⸻⸻⸻⸻⸻⸻
⚠️ Disclaimer
📘 For educational purposes only.
🙅 Not SEBI registered.
❌ Not a buy/sell recommendation.
🧠 Purely a learning resource.
📊 Not Financial Advice.
⸻⸻⸻⸻⸻⸻⸻⸻⸻⸻⸻
EURUSD: Institutional liquidity sweep 📊 Market Structure & Institutional Liquidity Sweep:
EURUSD on the 1H timeframe has shifting structural dynamics. The price action successfully completed a major sell-side liquidity hunt 🏹 (LQ Sweep) at the bottom curve, flushing out weak hands before institutional buying pressure stepped in.
🔍 SMC Technical Confluences:
🔄 Change of Character (CHOCH): Following the liquidity sweep, price surged aggressively to the upside, breaking the corrective descending structure and printing a clear bullish CHOCH. This marks a significant shift in immediate order flow from bearish to bullish.
📍 Demand / Mitigation Zone: A fresh demand block has been established around the 1.14300 region. Price is currently softening into this discount zone to mitigate pending buy orders.
🚀 Upside Target: If the demand matrix holds firm, a powerful bullish expansion is highly anticipated to target overhead liquidity pools and structural highs.
⚡ Execution & Confirmation Strategy:
We are closely monitoring 🕵️♂️ the price action as it mitigates the designated demand/buying zone. Waiting for lower-timeframe structural validation or a bullish rejection candle inside this zone will provide a high-probability entry with strict risk management parameters.
🛡️ Risk Disclaimer:
This setup is purely based on market structure probabilities and institutional order flow confluences for educational purposes. Always prioritize capital preservation
GBPJPY Multi Time-Frame Analysis Hello traders , here is the full multi time frame analysis for this pair, let me know in the comment section below if you have any questions , the entry will be taken only if all rules of the strategies will be satisfied. wait for more price action to develop before taking any position. I suggest you keep this pair on your watchlist and see if the rules of your strategy are satisfied.
USD/CAD Analysis🇮🇳 USD/CAD Analysis 📉🔥
🏷️ Strong Bearish Setup from Resistance
USD/CAD has faced a solid rejection from the 1.4230–1.4250 resistance zone, showing that sellers are becoming active. The pair has failed to break above resistance, indicating a higher chance of a bearish move in the coming sessions.
📊 Market Outlook
🔴 Strong rejection from the resistance area.
📉 Buying momentum is weakening, while sellers are gaining control.
⚠️ A drop towards the first Order Block (OB) looks likely.
💥 If this support breaks, the pair may continue falling towards the next demand zone.
🎯 Targets
✅ TP1: Around 1.4155
✅ TP2: Around 1.4100
🚨 Invalidation
If the price closes above 1.4250, the bearish view will become invalid, and bullish momentum may return.
📌 Bias: Bearish 📉
💡 Trading Plan: Wait for confirmation and look for sell opportunities while the price stays below the resistance zone.
EURUSD: 1.1405 – A Key Test of Bearish ControlOn the H4 timeframe, EURUSD is experiencing a technical rebound toward the 1.1398 level, yet the broader picture remains unchanged: the primary trend is bearish. Price remains below the Ichimoku cloud and is re-approaching a downtrend line that has previously triggered selling reactions. This indicates that the bulls have only managed a short-term bounce, insufficient to reverse the market structure.
The 1.1405 zone serves as a critical test point. It acts not only as immediate resistance but also as a potential retest level before the bears regain control. If EURUSD faces rejection around this area, selling pressure could rapidly drive the price back to the 1.1363 level. Should this support level break, the next target would extend toward 1.1300.
Notably, the current rebound lacks a clear bullish structure. While the price has risen, it remains trapped beneath resistance, the cloud, and the downtrend line. Given that the USD remains supported ahead of US employment data, EURUSD is likely to remain under pressure unless it can decisively break through the 1.1405 zone.
Entry Focus: Prioritize SELL positions around 1.1395–1.1405 if rejection candles or signs of weakness appear at resistance.
Target: 1.1300
Invalidation: The bearish scenario is invalidated if the price closes clearly above 1.1420 on the H4 timeframe, particularly if it decisively breaks the downtrend line.
GBPUSD | Short from Premium ZoneAfter an impulsive bullish move and a clear Change of Character (CHoCH), price has rallied into a higher-timeframe premium zone, where previous supply and liquidity align. The current reaction suggests buyers may be losing momentum as price tests a key resistance area.
I'm looking for a short from this premium region with defined risk.
Trade Setup:
Entry: 1.33023
Stop Loss: 45 pips
Take Profit: 73 pips
Risk:Reward: 1:1.62
Why I'm Taking This Trade:
Price has reached the premium zone, an area where I prefer looking for selling opportunities.
Resistance aligns with previous structure, increasing the probability of a rejection.
Risk is predefined with a hard stop loss—capital preservation always comes first.
If price invalidates the setup by closing above the zone, I'll accept the loss and wait for the next opportunity.
This is a rule-based trade, not a prediction. I only execute when my conditions align and always respect my stop loss.
Trade Levels
📍 Sell: 1.33023
🛑 SL: 45 pips
🎯 TP: 73 pips
Educational purposes only. This is not financial advice. Always manage your risk and trade according to your own plan.
USDJPY: Buyers retain the advantage for a move to 162.70USDJPY is trading around 162.52 following a pullback from the short-term high. On the positive side, the price has maintained support near 162.40 and remains within the equilibrium zone above the Ichimoku cloud.
The price has approached and successfully absorbed the immediate short-term downtrend line. If USDJPY holds above 162.40, there is a high probability of another push upward to retest the 162.70 level. Given the continued weakness of the JPY, current pullbacks are more likely to be viewed as opportunities for buyers to re-enter the market rather than signals of a trend reversal.
Entry Focus: Prioritize BUY positions around 162.40–162.50, provided the price holds support and a bullish confirmation candle appears.
Target: 162.70
Invalidation: The bullish scenario weakens if the H1 candle closes below 162.30.