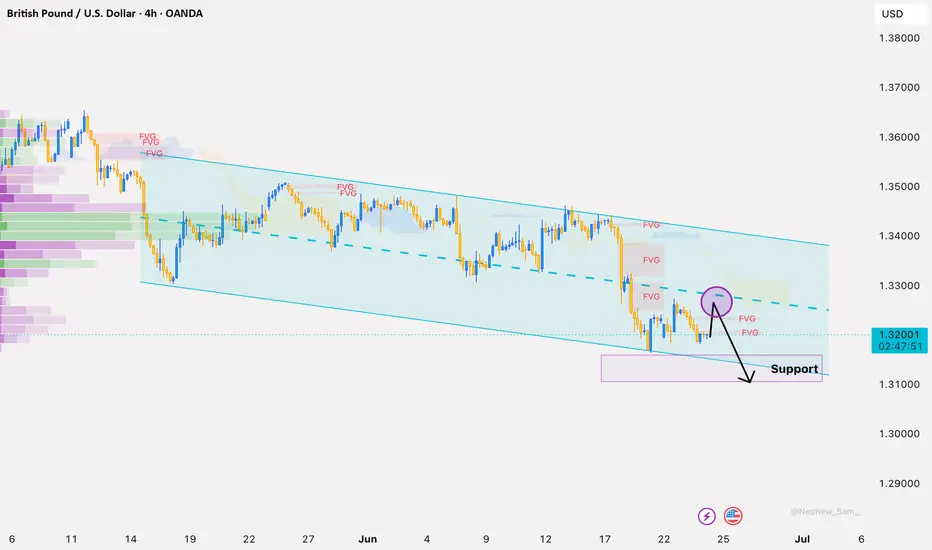
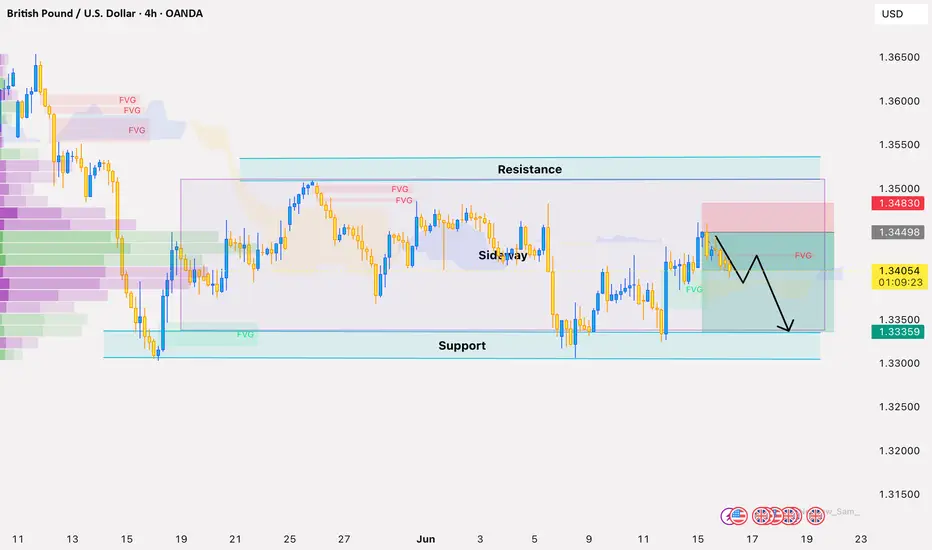
GBPUSD — EMA Bearish Trend, Sell From Fibonacci Confluence
Fundamental Analysis
GBPUSD remains under pressure as traders continue to watch USD momentum, U.K. data, and broader market risk sentiment.
For now, the technical structure still favours sellers while price trades below the main EMA range. Any recovery should be treated as a corrective pullback unless GBPUSD can reclaim the key resistance zone with strong confirmation.
Technical Analysis
On the 1H chart, GBPUSD is still trading below EMA 34, EMA 89, and EMA 200. This confirms that the short-term trend remains bearish, with the EMA structure acting as dynamic resistance above price.
Price is currently around 1.3178 after a short recovery from the lower area. However, this recovery is moving toward a key sell zone around 1.3206 - 1.3210.
This zone is important because it aligns with Fibonacci retracement, the descending trendline, previous structure, and the EMA bearish pressure. If price reaches this area and rejects, sellers may continue to control the next move.
The downside target is placed around the Fibonacci confluence zone near 1.3062 - 1.3058. This is the main bearish target shown on the chart if the sell continuation setup develops.
Important Key Levels
Current price area: 1.3178
Main sell zone: 1.3206 - 1.3210
Fibonacci + trendline confluence: 1.3206 - 1.3210
EMA resistance area: 1.3206 - 1.3260
Short-term resistance: 1.3260 - 1.3267
Near support: 1.3160 - 1.3170
Main Fibonacci target zone: 1.3062 - 1.3058
Invalidation area: above 1.3267
Trading Scenario
Main Sell Scenario
Entry: 1.3206 - 1.3210
Stop Loss: 1.3267
Take Profit 1: 1.3160
Take Profit 2: 1.3120
Take Profit 3: 1.3062 - 1.3058
Sell Condition
The preferred setup is to wait for GBPUSD to pull back into the 1.3206 - 1.3210 sell zone. This area combines Fibonacci retracement, trendline resistance, and EMA bearish pressure.
A sell setup becomes more valid if price forms bearish rejection from this zone, such as a long upper wick, bearish engulfing candle, failed breakout, or lower high below the EMA structure.
If price rejects from the sell zone and breaks below 1.3160, the bearish continuation view becomes stronger. The next downside focus would be 1.3120, followed by the Fibonacci confluence target around 1.3062 - 1.3058.
Entry Conditions
Wait for price to retest 1.3206 - 1.3210.
Look for bearish rejection before entering sell.
A break below 1.3160 confirms stronger downside pressure.
If price breaks and holds above 1.3267, the sell setup is invalid.
Overall, the main view remains bearish while GBPUSD trades below EMA 34, EMA 89, EMA 200, and the descending trendline. The preferred plan is to wait for a pullback into the Fibonacci and trendline confluence zone, then look for sell confirmation toward 1.3160, 1.3120, and 1.3062 - 1.3058.
Do you share the same bearish view on GBPUSD, or are you waiting for a cleaner rejection from the Fibonacci confluence zone?
EURUSD — EMA Bearish Trend, Sell From Value Zone
Fundamental Analysis
EURUSD remains under bearish pressure as price continues to trade below the main EMA structure. Traders are still watching USD momentum, Fed expectations, and upcoming macro data.
For now, the technical structure still favours sellers while recovery attempts remain limited below EMA resistance.
Technical Analysis
On the 2H chart, EURUSD is trading below EMA 34, EMA 89, and EMA 200. This shows that the short-term trend remains bearish, with the EMA structure acting as dynamic resistance above price.
Price is currently around 1.1352 after a strong bearish move. The market is now consolidating below the previous breakdown area, but this reaction has not confirmed a bullish reversal.
The key sell value zone is around 1.1384 - 1.1405. This area aligns with the Fibonacci retracement zone, high liquidity area, and previous short-term structure. If price pulls back into this zone and rejects, sellers may continue to defend the downtrend.
The key support level is around 1.1325. If price breaks below this area with strong bearish momentum, the next downside target is the lower liquidity zone around 1.1229.
Important Key Levels
Current price area: 1.1352
Sell value zone: 1.1384 - 1.1405
Fibonacci + High Liquidity zone: 1.1384 - 1.1405
EMA resistance area: 1.1445 - 1.1533
Key support: 1.1325
Main downside target: 1.1229
Invalidation area: above 1.1405
Trading Scenario
Main Sell Scenario
Entry: 1.1384 - 1.1405
Stop Loss: 1.1533
Take Profit 1: 1.1325
Take Profit 2: 1.1280
Take Profit 3: 1.1229
Sell Condition
The preferred setup is to wait for EURUSD to pull back into the 1.1384 - 1.1405 sell value zone. This area combines Fibonacci retracement, high liquidity, and previous structure.
A sell setup becomes more valid if price forms bearish rejection from this zone, such as a long upper wick, bearish engulfing candle, failed breakout, or lower high below the EMA structure.
If price rejects from the sell zone and breaks below 1.1325, the bearish continuation view becomes stronger. The next downside focus would be 1.1280, followed by the main target around 1.1229.
Entry Conditions
Wait for price to retest 1.1384 - 1.1405.
Look for bearish rejection before entering sell.
A break below 1.1325 confirms stronger downside pressure.
If price breaks and holds above 1.1405, the short-term sell setup becomes weaker.
Overall, the main view remains bearish while EURUSD trades below EMA 34, EMA 89, and EMA 200. The preferred plan is to wait for a pullback into the Fibonacci and high-liquidity value zone, then look for sell confirmation toward 1.1325 and 1.1229.
Do you share the same bearish view on EURUSD, or are you waiting for a cleaner rejection from the value zone first?
Liquidity and Market Movement:Many traders believe markets move randomly.
One day price breaks a resistance level and rallies. The next day it breaks the same type of level and immediately reverses. Sometimes a stop loss gets hit perfectly before the market moves exactly in the expected direction.
After experiencing this enough times, traders begin asking the same question:
Is the market really random, or is it moving toward something?
The answer often lies in one of the most important concepts in modern price action:
* Liquidity.
Understanding liquidity can completely change the way you view charts. Instead of seeing random candles and unpredictable movements, you begin to understand why price is attracted to certain areas and why some moves happen before the real move begins.
What Is Liquidity?
In simple terms, liquidity is where a large number of buy and sell orders exist.
Financial markets need liquidity to function.
Large institutions cannot simply place massive orders whenever they want. They need enough participants on the opposite side of the trade.
Because of this, price is often drawn toward areas where many orders are waiting.
Think of liquidity as fuel.
Without fuel, the market cannot make significant moves.
Why Stop Losses Attract Price
One of the biggest misconceptions among retail traders is that stop losses are hidden from the market.
In reality, stop-loss orders often gather around obvious chart levels.
For example:
Above major resistance
Below major support
Above previous highs
Below previous lows
Around trendline breaks
When many traders place stop losses in the same location, those areas become liquidity pools.
Price may move toward these zones because they contain the orders institutions need to fill larger positions.
This is why traders often feel like the market "hunted" their stop loss.
The market is not targeting individual traders.
It is seeking liquidity.
Equal Highs and Equal Lows
Equal highs and equal lows are among the clearest signs of potential liquidity.
When multiple highs form at the same level, many traders see resistance.
Short sellers enter positions.
Breakout traders place buy-stop orders above the highs.
At the same time, short sellers place stop losses above those highs.
All of these orders create liquidity.
As a result, price is often attracted to equal highs before making its next major decision.
The same principle applies to equal lows.
These areas act like magnets because of the concentration of orders sitting there.
The Truth About Breakout Traps
Every trader has experienced a breakout that looked perfect.
Price breaks resistance.
Volume increases.
Momentum appears strong.
Then suddenly the market reverses and moves in the opposite direction.
This is known as a breakout trap.
The breakout itself may have been enough to trigger buy orders and stop losses, providing liquidity for larger participants.
Once sufficient liquidity is collected, the market can move in its intended direction.
This is why experienced traders often wait for confirmation rather than entering immediately after every breakout.
Patience can be one of the best forms of risk management.
Institutional Movement and Market Behavior
Large institutions operate differently from retail traders.
They manage positions worth millions or even billions of dollars.
Because of their size, they cannot simply enter trades with a single click.
They need liquidity.
This is why institutional activity is often associated with:
Liquidity grabs
Stop-loss sweeps
False breakouts
Sharp reversals
Strong reactions at key levels
While retail traders focus on candles, institutions often focus on where orders are concentrated.
Understanding this difference helps explain many market movements that initially seem confusing.
Liquidity Before Direction
One of the most valuable lessons a trader can learn is that price often seeks liquidity before revealing its true direction.
A market may sweep highs before falling.
It may sweep lows before rallying.
It may trigger breakout traders before reversing.
The purpose is often the same:
To access liquidity.
Once that liquidity is available, the market can continue its larger move.
This idea helps traders avoid emotional decisions and encourages them to focus on the bigger picture.
Final words:
Liquidity is one of the hidden forces that drive financial markets.
It explains why price often moves toward obvious levels.
It explains many false breakouts and stop-loss sweeps.
And it helps traders understand that the market is not simply moving from one candle to the next.
It is constantly searching for liquidity.
When you begin looking at charts through the lens of liquidity, you stop asking why your stop loss was hit.
Instead, you start asking where liquidity is located and where price is most likely to go next.
That shift in perspective can completely change the way you understand market movement.
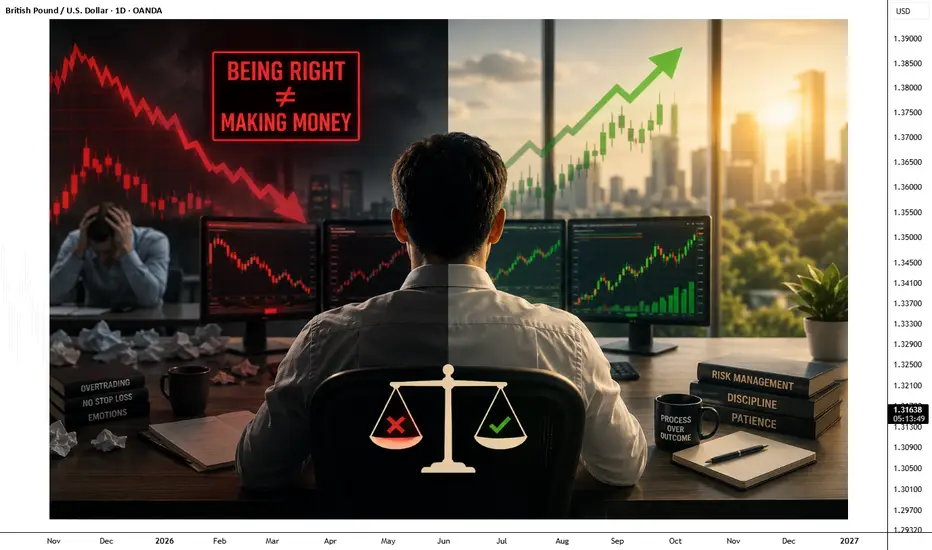
Being Right Is Not Enough to Make Money in Trading!Many traders enter the market believing that success comes from predicting the direction correctly. They think that if they can identify whether the price will go up or down, profits will automatically follow. But the market does not reward being right. It rewards managing risk, controlling emotions, and making decisions that create positive outcomes over time.
A trader can be right about the market direction and still lose money. A trader can predict a stock will fall, enter too early, use a large position size, and get stopped out before the actual move happens. The analysis was correct, but the execution was wrong.
The Difference Between Prediction and Profit
Trading is not a game of proving who has the best prediction. It is a game of probabilities. Professional traders understand that even the best setups can fail. Their goal is not to win every trade; their goal is to make sure their winning trades are larger than their losing trades.
A trader who wins 40% of the time can still make money if their risk management is strong. Meanwhile, a trader who wins 80% of the time can lose everything if they take unnecessary risks.
Being Right With Bad Risk Management Still Fails
Imagine a trader buys a stock at $100 because they believe it will reach $120. Their analysis is correct, and the stock eventually reaches the target. But before moving higher, the price drops to $90. If the trader used excessive leverage or no stop loss, they may have already been forced out of the trade. The market moved according to their idea, but they were not able to survive the journey.
The market does not care about your prediction. It only cares about your position size and your ability to handle uncertainty.
The Ego Trap of Being Right
Many traders become emotionally attached to their analysis. When the market moves against them, they refuse to accept that their timing was wrong. They hold losing positions because they want the market to prove them right.
This creates a dangerous mindset where protecting the ego becomes more important than protecting the account. Successful traders focus less on being right and more on responding correctly to what the market shows them.
Execution Creates Results
Two traders can have the same strategy, the same entry, and the same market view. One can make money while the other loses.
The difference is often in execution. One trader follows the plan, respects the stop loss, and takes profits according to their system. The other trader changes decisions based on fear, greed, or hope. Trading success is not created by finding perfect analysis. It is created by consistently executing a good process.
The Real Goal of a Trader
The goal is not to predict every move. The goal is to protect capital when you are wrong and maximize opportunities when you are right. A professional trader accepts that losses are part of the business. They do not measure themselves by how often they are correct. They measure themselves by whether their decisions produce results over hundreds of trades.
In the market, being right feels good, but being profitable is what matters. The best traders are not those who always predict the future. They are those who know how to manage themselves when the future is uncertain.
By @BrightRally_Research on @TradingView Forex Basics: 2. Understanding Orders and Market BehaviorBefore starting, make sure to check out Part 1, where we covered the basics of Forex, including currency pairs, pips, spreads, lot sizes, and leverage.
Part 1:Forex Basics Every Beginner Must Know!
1. Types of Orders?
-------------------
In Forex, an order is simply an instruction given to your broker to buy or sell a currency pair. Some orders are executed immediately, while others are executed only when the price reaches a specific level.
Orders are mainly divided into two categories:
Market Orders
Pending Orders
1. Market Order: A Market Order means buying or selling immediately at the current market price. As soon as you place the order, your trade is executed instantly. Market orders are used when you want to enter the market right away.
A. Buy Market Order: When you place a Buy Market Order, you expect the price to rise.
B. Sell Market Order: When you place a Sell Market Order, you expect the price to fall.
2. Pending Orders: Sometimes traders do not want to enter the market immediately. Instead, they want the trade to open automatically when the price reaches a certain level. These orders are called Pending Orders.
There are four types of pending orders:
Buy Limit
Sell Limit
Buy Stop
Sell Stop
1. Buy Limit Order
———————
A Buy Limit Order is placed below the current market price. It is used when you expect the price to fall first and then move upward.
Example
Suppose EUR/USD is currently trading at 1.1000.
You believe the price may drop to 1.0950 and then continue rising.
Instead of buying immediately, you place a Buy Limit Order at 1.0950.
If the price falls to 1.0950, the trade opens automatically.
If the market then rises to 1.1050, you make a profit.
In simple words:
Current Price = 1.1000
Buy Limit = 1.0950
Expectation:
Price goes down first and then moves up.
2. Sell Limit Order
————————
A Sell Limit Order is placed above the current market price. It is used when you expect the price to rise first and then move downward.
Example
Suppose EUR/USD is trading at 1.1000.
You believe the price may rise to 1.1050 before falling.
Instead of selling immediately, you place a Sell Limit Order at 1.1050.
If the price reaches 1.1050, the trade opens automatically.
If the market then falls to 1.1000, you make a profit.
In simple words:
Current Price = 1.1000
Sell Limit = 1.1050
Expectation:
Price goes up first, then down.
3. Buy Stop Order
————————
A Buy Stop Order is placed above the current market price.
It is used when you expect the price to continue rising after breaking a certain level.
Example:
Suppose EUR/USD is trading at 1.1000.
You believe that if the price breaks above 1.1050, it will continue moving upward.
You place a Buy Stop Order at 1.1050.
If the price reaches 1.1050, your trade opens automatically.
If the market later rises to 1.1100, you make a profit.
In simple words:
Current Price = 1.1000
Buy Stop = 1.1050
Expectation:
Price goes up and continues moving higher.
4. Sell Stop Order:
————————
A Sell Stop Order is placed below the current market price.
It is used when you expect the price to continue falling after breaking a certain level.
Example:
Suppose EUR/USD is trading at 1.1000.
You believe that if the price breaks below 1.0950, it will continue moving downward.
You place a Sell Stop Order at 1.0950.
If the price reaches 1.0950, your trade opens automatically.
If the market later falls to 1.0900, you make a profit.
In simple words:
Current Price = 1.1000
Sell Stop = 1.0950
Expectation:
Price goes down and continues moving lower.
Note:
A. Limit Orders expect a reversal.
B. Stop Orders expect a breakout.
2. Bid Price and Ask Price?
------------------------
When you look at a Forex pair, you will always see two prices.
Bid Price → The price at which you can sell.
Ask Price → The price at which you can buy.
The difference between these two prices is called the Spread.
Example:
Bid Price = 1.1000
Ask Price = 1.1002
Spread = 2 pips
This means every trade starts with a small cost, which is the spread.
3. Trading Sessions:
-------------------
The Forex market operates 24 hours a day because different countries open and close at different times.
There are four major trading sessions:
Sydney Session
Tokyo Session
London Session
New York Session
However, each session behaves differently. Some sessions are calm, while others are highly volatile.
Understanding these sessions helps traders know when the market is likely to move the most.
1. Sydney Session:
The Sydney Session is the first session to open after the weekend.
Generally, this session is quiet and has lower volatility because fewer traders are active.
Price movements are usually smaller compared to other sessions.
Because of this, many traders use this time to observe the market rather than look for large moves.
2. Tokyo Session (Asian Session)
The Tokyo Session is also known as the Asian Session.
Compared to the Sydney Session, trading activity increases, but volatility is still relatively low.
Currency pairs involving the Japanese Yen (JPY), Australian Dollar (AUD), and New Zealand Dollar (NZD) are usually more active during this period.
Example: USD/JPY, EUR/JPY, AUD/USD, NZD/USD
During this session, prices often move within a range and trends are generally slower.
3. London Session
The London Session is considered one of the most important sessions in Forex.
This session has very high trading volume because many banks, institutions, and traders participate in the market.
As a result, price movements become larger and volatility increases.
Many strong trends begin during the London Session.
Currency pairs such as:
EUR/USD, GBP/USD, EUR/GBP, USD/CHF
often experience significant movement during this period.
Because of the high volatility, this session is preferred by many day traders and scalpers.
4. New York Session
The New York Session is another highly active session. Major economic news releases from the United States are often announced during this time. As a result, volatility can increase rapidly.
Currency pairs containing the US Dollar usually experience strong price movements.
Examples: EUR/USD, GBP/USD, USD/CAD, USD/JPY
The first half of the New York Session is generally more active than the second half.
As the session approaches closing time, market activity gradually decreases.
Important Topic: London and New York Overlap
When the London Session and New York Session are open at the same time, trading activity reaches its peak.
This period is considered one of the busiest times in the Forex market.
During this overlap:
Trading volume is highest.
Volatility increases.
Spreads are usually lower.
Strong price movements are common.
Because of these reasons, many traders prefer trading during this period.
Session Comparison:
4. Margin Call
-----------------
A Margin Call happens when the funds available in your trading account become too low to support your open positions. In simple words, it is a warning from your broker that your losses are increasing and your account does not have enough money to maintain the trades. This usually happens when the market moves against your position and your account equity falls below a certain level required by the broker.
If losses continue to increase, the broker may automatically close some or all of your open trades to prevent your account balance from going negative. This process is known as a Stop Out.
For example, suppose you have $100 in your account and open a large position using leverage. If the market moves against you and your losses become too large, your available margin will decrease. Once it reaches the broker's minimum requirement, a Margin Call occurs, and if the losses continue, the broker may close your trades automatically to protect both you and the broker from further losses.
5. Stop Loss and Take Profit
---------------------------------
Whenever traders open a trade, they can set two important price levels:
1. Stop Loss (SL)
2. Take Profit (TP)
These levels help traders manage risk and profits automatically.
1. Stop Loss:
A Stop Loss is a price level where your trade automatically closes to limit your losses.
In simple words, it acts as a safety net that prevents small losses from becoming very large losses.
Example:
Suppose you buy EUR/USD at 1.1000.
You set your Stop Loss at 1.0950.
If the market falls to 1.0950, your trade will close automatically.
Loss = 50 pips.
2. Take Profit:
A Take Profit is a price level where your trade automatically closes after reaching your desired profit.
Example:
Suppose you buy EUR/USD at 1.1000.
You set your Take Profit at 1.1100.
If the price rises to 1.1100, your trade closes automatically.
Profit = 100 pips.
In simple words:
Stop Loss protects your capital.
Take Profit locks in your profits.
6. Profit and Loss Calculation
----------------------------------
Profit and loss in Forex mainly depend on three things:
Lot size.
Number of pips moved.
Direction of your trade.
Example:
Suppose you buy EUR/USD.
Lot Size = 0.10 lot.
Price moves from 1.1000 to 1.1020.
Difference = 20 pips.
Profit = $20.
Similarly, if the market moves down by 20 pips,
Loss = $20.
The larger the lot size, the larger the profit and loss.
7. Why Beginners Should Use a Demo Account
--------------------------------------------------
Before risking real money, many traders start with a Demo Account.
A Demo Account allows you to trade using virtual money while experiencing real market conditions.
This helps beginners understand:
How to place orders.
How leverage works.
How profits and losses change.
How to manage risk.
Because no real money is involved, traders can learn without fear of losing capital. However, emotions are different when trading with real money. Therefore, many traders move from a Demo Account to a Live Account only after gaining enough experience.
Holy Grail Note: Learning Forex is not only about making profits. Understanding risk management and protecting your capital is equally important. Many beginners focus only on profits, but experienced traders focus first on controlling losses.
In Part 3, we will move from how trades work to how traders analyze the market using candlesticks, timeframes, trends, support and resistance, and basic market structure.
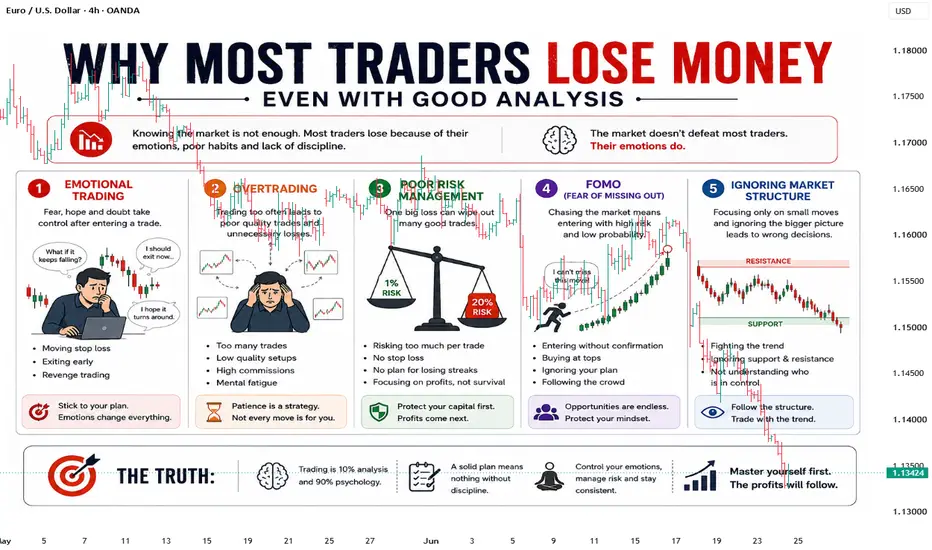
On @TradingView By @BrightRally_Research Why Most Traders Lose Money Even With Good Analysis?If trading success depended only on technical analysis, many traders would already be profitable.
Most traders know how to draw support and resistance. They understand trends, candlestick patterns, and indicators. Some can even predict market direction with surprising accuracy.
Yet they still lose money.
Why?
Because in trading, being right about the market is not enough. The real challenge is managing yourself.
After watching traders for years, one thing becomes clear: most losses are not caused by bad analysis. They are caused by emotions, poor discipline, and decisions made in the heat of the moment.
The Market Doesn't Defeat Most Traders. Their Emotions Do.
Imagine spending an hour analyzing a chart and finding what looks like the perfect setup.
You enter the trade.
A few minutes later, price moves slightly against you.
Suddenly, doubt appears.
You start checking lower timeframes. You move your stop loss further away. You hope the market turns around. Fear slowly replaces your original plan.
This is emotional trading.
The analysis may have been correct, but emotions changed the outcome.
The market rewards discipline far more than intelligence.
Overtrading: The Silent Account Killer
One of the biggest mistakes traders make is believing they must trade all the time.
After a winning trade, confidence becomes excitement.
After a losing trade, frustration becomes revenge.
In both situations, traders start taking trades that do not meet their original criteria.
More trades do not necessarily mean more profits.
Professional traders understand that patience is a strategy.
Sometimes the best trade is the one you don't take.
Good Analysis Cannot Save Poor Risk Management:
Many traders spend years improving entries but ignore risk management.
Ironically, risk management is often what separates profitable traders from losing traders.
Imagine two traders with the same strategy:
The first trader risks 1% per trade.
The second trader risks 20% because he is "confident."
Even if both have the same win rate, the second trader may destroy his account after a few losses.
The market does not care how certain you feel.
Protecting your capital should always come before chasing profits.
Because without capital, there is no next opportunity.
FOMO Makes Smart Traders Act Irrationally
Every trader knows this feeling.
You see a strong move happening.
The price keeps rising.
Social media is full of screenshots and profits.
And suddenly, you feel late.
So you enter without waiting for confirmation.
This is not analysis.
This is Fear of Missing Out.
Ironically, FOMO often pushes traders into the market exactly when risk is highest.
Professional traders understand that opportunities never disappear.
There will always be another setup.
Missing one trade is not a problem.
Forcing a bad trade often is.
Ignoring Market Structure Leads to Expensive Mistakes
Sometimes traders focus too much on individual candles and forget the bigger picture.
A bullish candle inside a strong downtrend does not automatically mean the trend has changed.
A breakout without proper structure can quickly become a fakeout.
Market structure helps traders understand:
Who is controlling the market.
Whether the trend is healthy.
Where buyers and sellers are likely to react.
When a trend may be weakening.
Without structure, traders often mistake noise for opportunity.
And that mistake can be costly.
The Hardest Part of Trading Is Not Analysis
Most people enter trading believing they need a perfect strategy.
Eventually, they realize something important:
The biggest challenge is not finding setups.
It is following the plan consistently.
Can you accept losses calmly?
Can you wait patiently?
Can you avoid revenge trading?
Can you protect your capital during difficult periods?
These questions determine long-term success far more than indicators or patterns.
Final Thoughts
Most traders do not lose because they lack knowledge.
They lose because emotions overpower their plans.
They overtrade after wins.
They chase markets because of FOMO.
They ignore risk when they feel confident.
And they abandon discipline when things become difficult.
The market is not only a test of analysis.
It is a test of patience.
A test of discipline.
And above all, a test of emotional control.
Because in trading, mastering yourself is often more important than mastering the chart.
If trading success depended only on technical analysis, many traders would already be profitable.
Most traders know how to draw support and resistance. They understand trends, candlestick patterns, and indicators. Some can even predict market direction with surprising accuracy.
Yet they still lose money.
Why?
Because in trading, being right about the market is not enough. The real challenge is managing yourself.
After watching traders for years, one thing becomes clear: most losses are not caused by bad analysis. They are caused by emotions, poor discipline, and decisions made in the heat of the moment.
The Market Doesn't Defeat Most Traders. Their Emotions Do.
Imagine spending an hour analyzing a chart and finding what looks like the perfect setup.
You enter the trade.
A few minutes later, price moves slightly against you.
Suddenly, doubt appears.
You start checking lower timeframes. You move your stop loss further away. You hope the market turns around. Fear slowly replaces your original plan.
This is emotional trading.
The analysis may have been correct, but emotions changed the outcome.
The market rewards discipline far more than intelligence.
Overtrading: The Silent Account Killer
One of the biggest mistakes traders make is believing they must trade all the time.
After a winning trade, confidence becomes excitement.
After a losing trade, frustration becomes revenge.
In both situations, traders start taking trades that do not meet their original criteria.
More trades do not necessarily mean more profits.
Professional traders understand that patience is a strategy.
Sometimes the best trade is the one you don't take.
Good Analysis Cannot Save Poor Risk Management
Many traders spend years improving entries but ignore risk management.
Ironically, risk management is often what separates profitable traders from losing traders.
Imagine two traders with the same strategy:
The first trader risks 1% per trade.
The second trader risks 20% because he is "confident."
Even if both have the same win rate, the second trader may destroy his account after a few losses.
The market does not care how certain you feel.
Protecting your capital should always come before chasing profits.
Because without capital, there is no next opportunity.
FOMO Makes Smart Traders Act Irrationally
Every trader knows this feeling.
You see a strong move happening.
The price keeps rising.
Social media is full of screenshots and profits.
And suddenly, you feel late.
So you enter without waiting for confirmation.
This is not analysis.
This is Fear of Missing Out.
Ironically, FOMO often pushes traders into the market exactly when risk is highest.
Professional traders understand that opportunities never disappear.
There will always be another setup.
Missing one trade is not a problem.
Forcing a bad trade often is.
Ignoring Market Structure Leads to Expensive Mistakes
Sometimes traders focus too much on individual candles and forget the bigger picture.
A bullish candle inside a strong downtrend does not automatically mean the trend has changed.
A breakout without proper structure can quickly become a fakeout.
Market structure helps traders understand:
Who is controlling the market.
Whether the trend is healthy.
Where buyers and sellers are likely to react.
When a trend may be weakening.
Without structure, traders often mistake noise for opportunity.
And that mistake can be costly.
The Hardest Part of Trading Is Not Analysis
Most people enter trading believing they need a perfect strategy.
Eventually, they realize something important:
The biggest challenge is not finding setups.
It is following the plan consistently.
Can you accept losses calmly?
Can you wait patiently?
Can you avoid revenge trading?
Can you protect your capital during difficult periods?
These questions determine long-term success far more than indicators or patterns.
Final words:
Most traders do not lose because they lack knowledge.
They lose because emotions overpower their plans.
They overtrade after wins.
They chase markets because of FOMO.
They ignore risk when they feel confident.
And they abandon discipline when things become difficult.
The market is not only a test of analysis.
It is a test of patience.
A test of discipline.
And above all, a test of emotional control.
Because in trading, mastering yourself is often more important than mastering the chart. EURUSD — Corrective Bounce Before Deeper Bearish Continuation
Fundamental Analysis
EURUSD remains under pressure as price continues to trade below the main EMA structure. Traders are still watching USD momentum, Fed expectations, and upcoming macro data.
For now, the recovery looks corrective, not a confirmed bullish reversal. If price fails at the value sell zone, sellers may continue to control the next move.
Technical Analysis
On the 1H chart, EURUSD is still trading below EMA 34, EMA 89, and EMA 200. The EMA structure is above price, showing that the short-term trend remains bearish.
Price is currently around 1.1445 after reacting from the lower buy zone near 1.1436 - 1.1445. This area may support one more corrective bounce before the next bearish leg.
The key sell zone is around 1.1491 - 1.1509. This zone aligns with the Fibonacci 0.618 retracement, previous structure, and value range resistance. If EURUSD reaches this area and rejects, the bearish continuation setup becomes cleaner.
Below current price, the main downside target is around 1.1383 - 1.1384. This is the target zone marked on the chart and may become the next liquidity objective if sellers regain control.
Important Key Levels
Current price area: 1.1445
Buy reaction zone: 1.1436 - 1.1445
Sell value range: 1.1491 - 1.1509
Fibonacci 0.618 sell zone: 1.1491 - 1.1509
EMA resistance area: 1.1498 - 1.1533
Short-term invalidation: above 1.1533
Main downside target: 1.1383 - 1.1384
Trading Scenario
Main Sell Scenario
Entry: 1.1491 - 1.1509
Stop Loss: 1.1533
Take Profit 1: 1.1445
Take Profit 2: 1.1416
Take Profit 3: 1.1383 - 1.1384
Sell Condition
The preferred setup is to wait for EURUSD to create one more corrective bounce into the 1.1491 - 1.1509 value range. This area is the main Fibonacci and resistance zone on the chart.
A sell setup becomes more valid if price forms bearish rejection from this zone, such as a long upper wick, bearish engulfing candle, failed breakout, or lower high below the EMA structure.
If price rejects from the sell zone and breaks back below 1.1436, the bearish continuation view becomes stronger. The next downside target would be 1.1416, followed by the main target around 1.1383 - 1.1384.
Alternative Buy Scenario
Entry: 1.1436 - 1.1445
Stop Loss: 1.1416
Take Profit 1: 1.1481
Take Profit 2: 1.1491
Take Profit 3: 1.1509
Buy Condition
This is only a short-term corrective bounce setup, not the main trend view. A buy setup is valid only if EURUSD holds the 1.1436 - 1.1445 buy zone and forms clear bullish rejection.
If price fails to hold this zone, the bounce scenario is invalid and sellers may push directly toward 1.1383 - 1.1384.
Entry Conditions
Wait for price to reach the value sell zone.
Look for bearish rejection around 1.1491 - 1.1509.
A break below 1.1436 confirms stronger downside pressure.
If price breaks and holds above 1.1533, the sell setup is invalid.
Overall, the main view remains bearish while EURUSD stays below EMA 34, EMA 89, and EMA 200. Price may create one more corrective bounce first, but the preferred plan is to look for sell confirmation from 1.1491 - 1.1509 toward 1.1416 and 1.1383 - 1.1384.
Do you share the same view that EURUSD may bounce first before a deeper drop, or are you waiting for a cleaner rejection from the value sell zone?
GBPUSD — Bearish Continuation From EMA & Fibonacci Value Zone
Fundamental Analysis
GBPUSD remains under pressure as price continues to trade below the main EMA structure. For next week, traders should keep watching USD momentum, U.K. data, and broader risk sentiment.
For now, the technical structure still favours sellers while recovery attempts remain capped below EMA resistance.
Technical Analysis
On the 4H chart, GBPUSD is still moving inside a bearish structure, with EMA 34, EMA 89, and EMA 200 positioned above price. This confirms that the broader trend remains bearish.
Price recently broke below the strong support zone around 1.3305 - 1.3324 and continued lower toward 1.3170 - 1.3180. The current move looks like a short-term recovery after a strong bearish displacement, not a confirmed bullish reversal.
The key sell zone is around 1.3305 - 1.3324. This area is important because it combines the previous strong support, Fibonacci 0.5 retracement, EMA resistance, and the support-turned-resistance structure.
The second reaction area is around 1.3275 - 1.3285, near the Fibonacci 0.618 zone. This may offer a short-term sell scalping reaction if price fails to reclaim higher structure.
The main downside target for next week is around 1.3090 - 1.3089, which aligns with the lower bearish projection and liquidity target on the chart.
Important Key Levels
Current price area: 1.3228
Sell scalping zone: 1.3275 - 1.3285
Main sell zone: 1.3305 - 1.3324
EMA resistance area: 1.3305 - 1.3370
Strong support turned resistance: 1.3305 - 1.3324
Short-term downside level: 1.3180
Main weekly target: 1.3090 - 1.3089
Invalidation area: above 1.3370
Trading Scenario
Main Sell Scenario
Entry: 1.3305 - 1.3324
Stop Loss: 1.3370
Take Profit 1: 1.3180
Take Profit 2: 1.3140
Take Profit 3: 1.3090 - 1.3089
Sell Condition
The preferred setup is to wait for GBPUSD to pull back into the 1.3305 - 1.3324 sell zone. This area aligns with Fibonacci retracement, EMA resistance, and the previous support zone that has now turned into resistance.
A sell setup becomes more valid if price forms bearish rejection from this zone, such as a long upper wick, bearish engulfing candle, failed breakout, or lower high below the EMA structure.
If price rejects from the sell zone and breaks back below 1.3180, the bearish continuation view becomes stronger. The next downside focus would be 1.3140, followed by the weekly target around 1.3090 - 1.3089.
Alternative Sell Scalping Zone
Entry: 1.3275 - 1.3285
Stop Loss: 1.3325
Take Profit 1: 1.3228
Take Profit 2: 1.3180
Take Profit 3: 1.3140
Sell Condition
This is the earlier sell reaction zone. It is only valid if price reaches 1.3275 - 1.3285 and shows clear bearish rejection below the main EMA resistance.
If price breaks strongly above this zone, the better setup is to wait for the main sell zone around 1.3305 - 1.3324.
Entry Conditions
Wait for price to retest the Fibonacci sell zone.
Look for bearish rejection before entering sell.
A break below 1.3180 confirms stronger downside pressure.
If price breaks and holds above 1.3370, the sell setup is invalid.
Overall, the main view for next week remains bearish while GBPUSD stays below EMA 34, EMA 89, EMA 200, and the broken support structure. The preferred plan is to wait for a pullback into the Fibonacci and EMA value zone around 1.3305 - 1.3324, then look for sell confirmation toward 1.3180 and 1.3090 - 1.3089.
Do you share the same bearish view on GBPUSD for next week, or are you waiting for a cleaner rejection from the EMA and Fibonacci value zone?
EURUSD — Bearish Continuation From Fibonacci Value Zones
Fundamental Analysis
EURUSD remains under pressure as price trades below the main EMA structure. For next week, traders should continue watching USD momentum, Fed expectations, and upcoming U.S. data, as these factors may drive volatility around key Fibonacci zones.
For now, the technical structure still favours sellers while recovery attempts remain capped below EMA resistance.
Technical Analysis
On the 4H chart, EURUSD is still moving inside a descending structure. EMA 34, EMA 89, and EMA 200 remain above price, confirming that the broader trend is still bearish.
Price is currently around 1.1465 after a strong bearish move below the previous support area. The recovery has not confirmed a bullish reversal yet, and the chart shows clear sell zones above price.
The first key sell area is around 1.1490 - 1.1505, near the 0.618 Fibonacci reaction zone. This area may act as the first resistance if price creates a short-term pullback.
The stronger Fibonacci value sell zone is around 1.1518 - 1.1531. This zone aligns with the golden ratio area, previous support turned resistance, and the EMA pressure.
The higher sell swing zone is around 1.1565 - 1.1582. This is the stronger resistance zone on the chart and may offer another sell opportunity if price retraces deeper.
The main downside target for next week is around 1.1372, which aligns with the lower channel area and bearish projection on the chart.
Important Key Levels
Current price area: 1.1465
Sell zone 1: 1.1490 - 1.1505
Fibonacci golden ratio sell zone: 1.1518 - 1.1531
Sell swing resistance: 1.1565 - 1.1582
EMA resistance area: 1.1525 - 1.1582
Short-term downside target: 1.1481
Main weekly bearish target: 1.1372
Invalidation area: above 1.1582
Trading Scenario
Main Sell Scenario 1 — Fibonacci 0.618 Retest
Entry: 1.1490 - 1.1505
Stop Loss: 1.1535
Take Profit 1: 1.1465
Take Profit 2: 1.1418
Take Profit 3: 1.1372
Sell Condition
The first sell setup is to wait for EURUSD to pull back into 1.1490 - 1.1505. This zone aligns with the 0.618 Fibonacci reaction area and short-term broken structure.
A sell setup becomes more valid if price forms bearish rejection from this zone, such as a long upper wick, bearish engulfing candle, failed breakout, or lower high below the EMA structure.
Main Sell Scenario 2 — Golden Ratio Value Zone
Entry: 1.1518 - 1.1531
Stop Loss: 1.1582
Take Profit 1: 1.1481
Take Profit 2: 1.1418
Take Profit 3: 1.1372
Sell Condition
The second sell setup is stronger if EURUSD retraces deeper into 1.1518 - 1.1531. This is the main Fibonacci golden ratio zone and also aligns with the previous support/resistance area.
If price rejects from this zone and fails to reclaim the EMA range, sellers may regain control and continue the bearish move toward 1.1481, then 1.1372.
Entry Conditions
Wait for price to retest one of the Fibonacci sell zones.
Look for bearish rejection before entering sell.
A break below 1.1465 strengthens the bearish continuation view.
If price breaks and holds above 1.1582, the sell setup is invalid.
Overall, the main view for next week remains bearish while EURUSD stays below EMA 34, EMA 89, EMA 200, and the descending trendline. The preferred plan is to wait for a pullback into the Fibonacci value zones, then look for sell confirmation toward 1.1481 and the weekly target around 1.1372.
Do you share the same bearish view on EURUSD for next week, or are you waiting for a cleaner retest of the Fibonacci value zone?

 Short
Short