GBP/USD (4H Chart) AnalysisGBP/USD (4H Chart) Analysis
- The pair is retracing after testing the daily golden fib ratio (0.618) at 1.3597
- Afterwards, minor pullbacks were witnessed
- Currently, the pair is testing crucial resistance at the iFVG zone, while prices are creating an inverted cup & handle pattern and the top of the trend.
- The prices are also forming a hidden bearish divergence with RSI
A bearish breakout below the fib zone 0.5 (1.3513) might drive the prices lower towards the strong support or green (FVG) zone near 1.3472
Key levels
- Possible Entry = 1.3510
- S1 = 1.3470
- S2 = 1.3440
- Resistance = 1.3545
Forex market
GBPUSD-M15-Liquidity taken. Now comes the real move.Price is currently trading into a key intraday supply zone, aligned with prior displacement and liquidity sweep.
The reaction here isn’t random.
This is where smart money decides whether to distribute… or get run over.
Key narrative:
• Price tapped into a refined supply / OB region
• Previous highs = liquidity pool already engineered
• Current push looks like a retracement, not expansion
• Structure still favors short-term bearish continuation
Game plan:
If this zone holds → expect a move back into inefficiencies below
If this breaks with displacement → market shifts, and shorts get punished
No prediction. Just reaction.
Levels to watch:
• Premium zone = sell interest
• Discount below = target delivery
EURUSD-M15Price is currently trading deep into a premium zone after a clean market structure shift (MSS).
This isn’t a random rally.
This is price returning to rebalance inefficiency + tap into supply.
What’s happening here:
• Strong bearish leg → created imbalance (FVG)
• Price delivered into discount → accumulation phase
• Current move = retracement into premium
• Now tapping a refined supply / OB zone
This is where weak longs get trapped.
Execution model:
If price respects this zone → expect continuation towards sell-side liquidity below
If price displaces above → short bias invalidated, look for continuation longs
Confluence:
• Premium pricing
• Supply zone alignment
• Inefficiency fill
• Structure still fragile on the upside
Targets:
• Internal liquidity first
• Then external range lows
No emotions. No predictions.
Just reacting where money moves.
#USDJPY Double flat correction end 💵 USDJPY: Double Correction Complete, Bulls Ready to Charge 🚀🔥⚡️
From 30 March, USDJPY entered its corrective phase:
📉🔻 A wave: Clear 3‑subwave decline → confirming a flat correction.
📈📊 Price retraced >61.8%, then dropped into C wave (8 Apr).
⏳⏱ Since C wave didn’t fully retrace in less time than it formed → a double correction unfolded.
🔄♻️ X wave (13 Apr): Marked transition.
📉📉 Followed by another flat ABC correction, ending on 17 Apr.
👉✅ With this structure complete, the setup points to a strong upward move ahead.
⚡️💪 Dollar strength looks ready to regain momentum.
📊📈 Stay alert — USDJPY could be gearing up for a breakout.
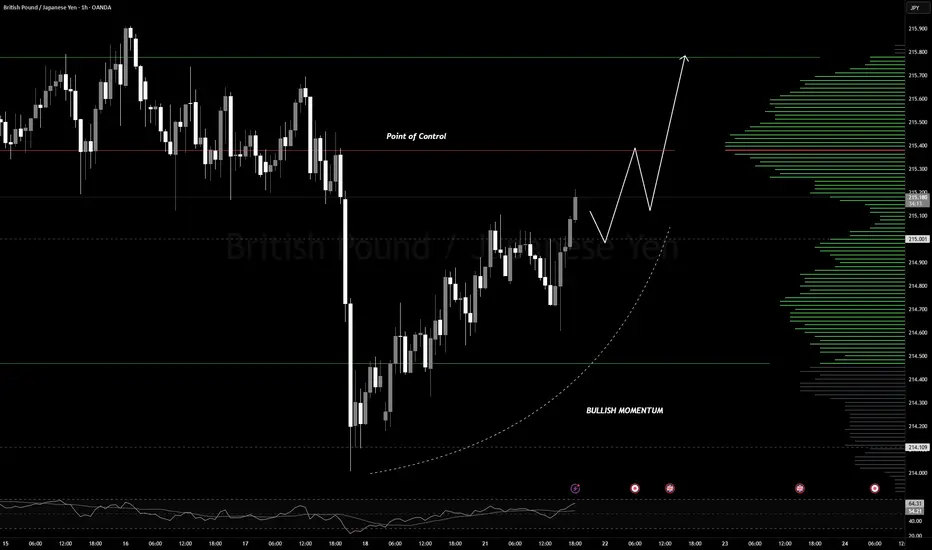
GBP/JPY Has Potential to Strengthen FurtherGBP/JPY consolidated in a narrow range below the psychological level of 215.00 during today's European session.
Market reaction to the UK employment report tended to be muted, while speculation about Japanese monetary policy and Middle Eastern geopolitical risks continued to create a tug-of-war for the pair.
-----------------------------------------------------------------------------------------------
✅ UK Employment Report: Mixed Signals for the Pound
Data from the Office for National Statistics (ONS) this morning paints a mixed picture for the UK economy:
- ⚡Unemployment Falls: The ILO unemployment rate surprisingly fell to 4.9%, significantly better than the previous period (5.2%). This demonstrates the resilience of the UK labor market.
- ⚡Wage Growth Slows: Average Earnings (including bonuses) slowed to 3.8%, the lowest level in five years. Despite the slowdown, this figure is still slightly above market expectations (3.6%).
- ⚡BoE Impact: This data does little to change market expectations that the Bank of England (BoE) will still conduct at least one interest rate hike (25 bps) in 2026 to offset energy inflation, which provides underlying support for the GBP.
-----------------------------------------------------------------------------------------------
✅ BoJ & Yen Policy: Waiting Until June
Sentiment towards the Japanese Yen (JPY) remains weighed down by policy and external factors:
- ⚡BoJ Holds Interest Rates: Reuters reports that the Bank of Japan (BoJ) is likely to keep interest rates unchanged at its April meeting due to uncertainty surrounding the Strait of Hormuz blockade.
- ⚡Intervention Risk: Fear of market intervention by Japanese authorities remains a major barrier to further yen weakness, making traders hesitant to push GBP/JPY much beyond its current highs.
-----------------------------------------------------------------------------------------------
✅ GBP/JPY Technical Analysis (Intraday)
Technically, the pair is in a healthy consolidation phase after a long rally:
- ⚡Psychological Resistance (215.00): This level is the main focus. A breakout and close above this level is needed to open the way to the multi-decade high at 216.00.
- ⚡Critical Support (214.15 – 214.20): The area of yesterday's rebound that now serves as the immediate resistance for buyers.
- ⚡Market Structure: The uptrend since early April remains intact, but momentum is starting to ease as overbought signals appear on several long-term indicators.
CADJPY – Short Setup (1H Timeframe)Entry: 116.502
Stop Loss: 26 pips
Take Profit: 52 pips
Risk to Reward: 1:2.0
📉 Trade Idea – Short Bias
CADJPY has tapped into a premium zone after an extended bullish leg. Price reacted sharply from the supply block with signs of exhaustion, creating wicks and rejection candles around 116.50–116.60, indicating potential distribution.
We are looking to short as price re-enters the zone and shows rejection.
🔍 Technical Confluence
Price is trading deep inside a higher-timeframe supply zone.
Multiple SMC rejection points (CHoCH + BOS) signaling loss of bullish momentum.
A clean liquidity sweep above recent highs, followed by a bearish shift.
Market currently sitting above an inefficient gap, which price may want to rebalance downward.
RR of 1:2 supports strong risk-adjusted trade.
📌 Trade Plan
Sell: 116.502
SL: 116.762 (26 pips above entry, above rejection structure)
TP: 115.982 (52 pips, targeting FVG + demand imbalance below)
📝 Outlook
If CADJPY continues respecting the supply and fails to break above the recent liquidity sweep, we may see a corrective move into the demand zone around 115.95–116.00. This aligns perfectly with our 52-pip target.
Weak CAD + risk-off sentiment in Yen pairs also adds to bearish probability.
#EURUSD correction start💶💵 EURUSD: Impulse Done, Correction Ahead 📉📈
From 30 March to 17 April, EURUSD completed a clear 5‑wave impulsive cycle.
Now, the pair has entered its corrective phase:
🔹 Wave 3: The longest wave of the cycle.
👉 By Elliott Wave rules, price often retraces into the territory of Wave 4.
⚡ This sets the stage for a classic ABC correction.
💡 Takeaway for traders:
Corrections after a strong impulse often unfold in ABC form.
📊 Stay alert — EURUSD could be gearing up for a deeper retracement before the next big move.
GBPUSD – Key Levels Marked, Reaction Zones in PlayAll the marked price levels on the chart are highly significant reaction zones. These are areas where price has historically shown intent and where we can expect potential shifts in direction.
Price doesn’t move randomly — it responds to liquidity and imbalances, and these levels represent zones where:
Orders are likely resting
Liquidity can be engineered or swept
Reversals or strong reactions can originate
👉 In simple terms: any of these levels can act as a turning point, and price can start moving in the opposite direction from them.
Current Outlook:
As highlighted in the chart, we are currently anticipating a bearish move from the marked resistance zone.
The expectation is:
A possible push into resistance / inducement
Followed by sell-side expansion
Targeting lower liquidity and imbalance zones
Important Reminder:
Even though the current bias is bearish,
do not ignore the importance of each marked level.
Market can:
Respect the level and reverse ✔️
Or break and continue if acceptance is strong ❌
Execution should always be based on confirmation, not assumption.
AUDUSD_D📊 Technical Analysis (AUDUSD – Daily Timeframe)
AUDUSD is showing signs of a potential bearish reversal on the daily timeframe.
From an Elliott Wave perspective, the larger wave 5 appears to have completed, suggesting the end of the impulsive structure and the beginning of a corrective phase. This increases the probability of a downside move.
At the same time, a regular bearish divergence is visible, indicating weakening bullish momentum. Price has also reached a key resistance zone, further supporting the bearish outlook.
🔻 Bearish Targets:
We expect a decline toward the following levels:
0.68661
0.67728
0.66535
❌ Invalidation Level:
If price breaks above 0.72275, this analysis will be invalidated.
🌍 Fundamental Analysis (Supporting Bias)
From a fundamental standpoint, several factors support a bearish outlook for AUDUSD:
The Federal Reserve continues to maintain relatively tight monetary policy, supporting the strength of the US Dollar.
Meanwhile, the Reserve Bank of Australia has taken a more cautious approach toward further rate hikes, which can limit upside potential for the Australian Dollar.
The Australian Dollar is highly sensitive to commodity prices and China’s economic performance. Any slowdown in China can negatively impact AUD due to reduced demand for exports.
Broader risk-off sentiment in global markets tends to favor the USD over risk-sensitive currencies like AUD.
📉 Conclusion:
Both technical structure (completed wave 5 + bearish divergence at resistance) and fundamental factors align, supporting a corrective bearish move toward the specified targets.
EURUSD_D📊 Technical Analysis (EURUSD – Daily Timeframe)
EURUSD is currently showing signs of a potential bearish continuation on the daily timeframe.
Based on Elliott Wave theory, wave B appears to have completed, and the market is now likely entering wave C, which typically unfolds with strong downward momentum. The structure resembles a zigzag correction (A-B-C).
Additionally, a hidden bearish divergence is visible, reinforcing the downside bias. Price has also reached a key resistance zone, increasing the probability of a reversal.
🔻 Bearish Scenario:
We expect a decline toward the 1.11923 – 1.11492 support zone.
❌ Invalidation Level:
If price breaks above 1.20692, this analysis will be invalidated.
🌍 Fundamental Analysis (Supporting Bias)
From a fundamental perspective, the bearish outlook for EURUSD is supported by several macroeconomic factors:
The Federal Reserve maintains a relatively hawkish stance, keeping interest rates elevated to combat inflation. This continues to support the US Dollar.
In contrast, the European Central Bank faces slower economic growth across the Eurozone, limiting its ability to remain aggressive with rate hikes.
Ongoing concerns about economic stagnation in Europe, especially in major economies like Germany, further weigh on the Euro.
Market sentiment currently favors the USD as a safe-haven asset, particularly amid global uncertainty.
📉 Conclusion:
Both technical and fundamental factors align in favor of a bearish move, supporting the expectation of wave C unfolding downward toward the specified support zone.
If you want, I can also format this into a shorter “TradingView caption style” or add entry/SL/TP levels.
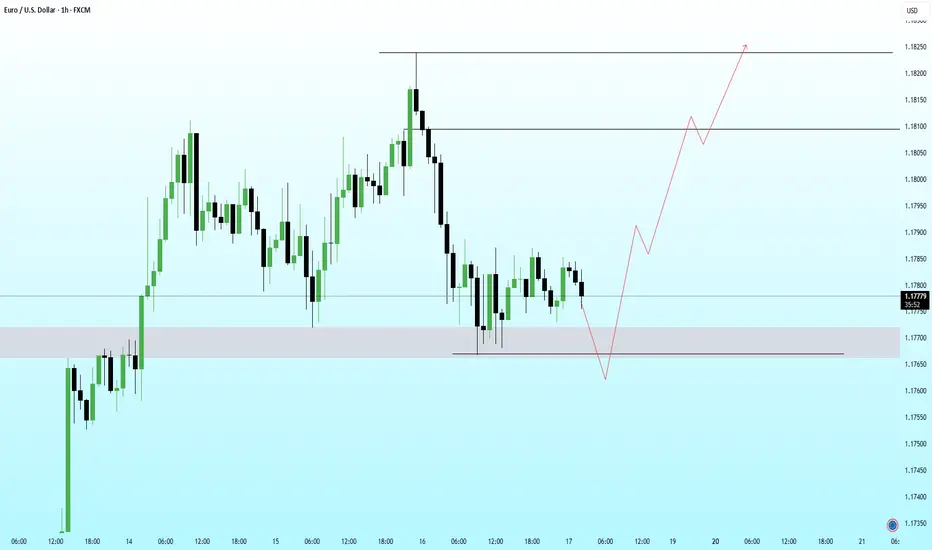
EURUSD H1 TRADE PLANPrice delivered a sell-side liquidity sweep below the Asian/session lows into a 1H demand / bullish OB. The move down looks like a displacement leg completing, not initiating.
Now I’m looking for a classic MM reversal sequence.
Narrative:
SSL taken → price trades into discount (dealing range) → taps bullish OB / imbalance → prints rejection.
Execution plan (ICT model):
Waiting for LTF BOS (shift in market structure) after the sweep
Entry on FVG retracement within that displacement leg
Prefer entry inside discount of the intraday dealing range
Targets:
First: internal range liquidity (recent equal highs / short-term highs)
Next: external liquidity above 1H highs
Final: premium zone of the dealing range
Invalidation:
Clean acceptance below the OB = bearish continuation → no trade
Bias:
Short-term bullish, this looks like a Judas swing before expansion higher.
If this holds, we’re not buying randomly… we’re aligning with the algorithm after it cleared liquidity.
#ICT #SMC #Liquidity #OrderBlock #FVG #Forex #EURUSD #PriceAction
EURUSD Sell SetupBias: Bearish (Supply Zone Rejection)
Entry: 1.18051
Stop Loss: 25 pips above entry
Take Profit: 66.5 pips below entry
RR: ~1:2.6
Setup Logic:
Price is reacting from a higher timeframe supply zone, showing signs of rejection after a strong impulsive move up. The structure indicates potential distribution / liquidity grab above equal highs, followed by weakness.
We are expecting a move back toward discount levels / imbalance fill, aligning with mean reversion from premium pricing.
Confluences:
Supply zone rejection
Weak bullish continuation (choppy consolidation)
Liquidity taken above highs
Potential CHoCH already formed
Imbalance below acting as magnet
Plan:
Wait for confirmation (lower timeframe weakness if needed), then execute sell with defined risk. Let the RR play out — no early exits unless structure invalidates.
Descending Triangle Chart Pattern📘 Overview
This chart highlights a Descending Triangle pattern forming at a strong support zone.
The structure reflects ongoing selling pressure through lower highs, while buyers continue to defend the same support level.
⸻⸻⸻⸻⸻⸻⸻⸻⸻
📉 Key Price Action
• Price is forming consistent lower highs, indicating bearish pressure
• Support zone is tested multiple times, showing strong demand
• Price is compressing between resistance and support
• Volatility is decreasing, suggesting a potential breakout soon
⸻⸻⸻⸻⸻⸻⸻⸻⸻
📊 Chart Explanation
🔻 Descending Structure
Lower highs indicate that sellers are gradually gaining control, pushing price down with each rally.
🟩 Strong Support Zone
Multiple touches at the same level highlight strong buying interest and demand.
⚡ Compression Phase
Price is getting squeezed between descending resistance and horizontal support, forming a classic triangle setup.
⸻⸻⸻⸻⸻⸻⸻⸻⸻
📌 Summary
This setup represents a decision zone, where price is compressing at key support.
Such structures often lead to a strong move once price breaks out of the range.
⸻⸻⸻⸻⸻⸻⸻⸻⸻
🔮 Future Outlook
If support holds, a bounce is likely.
However, a breakdown below the support zone may lead to continued bearish momentum.
⸻⸻⸻⸻⸻⸻⸻⸻⸻
⚠️ Disclaimer
📘 For educational purposes only.
🙅 Not SEBI registered.
❌ Not a buy/sell recommendation.
🧠 Purely a learning resource.
📊 Not Financial Advice.
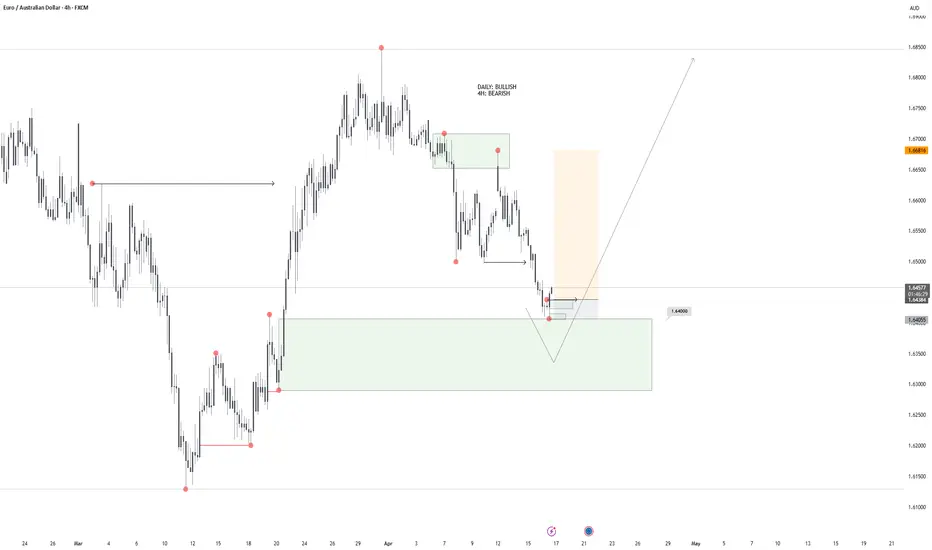
EURAUDI am currently looking for buy opportunities on EA, as the higher time frame trend remains bullish.
However, this setup is counter-trend, since the 4H market structure is still bearish.
On the 15-minute time frame, a bullish flip has already occurred, so now the plan is to stay patient and wait for further confirmation, likely into tomorrow’s session.
This zone is a refined demand zone, which previously caused the entire move to the upside, making it a key area of interest.
For risk management:
A conservative stop-loss would be placed below the demand zone, but the risk-to-reward is not ideal.
Therefore, I will be looking for a more aggressive stop-loss placement to improve RR.