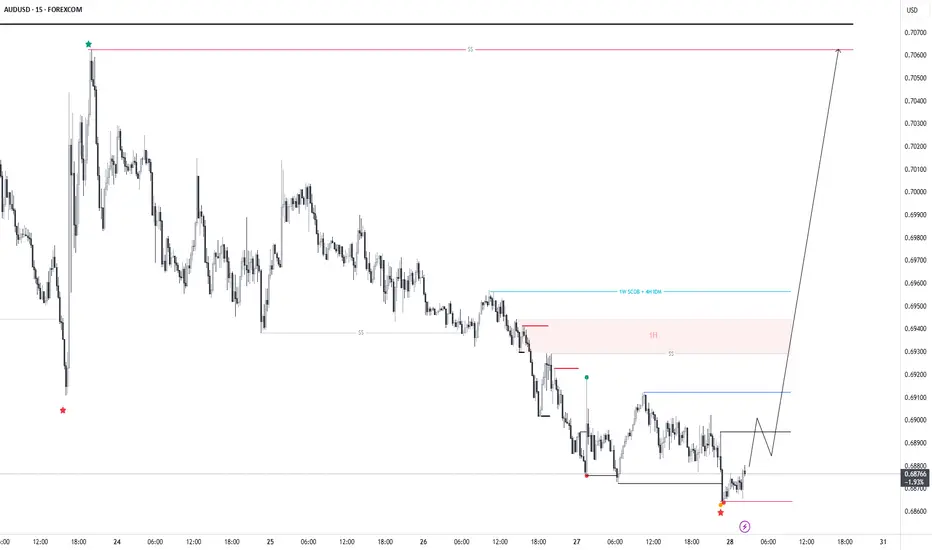
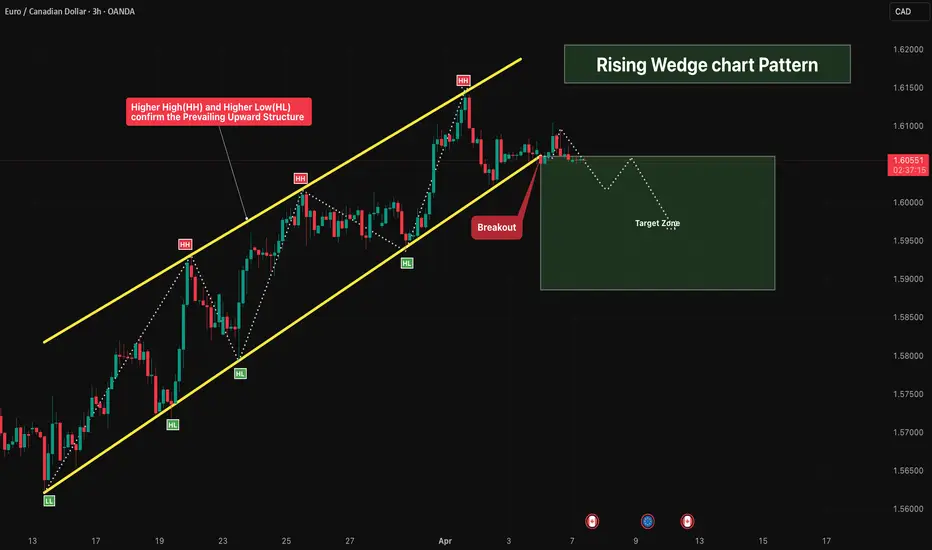
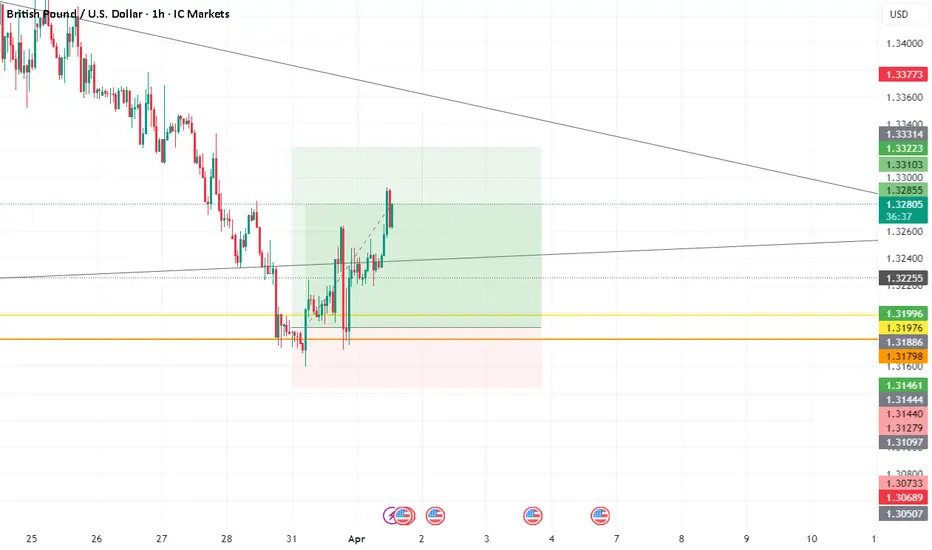
EUR/USD is in Positive MomentumThe EUR/USD pair moved within a narrow range with a mild negative bias below the 1.1700 level during today's Asian session.
Although the weekly trend remains positive, traders appear reluctant to take large positions before the release of crucial US CPI (Inflation) data tonight.
------------------------------------------------------------------------------------------
✅ Fundamental Tug-of-War: Oil vs. Diplomacy
Current market sentiment is influenced by two opposing forces:
- ⚡Pressure Factors (EUR Bearish): Iran's re-closure of the Strait of Hormuz has boosted oil prices. This has fueled concerns about global inflation, forcing the Fed to remain hawkish, strengthening the US Dollar (USD) as a safe-haven asset.
- ⚡Supporting Factors (EUR Bullish): Hopes for a stable ceasefire through Washington negotiations next week between Lebanon, Israel, and Iran, and the US, are holding back excessive dollar appreciation. Investors are focused on US CPI data to see if the surge in energy prices has impacted consumer purchasing power.
✅ Technical Indicators: Constructive Bias Remains
Technically, EUR/USD has just passed a critical phase that has now transformed into a support zone:
- ⚡Confluence Zone (1.1665 – 1.1672): The price has successfully broken above the 200-day SMA and the 38.2% Fibonacci retracement. This overnight breakout is a significant bullish signal. As long as the price remains above this zone, the medium-term bullish bias remains valid.
- ⚡RSI (58): Shows healthy upward momentum and still has ample room to go before reaching the overbought area.
-------------------------------------------------------------------------------------------
🎯 Key Levels to Watch 🎯
- ⚡Resistance 1 (1.1742): The 50.0% Fibonacci Retracement Level. The nearest target for buyers if the US CPI data comes in lower than expected.
- ⚡Key Resistance (1.1820): The 61.8% Fibonacci retracement level. A break above this level would open the door to 1.1931 and 1.2072.
- ⚡Critical Support (1.1665 – 1.1672): 200-day SMA. This is the most important resistance level; if it breaks, this week's uptrend will be shattered. USD/JPY Still in Wait & See ModeUSD/JPY traded within a limited range during today's Asian session, failing to break through the 159.00 level but remaining above the critical 158.00 level.
-------------------------------------------------------------------------------------------
✅ Key Catalysts: Lebanon Tensions & the Strait of Hormuz
Today's market sentiment was dominated by the fragility of the peace deal:
- ⚡Ceasefire Threatened: Although the US and Iran agreed to a two-week ceasefire, Israeli airstrikes in Lebanon (which the White House confirmed were not included in the deal) angered Tehran.
- ⚡Hormuz Blockade Resumes: In response to the attack in Lebanon, Iran has again closed the Strait of Hormuz. This has fueled uncertainty in global energy supplies and supported the US Dollar (USD) as the primary liquidity choice over the Yen (JPY).
- ⚡Threat of Intervention: Japanese authorities, through Vice Finance Minister Atsushi Mimura, recently warned of "firm action" if the JPY continues to weaken speculatively above the 160.00 level. This has limited the courage of USD/JPY buyers to push prices higher.
----------------------------------------------------------------------------------------
✅ Technical Indicators: Fragile Constructive Bias
Technically, USD/JPY is in a "wait and see" position with a slightly upward-leaning structure:
- ⚡Support (~158.22): This level serves as a crucial technical floor. As long as the price holds above the 158.25-158.20 zone, the short-term upward bias remains valid.
- ⚡RSI (42): Located in neutral territory, indicating that the price has room to rise further without the risk of imminent overbought.
----------------------------------------------------------------------------------------
✅ Today's Main Focus: US PCE Data
Tonight is a defining moment for the US Dollar's direction:
- ⚡PCE Price Index (7:30 PM WIB): As the Fed's favorite inflation data, a higher-than-expected figure would reinforce the "Higher for Longer" narrative, which could push USD/JPY beyond 159.00.
- ⚡Fed sentiment: If PCE shows cooling inflation, USD/JPY is at risk of breaking the 200 EMA to the downside. NZD/USD Strengthens Despite Facing Strong BarriersThe NZD/USD pair managed to halt their two-day downtrend after bouncing off the 0.5680 area (a four-month low). Currently, the price is trading above the psychological level of 0.5700, up around 0.25%, boosted by glimmers of diplomatic hope in the Middle East.
------------------------------------------------------------------------------------
✅ Positive Catalyst: Rumors of a 45-Day Ceasefire
Global risk sentiment received a boost from media reports:
- ⚡Axios report: The US, Iran, and regional mediators are reportedly discussing the terms of a 45-day ceasefire. This news has eased tensions somewhat and triggered profit-taking in the US dollar (USD), which has provided support for commodity currencies like the Kiwi (NZD).
- ⚡Short-Term Pause: Despite rumors of a peace deal, the market remains skeptical given the fragile track record of previous negotiations.
----------------------------------------------------------------------------------
✅ Constraining Factors: Tuesday's Ultimatum & Energy Inflation
NZD/USD's upside potential remains limited as major threats still loom:
- ⚡Trump Deadline: President Donald Trump remains steadfast in his threat to destroy Iran's civilian infrastructure (bridges & power plants) if the Strait of Hormuz is not reopened by Tuesday (tomorrow).
- ⚡Iran's Conditions: Tehran is demanding revenue allocations as compensation for war damages to open the waterway, a condition the US is likely to reject.
- ⚡Fed Hawkishness: Surging energy prices are fueling inflation concerns. Traders are now pricing in a greater chance of the Fed raising interest rates in 2026, which fundamentally supports long-term USD strength.
--------------------------------------------------------------------------------
✅ NZD/USD Technical Analysis (Intraday)
Technically, NZD/USD is attempting to form a short-term base.
- ⚡Critical Support (0.5680): A four-month low that has been successfully held. A break below this level would pave the way for a deeper decline to the 0.5600 area.
- ⚡Nearest Resistance (0.5740 - 0.5750): An area that must be broken to confirm that the recovery has continued strength.
- ⚡Market Conditions: The Easter Monday holiday in many countries has resulted in thin liquidity, meaning price movements could be choppy ahead of the New York session.
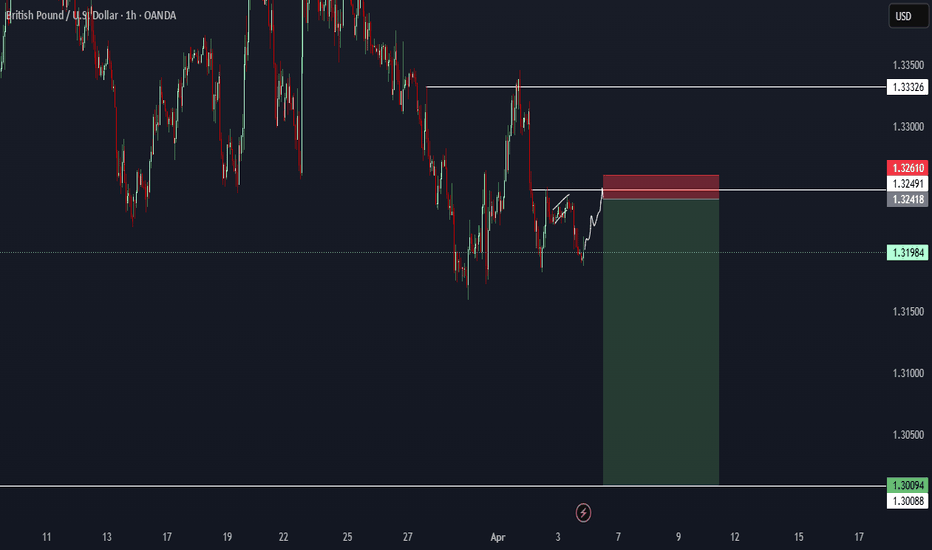
USDINR: RBI's $149 Billion MasterstrokeRBI's $149 Billion Masterstroke! (April 2026)
The Reserve Bank of India (RBI) has taken one of its toughest actions in over a decade to defend the Indian rupee against heavy speculative pressure.
What Did RBI Do?
On April 1-2, 2026, the RBI announced strict new measures targeting the offshore rupee market:
Ban on NDF Contracts: Indian banks (Authorised Dealers) are now prohibited from offering Non-Deliverable Forward (NDF) contracts involving the rupee to both resident and non-resident clients. This is effective immediately.
Ban on Rebooking: Banks cannot rebook any cancelled foreign exchange derivative contracts (deliverable or non-deliverable).
Position Limit: Banks’ net open rupee position in the onshore market is capped at $100 million per day.
These steps directly hit the massive $149 billion-a-day offshore NDF market (mainly in Singapore, London, New York, and Hong Kong), which is roughly twice the size of India’s onshore rupee trading volume.
Why This “Masterstroke”?
The rupee had been weakening sharply due to global tensions (especially the US-Israel-Iran conflict), hitting repeated record lows.
Foreign speculators and some corporates were heavily using the offshore NDF market to place short bets against the rupee (betting it would fall further).
Banks were running large arbitrage trades (buying dollars onshore and selling offshore), which added more pressure on the rupee.
Earlier RBI interventions (selling dollars) were partly offset by these loopholes, so the central bank decided to close the channels directly.
This move forced banks to unwind an estimated $30 billion+ in arbitrage positions quickly.
Immediate Impact
The rupee surged sharply — recording its biggest single-day gain in over 12 years (around 1.4% to 1.8% in a day).
It moved from near 95+ levels back toward the 93–94 range in a single session.
Volatility spiked, and the clearing house imposed higher margins on forward contracts.
Bank stocks fell to near one-year lows due to concerns over potential losses from unwinding positions.
Why Is It Called a “Masterstroke”?
Positive Side:
It effectively curbs speculative short-selling of the rupee.
Reduces pressure on RBI’s foreign exchange reserves.
Sends a strong signal that the RBI will not allow unchecked speculation.
Helps restore some stability to the currency in the short term.
Potential Downsides:
May reduce liquidity in the offshore rupee market.
Increases hedging costs for corporates and foreign investors.
Banks and some companies may face short-term losses while unwinding positions.
Could create temporary disruptions in normal forex flows.
Bottom Line
This is being widely described as RBI’s “Forex War” or “$149 Billion Crackdown” because it directly attacks the huge offshore market that was being used to bet against the Indian rupee.
Analysts say it is one of the most aggressive administrative controls on currency trading in recent memory. Whether the rupee’s recovery sustains will depend on global oil prices, geopolitical developments, and how quickly the unwind of positions is completed (deadline for some limits is April 10, 2026).
Would you like more details on:
Current rupee exchange rate?
Impact on banks or stock market?
What this means for importers/exporters?
Possible future RBI steps?
⚠️ DISCLAIMER:
The information, views, and ideas shared here are purely for educational and informational purposes only. They are not intended as investment advice or a recommendation to buy, sell, or hold any financial instruments. I am not a SEBI-registered financial adviser.
Trading and investing in the stock market involves risk, and you should do your own research and analysis. You are solely responsible for any decisions made based on this research.
"🔔As HARD EARNED MONEY IS YOUR's, So DECISION SHOULD HAVE TO BE YOUR's".

 Long
Long