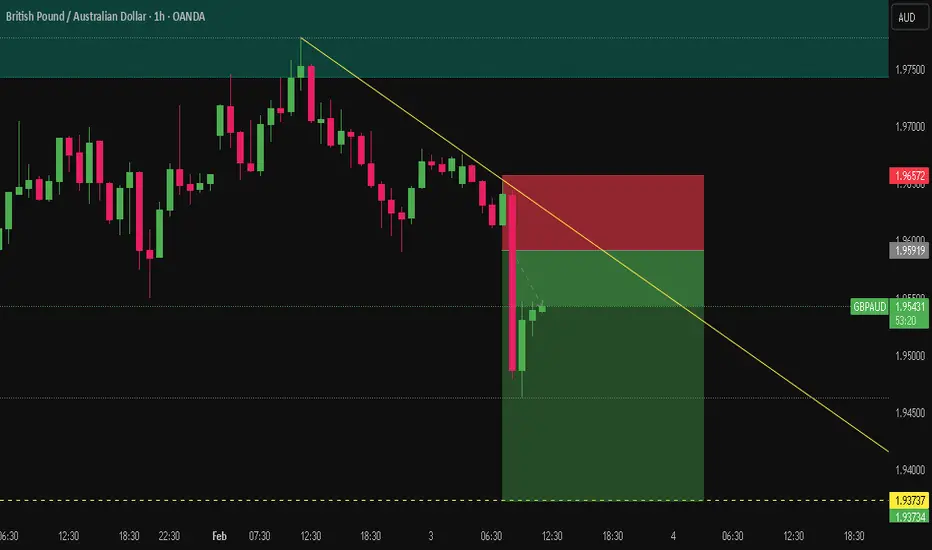
Forex market
DAILY FOREX SCAN Session – 23 03 02 26Scanning multiple forex pairs to filter high-quality trade setups. No trades are forced—only structure-based opportunities.
Note: There may be a delay in this video due to upload processing time.
Disclaimer: FX trading involves high leverage and substantial risk, and losses can exceed your initial investment. This content is for educational purposes only and should not be considered financial advice. Trade at your own risk.
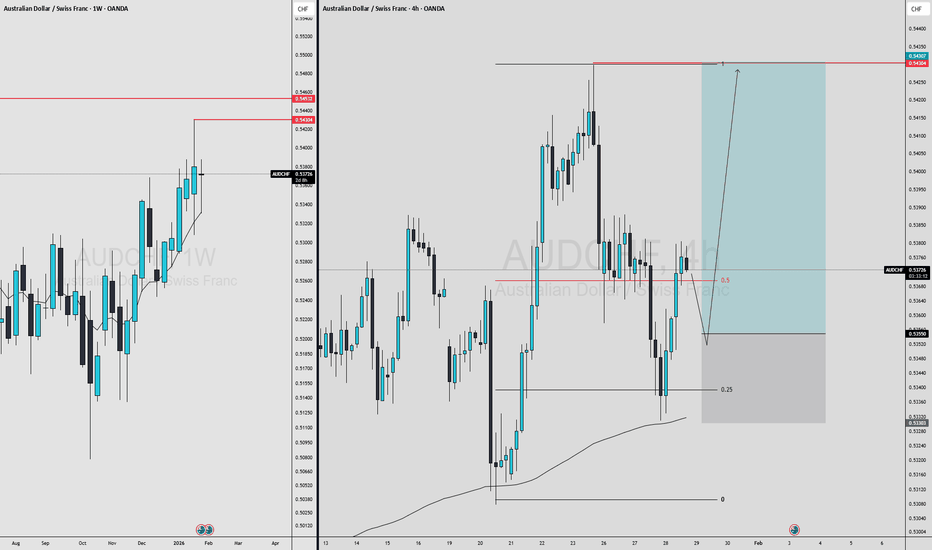
Expecting EurCHF bearish Why should we trust this idea 💡??Eur has 2.15% interest rate ,while chf is safe heaven currency so
it would shows always significant strength towards chf ,apart from that any Ongoing panic
global events will also cause CHF bullish with aligning the price action parameters by following liquidity 💲⚔️
Disclaimer: This is not any financial advice! Simulated idea 😉
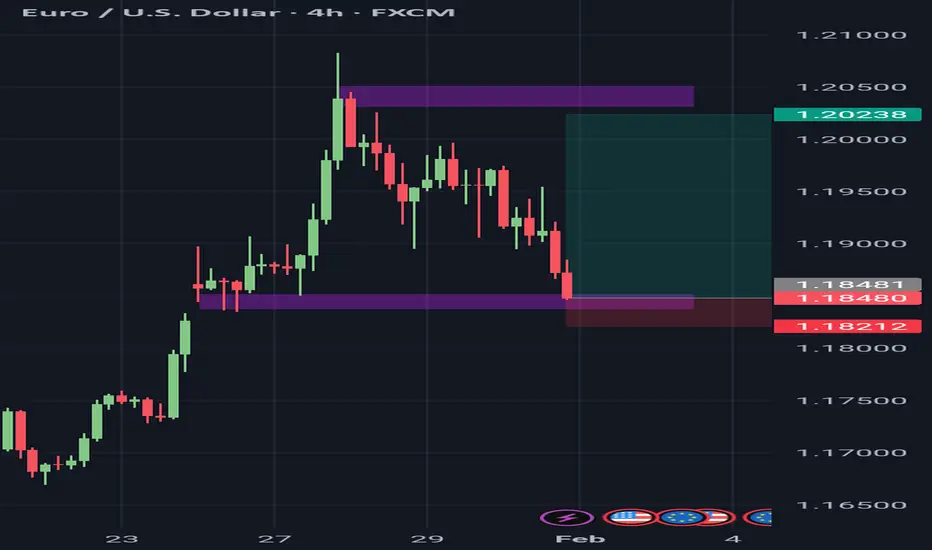
EUR/USDEURUSD experienced a clean intraday sell-side liquidity sweep, breaking below the prior range low with strong bearish displacement, signaling a stop-driven move rather than organic trend continuation.
Price tagged the lower liquidity pool, printed a sharp rejection wick, and immediately delivered a V-shaped reaction, indicating short-term exhaustion and responsive buying at discount.
Market Structure Read
Range low taken with momentum expansion
Stops flushed, creating temporary price inefficiency
Immediate bullish reaction suggests sell pressure is weakening, not building
Current Zone Logic
Price is reacting from a deep discount zone, where short-term participants are covering and early longs are stepping in
The marked green box represents a mean-reversion / mitigation zone, not a trend-reversal confirmation yet
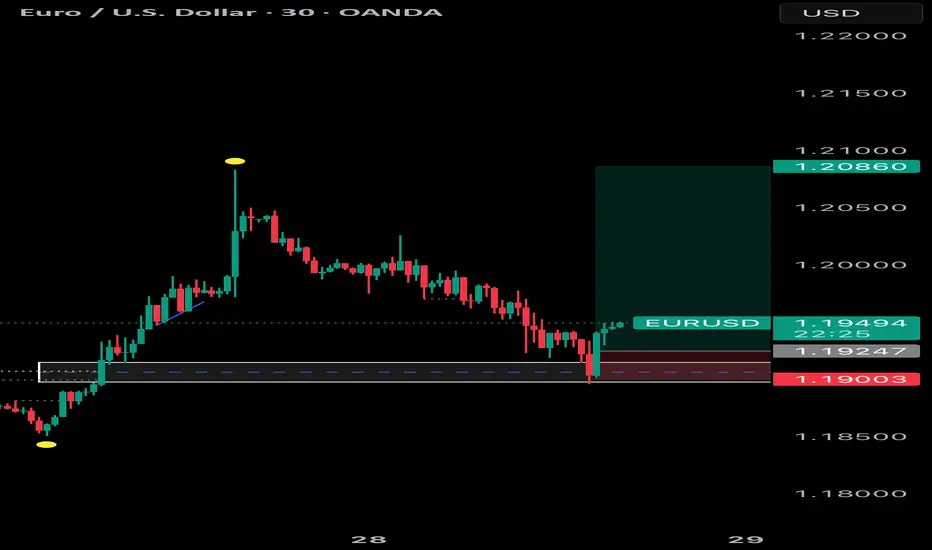
EUR/USD – 1H EURUSD is trading at a discounted price area after a sharp impulsive sell-off, where price has swept sell-side liquidity (LA) and is now stabilizing near equal lows. The recent bearish leg looks exhaustive, suggesting downside momentum is weakening.
Price is currently holding above a key intraday demand / liquidity pocket, forming a base that favors a mean-reversion move rather than continuation lower.
Key Structure & Narrative
Sell-side liquidity taken below prior lows (LA)
Bearish impulse completed, followed by compression and basing
Discount zone respected, aligning with smart-money accumulation logic
Upside Scenario (Primary Bias)
A bullish displacement from current levels can open a path toward the prior H1 supply / imbalance zone (blue)
Acceptance above this zone may lead to a trend continuation toward the higher-timeframe premium area, with projected targets near the 1.2050–1.2080 region
Pullbacks during the move are expected to be corrective, not impulsive
Invalidation
Sustained acceptance below the liquidity sweep low would invalidate the bullish thesis and imply further downside exploration
📌 Bias: Bullish reversal from sell-side liquidity
📌 Framework: Liquidity sweep → accumulation → displacement → expansion
📌 Market State: Transition from markdown to re-accumulation
EUR/JPY Long: Riding the Momentum After Clean BOS The price action on EUR/JPY is currently displaying strong bullish momentum on the M15 timeframe. After a period of consolidation, the pair has successfully achieved a Break of Structure (BOS) to the upside, signaling a transition from a range-bound environment to an active uptrend.
Expecting audcad sell delivery for buy setupsBetween these two red lines inside weekly+daily imb, the set-up could be find for buys
Why? Price already taken the liquidity above and it possible scenario
shows the probability
of retracement ( where structure shift indicates sellside delivery,
however buys will be
more safer approach fundamentally
and technically both .
Fundamental reason : aud have strong
intrest rate i.e (3.6%)
whereas CAD indicates 2.25%
And Technically it's bullish orderflow .🤝
USDCHF 1W T/F ANALYSIS---
USDCHF 1w t/f analysis----
📊 Market Structure Explanation (usdchf – 1w):-
Centeral structure are a vibrancy (Explanation of Vibrancy structure > this structure are first volume contraction and bended both side also then empulsive move and break it`s self ) \
now this condition breakdown it`s self so we can measure structure of previous marked supply and past on breakdown of top candle so now we have a clear down side direction and we have a buyesh for sell side now we can go with sell side on lower t/f on every retesting :-
AUDJPY : Bulls Defending the Line 106.60 !AUDJPY has undergone a significant correction, sliding from the 109.00 peak down to the 106.20 region. However, the bears have hit a massive roadblock. We are currently seeing a strong reaction from a historical demand zone (105.80 – 106.00), marked by the clear rejections in the shaded circles on the chart.
🔍 The Critical Battleground: 106.00 – 106.60
The price is currently hovering around 106.57. This "buffer zone" between current levels and the demand floor is make-or-break for the next major move.
🚀 The Bullish Scenario (Hold & Bounce)
If buyers can maintain support above 106.60 and consolidate north of the demand zone, we have a clear path for a recovery.
Target: 🎯 108.15
Rationale: Sustained trading above 106.60 confirms that the historical demand is holding and the correction is over.
One more chance is price slides down till 106 and then bounce back above 106.50 which transforms into re-entry.
⚠️ The Bearish Scenario (Break & Flush)
If the bulls lose their grip and the price slides back through the floor, I’ll be switching my bias.
Trigger: A clean break below 105.85.
Target: 🎯 104.80
Rationale: Once 105.80 fails, the historical support flips to resistance, opening the trapdoor for a deeper sell-off.
💡 Summary: I am watching the 106.60 level closely. As long as we stay above it, the outlook remains cautiously optimistic for a move back toward 108+.
EURUSD 2H CHART EUR/USD Long Setup
Entry Zone: After price touches the bullish order block (OB) and shows rejection/reversal signals.
Direction: Long
Invalidation Level: Below the order block low.
Target: Next higher structure high (or previous swing high / liquidity zone above).
Rationale: Price is expected to respect the order block as support and continue upward within the prevailing structure.
Bitcoin and Major Cryptocurrency Trends1. Bitcoin (BTC) Trends
Price Volatility: Bitcoin remains highly volatile, with rapid short-term swings influenced by macroeconomic events, regulation, and institutional adoption.
Institutional Adoption: Increasing interest from hedge funds, banks, and corporate treasuries drives long-term bullish sentiment.
Store of Value Narrative: Often called “digital gold,” Bitcoin is increasingly seen as a hedge against inflation, especially in uncertain economic periods.
On-chain Activity: Metrics like active addresses, transaction volume, and miner activity influence price trends and market sentiment.
Regulatory Impact: Changes in government regulations, especially in the U.S., Europe, and Asia, significantly affect price movements.
Correlation with Traditional Markets: Bitcoin sometimes moves in correlation with tech stocks and risk-on assets, but also shows periods of decoupling.
2. Ethereum (ETH) Trends
Smart Contract Growth: Ethereum dominates DeFi, NFTs, and dApp development, driving demand for ETH.
Transition to Proof-of-Stake (PoS): Ethereum’s shift from PoW to PoS reduces energy consumption and may improve scalability, impacting price sentiment.
DeFi & Layer-2 Solutions: Ethereum layer-2 networks like Arbitrum and Optimism enhance transaction speed and lower fees, increasing network adoption.
EIP Upgrades: Ethereum Improvement Proposals (EIPs), especially those reducing supply (like EIP-1559), impact ETH scarcity and valuation.
3. Binance Coin (BNB) Trends
Exchange Utility: BNB remains strongly linked to Binance exchange growth, offering discounted trading fees and token burns.
Expansion in Binance Smart Chain (BSC): Growth of BSC ecosystem and DeFi projects boosts BNB demand.
4. Cardano (ADA) Trends
Focus on Scalability & Sustainability: Cardano emphasizes peer-reviewed research and energy-efficient PoS validation.
Smart Contract Ecosystem: Adoption of smart contracts and DeFi projects on Cardano gradually increases network utility.
5. Solana (SOL) Trends
High-Speed Transactions: Solana offers high throughput and low fees, making it attractive for NFTs and DeFi projects.
Network Stability Concerns: Occasional network outages affect confidence but do not entirely diminish adoption.
6. Ripple (XRP) Trends
Banking & Payment Use Case: XRP remains focused on cross-border payments and partnerships with financial institutions.
Regulatory Developments: Legal outcomes, especially in the U.S., heavily influence XRP price and adoption.
7. Stablecoins Trends
USD-Pegged Coins (USDT, USDC): Stablecoins facilitate crypto trading, DeFi lending, and hedging against volatility.
Regulatory Scrutiny: Central banks and governments are increasingly monitoring stablecoin issuance and reserves.
8. General Cryptocurrency Trends
DeFi Expansion: Decentralized finance continues to grow, creating new yield opportunities and borrowing/lending mechanisms.
NFT Market Evolution: NFTs are diversifying beyond art into gaming, music, and real-world asset representation.
Institutional & Retail Interest: Adoption grows across both retail and institutional investors, boosting market liquidity.
Regulatory Focus: Global authorities are increasingly framing cryptocurrency regulation, impacting taxation, exchanges, and investor protection.
Layer-2 & Scaling Solutions: Technologies like Lightning Network (Bitcoin) and Ethereum L2s reduce transaction costs and improve scalability.
AI and Blockchain Integration: Emerging trend where AI analytics and blockchain-based data management intersect, creating innovative investment and utility models.
CADJPY 2HR T/F ANALYSIS --- WE NEAD A RETESTING FOR SELL SIDE
📊 Market Structure Explanation (cadjpy – 2hr)
the structure are clear look like a strong bearish formation:- in this selling trend we can se imbalance also and our strong supply of previous demand which are marked clearly into green color they demand copy and past on recent demand bottom to top and now we have a retesting area :-
🔍 What the market can do next:-
Scenario 1 – Pullback / retesting (Needs Confirmation):
For any meaningful retesting to occur, the market must first show clear bearish candlestick confirmation.
This includes patterns such as:
Bearish engulfing candles
Strong rejection wicks (upper shadows)
Evening star formations
Consecutive bearish closes
Long upper-wick rejection candles showing selling pressure
Without these bearish structures, any downside move should be treated as a temporary pullback, not a retesting.
Scenario 2 – Continuation:
If buyers stay strong and bearish confirmation does not appear, price can break above this zone and continue higher with another impulsive bullish move.
Scenario 3 – Range formation:
Market may form a small sideways structure near this level before choosing a clear direction.
🧭 Summary:
The trend is bearish, but price is at a sensitive resistance zone.
Retesting is only valid if bearish candlestick patterns and selling pressure appear.
Otherwise, the structure favors continuation or short-term consolidation before the next move.
DAILY FOREX SCAN Session – 20 (28.01.26)Scanning multiple forex pairs to filter high-quality trade setups. No trades are forced—only structure-based opportunities.
Note: There may be a delay in this video due to upload processing time.
Disclaimer: FX trading involves high leverage and substantial risk, and losses can exceed your initial investment. This content is for educational purposes only and should not be considered financial advice. Trade at your own risk.