The Hidden Psychology of Support and ResistanceLook at almost any price chart and you will find them.
A level where price repeatedly stops falling.
Another area where rallies keep losing momentum.
Sometimes price breaks through these levels and continues moving. Other times, it breaks the level for a few moments and then quickly reverses.
Most traders know these areas as support and resistance.
But support and resistance are not really about lines on a chart.
They are about people.
Behind every important price level is a story of traders who bought, sold, took profits, got trapped, or are still waiting for another opportunity.
Once you understand the psychology behind these levels, charts can start to look very different.
Why Do Support and Resistance Exist?
Markets are driven by decisions.
Every trader has a reason for entering a position.
Some believe price will rise.
Others believe it will fall.
When enough traders make similar decisions around the same price, the market begins to react there.
This creates areas of support and resistance.
Support forms when buying interest becomes strong enough to slow or stop a decline.
Resistance forms when selling pressure becomes strong enough to slow or stop a rally.
The level itself has no power.
The people trading around it create the reaction.
The Psychology Behind Support
Imagine a stock falls from ₹500 to ₹400.
At ₹400, many traders believe the stock has become attractive.
Some begin buying.
Others who previously missed the move decide to enter.
Short sellers may start taking profits.
All of this creates additional demand.
Price begins to stabilize.
The market has found temporary support.
Now imagine price rallies to ₹450 before falling back to ₹400.
Traders who watched the previous bounce remember what happened.
They may think:
"If price reaches ₹400 again, I'll buy."
This creates the possibility of even more demand.
The more traders who remember the same level, the more important that area can become.
The Psychology Behind Resistance
Resistance works in the opposite way.
Imagine a stock previously rallied to ₹500 but then experienced a sharp decline.
Many traders who bought near ₹500 may still be holding losing positions.
When price eventually returns to ₹500, some of these traders may decide to exit at breakeven.
Other traders may see the previous rejection and begin selling.
Short sellers may also enter.
Suddenly, selling pressure increases.
Price struggles to move higher.
The previous high has become a psychological barrier.
Why Previous Highs and Lows Matter
Traders remember prices.
A previous high represents a place where buyers failed to push the market higher.
A previous low represents an area where sellers were unable to continue pushing price lower.
When price returns to these areas, traders remember what happened before.
This memory influences future decisions.
That is why previous highs and lows often become important reference points.
The market doesn't have a memory in the human sense.
But the participants do.
Support and Resistance Are Zones, Not Exact Lines
One of the biggest mistakes beginners make is treating support and resistance as perfectly precise lines.
Real markets rarely behave that way.
A support level at ₹100 doesn't mean price must reverse exactly at ₹100.00.
Price may briefly move to ₹99.50 or ₹98.80 before buyers step in.
The same applies to resistance.
This is why it is often better to think in terms of **zones** rather than exact prices.
The goal is not to predict the exact turning point.
The goal is to identify an area where the balance between buyers and sellers may change.
When Support Becomes Resistance
One of the most interesting psychological shifts occurs when support breaks.
Imagine hundreds of traders bought around ₹100.
Then price suddenly falls below ₹100.
Those traders are now holding losing positions.
If price later returns to ₹100, some may want to exit their trades and reduce their losses.
At the same time, new sellers may view ₹100 as an opportunity to enter short positions.
The result?
A level that previously attracted buyers may now attract sellers.
Old support can become new resistance.
This isn't magic.
It's a change in trader psychology.
Why Breakouts Can Be So Powerful
A breakout represents a shift in expectations.
When price breaks a major resistance level, traders who were waiting on the sidelines may finally enter.
Short sellers may be forced to close their positions.
Momentum traders may join the move.
The combination of new buying and short covering can create a powerful rally.
The opposite can happen when support breaks.
Long positions may be stopped out.
New short sellers may enter.
Selling pressure increases.
This is why important support and resistance levels can produce strong moves when they finally break.
The Psychology of Trapped Traders
Some of the strongest market moves happen when traders become trapped.
Imagine price breaks above resistance.
Traders buy the breakout expecting a rally.
But instead of continuing higher, price falls back below the level.
Suddenly, those breakout buyers are trapped in losing positions.
If price continues falling, they may rush to exit.
Their selling adds further downward pressure.
This can create a sharp reversal.
The same process works in reverse after a false breakdown.
Understanding trapped traders can help explain why markets sometimes move so quickly after failed breakouts.
Strong Levels Are Often Tested Multiple Times
A support or resistance zone that has been respected several times can become psychologically important.
But there is an interesting paradox.
The more often a level is tested, the more attention it receives.
More traders begin watching it.
More orders accumulate around it.
Eventually, the level may become vulnerable to a breakout.
This is why traders should never assume that a level will hold simply because it has worked several times before.
Markets constantly change.
The Hidden Story Behind Every Level
The most useful way to think about support and resistance is to ask:
Who is trapped here?
Who is waiting to enter?
Who is taking profits?
Where are stop losses likely to be placed?
These questions reveal the psychology behind the chart.
A support level isn't just a line where price bounced in the past.
It is an area where traders have memories, expectations, and positions.
And those decisions can influence what happens when price returns.
Final Thoughts
Support and resistance are among the oldest concepts in technical analysis.
Yet their real power comes from something much deeper than chart patterns.
They work because traders remember.
They work because traders react.
They work because fear, greed, hope, and regret influence decisions around important prices.
A level becomes significant when enough market participants believe it is significant.
That belief creates orders.
Those orders create reactions.
And those reactions create the patterns we see on our charts.
So the next time you draw a support or resistance line, don't just ask:
"Will price bounce here?"
Ask a better question:
"What are traders likely to think and do when price reaches this area?"
Because behind every support and resistance level, there is a psychological battle.
And understanding that battle may be far more valuable than the line itself.
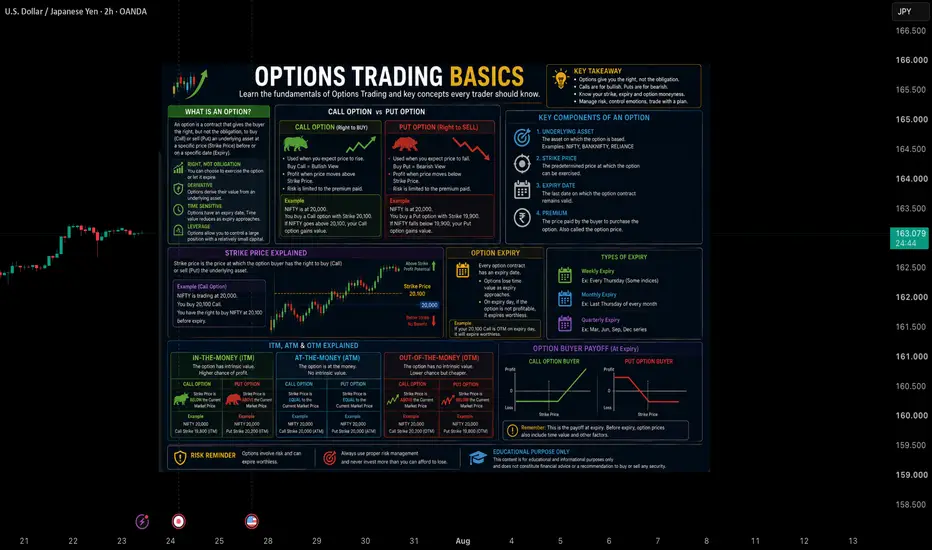
Options Trading Basics📌 Overview
Options Trading is a type of derivative trading where the value of an option contract is based on an underlying asset such as an index, stock, or commodity. This educational infographic explains the fundamental concepts of options trading, including Call Options, Put Options, Strike Price, Option Premium, Expiry, and the classifications of In-the-Money (ITM), At-the-Money (ATM), and Out-of-the-Money (OTM).
___________________________________________________________
📘 Definition
An Option is a financial contract that gives the buyer the right, but not the obligation, to buy or sell an underlying asset at a predetermined price before or on a specified expiry date.
Call Option – Gives the buyer the right to buy the underlying asset at the strike price before or on expiry. It is generally associated with bullish market outlook.
Put Option – Gives the buyer the right to sell the underlying asset at the strike price before or on expiry. It is generally associated with bearish market outlook.
Strike Price – The predetermined price at which the option buyer has the right to buy or sell the underlying asset.
Option Premium – The price paid by the buyer to purchase an option contract.
Option Expiry – The final date on which an option contract remains valid. Once expired, the contract can no longer be exercised.
Underlying Asset – The financial instrument on which the option contract is based.
In-the-Money (ITM) – An option that currently has intrinsic value because of the relationship between the strike price and the current market price.
At-the-Money (ATM) – An option where the strike price is approximately equal to the current market price.
Out-of-the-Money (OTM) – An option that currently has no intrinsic value, although it may still contain time value before expiry.
___________________________________________________________
📌 Key Points
• Options derive their value from an underlying asset.
• Call and Put Options provide different contractual rights.
• Strike Price, Premium, and Expiry are fundamental parts of every option contract.
• ITM, ATM, and OTM describe an option's relationship to the current market price.
• Option values may change due to market movement and the time remaining until expiry.
• Understanding these concepts builds a strong foundation before learning advanced option strategies.
___________________________________________________________
📊 Chart Explanation
• The infographic explains the fundamental building blocks of options trading.
• It compares Call Options and Put Options using simplified educational examples.
• The Strike Price section illustrates the predetermined exercise price of an option contract.
• The Expiry section explains that every option contract has a limited lifespan.
• The ITM, ATM, and OTM section demonstrates how option contracts are classified relative to the current market price.
• The payoff illustrations are simplified educational examples designed to explain option concepts and should not be interpreted as trading signals or future market predictions.
___________________________________________________________
📉 Summary
Options Trading combines several important concepts, including contract rights, strike prices, premiums, expiry dates, and option classifications. Learning these fundamentals can help build a better understanding of how option contracts work before exploring more advanced topics such as option strategies, option Greeks, and risk management.
___________________________________________________________
💡 Why It Matters
• Builds a strong foundation in options trading.
• Introduces essential options terminology.
• Explains the difference between Call and Put Options.
• Helps understand Strike Price, Premium, and Expiry.
• Demonstrates how ITM, ATM, and OTM classifications work.
• Encourages structured learning before studying advanced options concepts.
___________________________________________________________
📌 Conclusion
Options Trading consists of several foundational concepts that are important to understand before exploring advanced strategies. Learning the relationship between Call Options, Put Options, Strike Price, Premium, Option Expiry, and ITM, ATM, and OTM classifications can help build a stronger understanding of how option contracts function.
___________________________________________________________
⚠️ Disclaimer
📘 For educational purposes only.
🙅 Not SEBI registered.
❌ Not a buy/sell recommendation.
🧠 Purely a learning resource.
📊 Not Financial Advice

USD/INR: Why a Falling Rupee Isn't All Bad (or All Good)Overview
You've probably heard news like "Rupee falls to a new low against the Dollar" and wondered — is that good or bad for the stock market? The honest answer: it depends on which company you're looking at. Just like crude oil, a falling or rising rupee creates winners and losers across different sectors, all at once.
Why Does USD/INR Even Matter to Stocks?
Many Indian companies either earn money from other countries (in dollars) or spend money buying things from other countries (also often in dollars). Whenever the rupee weakens or strengthens against the dollar, it directly changes how much money these companies actually make or spend, once converted back to rupees.
Two Teams, Same News
Team 1: Companies That Benefit When Rupee Weakens (Dollar Rises)
These are companies that earn a large part of their revenue from exports — they get paid in dollars, and a weaker rupee means each dollar converts into more rupees.
IT / Software companies (they bill clients abroad in dollars)
Pharma companies with export business (many sell medicines internationally)
Textile and garment exporters
Chemical exporters
For these companies, a falling rupee is often good news — their export earnings become worth more in rupee terms.
Team 2: Companies That Suffer When Rupee Weakens
These are companies that import raw materials, machinery, or fuel — they pay in dollars, and a weaker rupee means those imports cost more rupees.
Oil and gas companies (crude oil is imported and priced in dollars)
Airlines (fuel and aircraft leasing costs are often dollar-linked)
Companies with heavy foreign debt (repaying dollar loans becomes costlier)
For these companies, a falling rupee is bad news — their costs rise even if nothing else about their business changed.
The Interesting Twist
Here's something that surprises a lot of beginners: even within the same sector, companies can react differently. Two IT companies might both be "exporters," but one may have hedged its dollar exposure (protected itself using financial contracts) while the other hasn't. So the same rupee move can help one and barely affect the other.
A Simple Way to Remember This
Ask yourself: "Does this company earn dollars, or spend dollars?"
Earns dollars (exporters) → usually benefits when rupee weakens
Spends dollars (importers, dollar-debt companies) → usually hurts when rupee weakens
It flips the other way when the rupee strengthens instead
Why This Matters for Your Trading
Next time you see "Rupee hits new low" in the news, resist the urge to assume it's automatically bad for the market. Ask which of your watchlist stocks earn in dollars versus spend in dollars — that's the real story behind the headline.
Beginner's Lesson
Currency moves, like commodity moves, don't affect every company equally. Building the habit of asking "who earns dollars, who spends dollars" turns a confusing headline into a clear, useful piece of information.
Conclusion
A weakening or strengthening rupee always creates winners and losers in the stock market — never just one or the other. Understanding which side a company sits on helps you read currency news with a lot more clarity.
Infographic and chart shown are for illustration and educational purposes only. Not investment advice. Please do your own research or consult a financial advisor before making any decisions. Smart Money and Retail Traders Create Market TrendsHave you ever wondered why a market suddenly starts trending?
One day, price is moving sideways.
Then, without warning, it breaks out and begins a powerful move.
Retail traders often enter after the move becomes obvious. By that time, large market participants may already have been building positions.
This creates an interesting relationship between two major groups in financial markets:
Smart money and retail traders.
They don't always trade in the same way, and they don't always enter at the same time.
Understanding how their behavior interacts can help explain why markets trend, consolidate, reverse, and sometimes move in unexpected directions.
Who Are Smart Money and Retail Traders?
The term "smart money" is commonly used to describe large and experienced market participants.
This can include:
Banks
Hedge funds
Asset managers
Institutions
Professional trading firms
Retail traders are individual market participants trading with comparatively smaller positions.
The difference is not simply about who is smarter.
It is mostly about size, information, experience, and execution.
Large institutions often have the resources to analyze markets in greater depth and manage positions that are far too large for a typical retail trader.
But even institutions cannot predict the future with certainty.
They are still participants in the same market.
How Large Players Build Positions
Imagine an institution wants to buy a very large amount of an asset.
If it buys everything at once, price may move sharply higher, making the remaining purchases more expensive.
Instead, large participants may build positions gradually.
This can happen while price is moving sideways or during periods of uncertainty.
To the average trader, the market may look boring.
But beneath the surface, significant buying or selling may be taking place.
Eventually, when the balance between supply and demand shifts strongly enough, price begins to move.
This is where a trend can start.
Retail Traders Often Join Later
Retail traders frequently enter after a trend becomes visible.
A breakout occurs.
The chart looks bullish.
News becomes positive.
Social media starts discussing the move.
More traders notice the opportunity and begin buying.
Their participation adds further demand.
This can help accelerate the existing trend.
The same thing happens in reverse during downtrends.
As price falls, fear spreads.
Retail traders begin selling.
Stop losses are triggered.
Leverage positions may be liquidated.
The additional selling pressure can push price even lower.
In this way, retail participation can sometimes amplify a trend that has already begun.
The Psychology of the Crowd
Markets are heavily influenced by human emotion.
When prices rise, people become optimistic.
When prices continue rising, confidence turns into excitement.
Eventually, excitement can become greed.
The opposite happens during declines.
Uncertainty becomes fear.
Fear turns into panic.
These emotional cycles create predictable behavior among large groups of traders.
Smart money is not necessarily trying to "trick" retail traders.
However, large participants understand that markets are driven by liquidity and human behavior.
They know where traders are likely to place orders.
They know that obvious highs, lows, support levels, and resistance zones often attract significant activity.
Understanding this behavior can influence how large positions are executed.
Why Liquidity Matters
Liquidity is one of the most important pieces of the puzzle.
Large traders need other participants to take the opposite side of their transactions.
For example, an institution looking to sell a large position needs enough buyers willing to purchase from them.
This is one reason price often moves toward areas where many orders are concentrated.
These areas may include:
Previous highs
Previous lows
Equal highs and lows
Major support and resistance
Breakout levels
Psychological price levels
When price reaches these areas, trading activity can increase significantly.
Sometimes the resulting movement creates a breakout.
Other times, price briefly moves beyond the level before reversing.
This is why understanding liquidity can provide useful context when analyzing market behavior.
How Trends Become Self-Reinforcing
A trend often begins with a relatively small shift in supply and demand.
As price moves, more traders notice.
New participants enter.
Momentum traders join.
Breakout traders react.
The media begins covering the move.
Retail traders become increasingly interested.
Each new participant can add more buying or selling pressure.
The trend becomes self-reinforcing.
This is one reason markets can move much further than many traders initially expect.
The trend is no longer being driven by the original participants alone.
It is now being supported by an expanding crowd.
When the Crowd Becomes Too Confident
Trends eventually reach a point where optimism or pessimism becomes extreme.
At the top of a strong rally, almost everyone may already be bullish.
New buyers continue entering because they fear missing out.
But if most potential buyers have already entered, there may be less new demand available to push prices higher.
At the same time, experienced participants may begin taking profits.
The market becomes vulnerable to a change in sentiment.
The same principle applies during major sell-offs.
When fear reaches an extreme, sellers may become exhausted.
This is often where market cycles begin to change.
Smart Money vs. Retail Money Is Not Always a Battle
It's tempting to think of the market as a simple battle between institutions and retail traders.
Reality is much more complicated.
Institutions can also be wrong.
Retail traders can also identify trends early.
Sometimes both groups are buying.
Sometimes both are selling.
And sometimes different institutions have completely different opinions about the same asset.
The market is not a game where one group always wins.
It is a continuous auction involving millions of participants with different goals, time horizons, and strategies.
What Retail Traders Can Learn
Retail traders cannot compete with institutions on size.
They don't need to.
Their biggest advantage is flexibility.
A retail trader can enter or exit a position quickly.
They can focus on smaller opportunities.
They can remain patient and wait for the right setup.
Instead of trying to predict what large institutions are doing, traders can focus on observing what price is actually showing.
Look for changes in:
Market structure
Volume
Liquidity
Price action
Support and resistance
Trend strength
The goal is not to follow "smart money" blindly.
The goal is to understand the behavior of the market and react accordingly.
Final words
Market trends are not created by one group alone.
Large institutions may provide significant buying or selling pressure.
Retail traders can add momentum and amplify emotional moves.
News and sentiment can attract even more participants.
Together, these forces create the trends we see on our charts.
The most useful lesson is not to think of smart money and retail traders as two opposing teams.
Instead, think of the market as a constantly changing ecosystem of participants.
Some enter early.
Some enter late.
Some provide liquidity.
Some chase momentum.
Some take profits.
And some panic at exactly the wrong time.
When you begin to understand how these different participants interact, price movements start to make more sense.
Because behind every trend is a story.
A story of positioning, liquidity, psychology, and changing expectations.
And the chart is where that story is ultimately revealed.
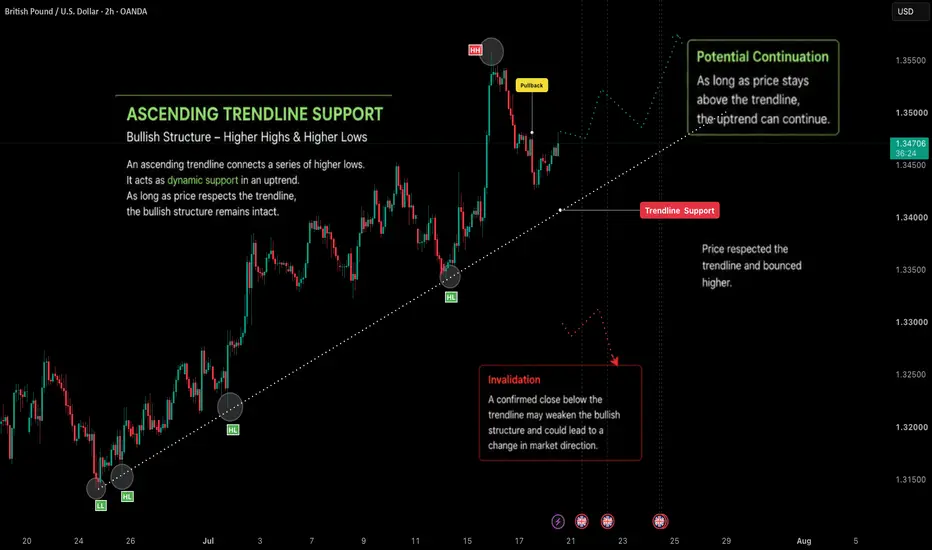
Ascending Trendline Support📌 Overview
An Ascending Trendline is a technical analysis tool used to identify a series of higher lows during an uptrend. In this chart, price has respected the trendline multiple times, indicating that buyers have continued to defend the rising support area. The latest bounce from the trendline suggests that the current bullish structure remains intact while price stays above this dynamic support.
___________________________________________________________
📘 Definition
An Ascending Trendline is created by connecting two or more higher lows during an uptrend. It acts as dynamic support and helps visualize the direction of the prevailing trend.
• Higher Lows – Each higher low indicates that buyers are stepping in at progressively higher prices.
• Trendline Support – The ascending trendline connects these higher lows and represents a dynamic support level.
• Pullback – Temporary declines toward the trendline are common during an uptrend and may offer insight into market strength.
• Bullish Bounce – A positive reaction from the trendline suggests that buyers continue defending the support zone.
• Higher High – After a successful bounce, price may continue creating higher highs, maintaining the bullish structure.
• Invalidation – A confirmed close below the trendline may weaken the current trend structure and indicate that buying momentum is decreasing.
___________________________________________________________
📌 Key Points
• The trendline connects multiple higher lows.
• Price has respected the trendline on several occasions.
• The latest pullback found support near the trendline.
• As long as price remains above the trendline, the bullish structure remains intact.
• A confirmed break below the trendline may indicate a potential change in market structure.
___________________________________________________________
📊 Chart Explanation
• The chart begins with a series of higher lows, establishing an ascending trendline.
• Price continues making higher highs while respecting the rising support.
• After reaching a new high, price experiences a normal pullback toward the trendline.
• The latest bounce from the trendline demonstrates that buyers continue defending the dynamic support area.
• The projected path illustrates one possible continuation scenario if price continues respecting the trendline. This projection is for educational purposes only and does not predict future market movement.
___________________________________________________________
📉 Summary
This chart demonstrates how an Ascending Trendline can help visualize an uptrend by connecting higher lows. The repeated respect of the trendline highlights continued buying interest, while future price action will determine whether the bullish structure continues or becomes invalidated.
___________________________________________________________
💡 Why It Matters
• Helps identify the direction of the prevailing trend.
• Highlights dynamic support levels during an uptrend.
• Encourages traders to wait for price confirmation rather than anticipating moves.
• Can be combined with price action, support and resistance, and other technical tools for additional market context.
___________________________________________________________
📌 Conclusion
Ascending Trendlines provide a simple way to understand market structure and trend direction. Like any technical analysis tool, they are most effective when combined with confirmation and sound risk management rather than being used in isolation.
___________________________________________________________
⚠️ Disclaimer
📘 For educational purposes only.
🙅 Not SEBI registered.
❌ Not a buy/sell recommendation.
🧠 Purely a learning resource.
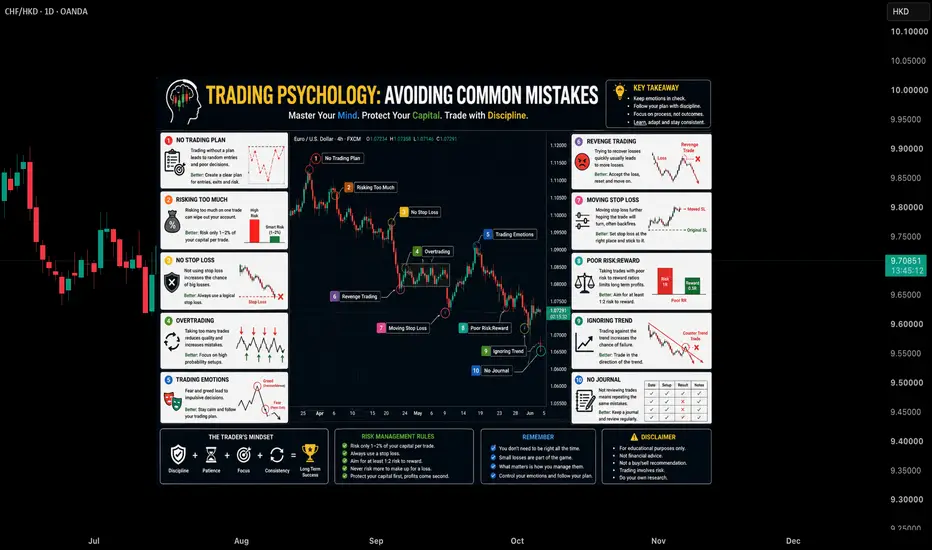
📊 Not Financial Advice Trading Psychology : Avoiding Common Mistakes 📌 Overview
Trading psychology plays a significant role in decision-making and risk management. This educational chart highlights some of the most common trading mistakes that can affect consistency and demonstrates how disciplined habits may help improve overall trading performance.
___________________________________________________________
📘 Definition
Trading Psychology refers to the emotions, mindset, and behavioral habits that influence trading decisions. While technical analysis helps identify market opportunities, psychology often determines how consistently a trading plan is executed.
This educational example highlights several common trading mistakes:
No Trading Plan – Entering trades without predefined rules may lead to inconsistent decisions.
Risking Too Much – Using excessive risk on a single trade can significantly increase overall account exposure.
No Stop Loss – Trading without a predefined exit level may make it more difficult to manage potential losses.
Overtrading – Taking unnecessary trades can reduce discipline and increase emotional decision-making.
Trading Emotions – Fear, greed, and impatience may influence decisions instead of following a structured plan.
Revenge Trading – Attempting to recover previous losses quickly can result in additional emotional trades.
Moving Stop Loss – Adjusting stop-loss levels without a planned reason may increase trade risk.
Poor Risk-Reward Ratio – Taking trades with limited potential reward compared to risk may affect long-term consistency.
Ignoring Trend – Trading against the prevailing market trend may reduce the probability of trend continuation setups.
No Journal – Recording and reviewing previous trades may help identify strengths, weaknesses, and areas for improvement
___________________________________________________________
📌 Key Points
Develop a clear trading plan before entering the market.
Manage risk consistently on every trade.
Use logical stop-loss levels and avoid emotional decisions.
Focus on discipline and consistency rather than short-term results.
Review past trades regularly to identify areas for improvement
___________________________________________________________
📊 Chart Explanation
The numbered labels on the chart illustrate situations where common trading mistakes may occur during normal market conditions.
Each highlighted example demonstrates how emotions or poor risk management can influence decision-making. The surrounding educational panels explain the concept, describe why the mistake can occur, and suggest a more disciplined approach for learning purposes.
___________________________________________________________
📉 Summary
Successful trading is not determined by a single winning trade but by maintaining consistency over time. Understanding trading psychology and recognizing common mistakes may help traders develop better habits, improve discipline, and make more structured decisions.
___________________________________________________________
💡 Why It Matters
• Encourages disciplined decision-making.
• Promotes effective risk management.
• Helps traders recognize emotional biases.
• Supports consistent trading habits.
• Reinforces the importance of following a trading plan.
___________________________________________________________
📌 Conclusion
Trading psychology is an important aspect of technical analysis and risk management. By identifying common mistakes and practicing disciplined habits, traders can build a structured approach to learning and continuously improve their decision-making process.
___________________________________________________________
⚠️ Disclaimer
📘 For educational purposes only.
🙅 Not SEBI registered.
❌ Not a buy/sell recommendation.
🧠 Purely a learning resource.
📊 Not Financial Advice

 Long
Long