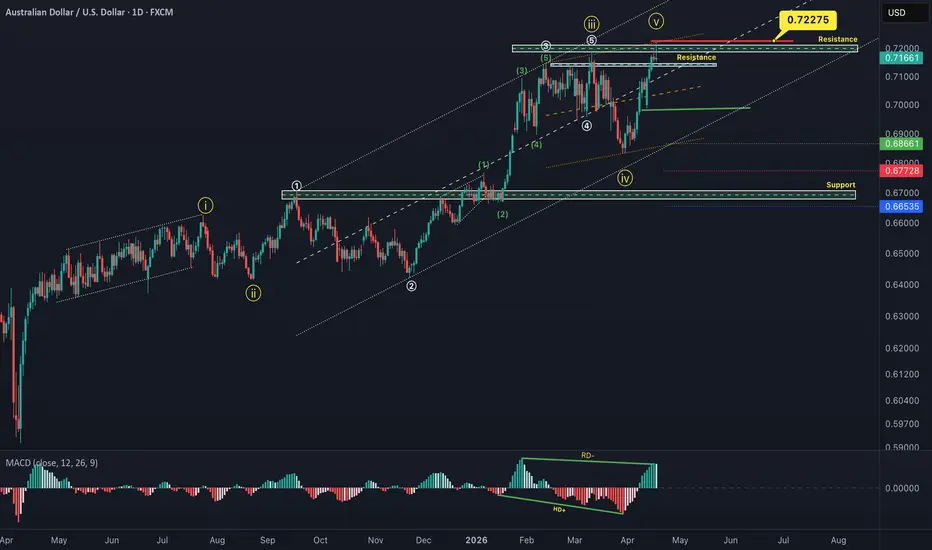
AUDUSD_D📊 Technical Analysis (AUDUSD – Daily Timeframe)
AUDUSD is showing signs of a potential bearish reversal on the daily timeframe.
From an Elliott Wave perspective, the larger wave 5 appears to have completed, suggesting the end of the impulsive structure and the beginning of a corrective phase. This increases the probability of a downside move.
At the same time, a regular bearish divergence is visible, indicating weakening bullish momentum. Price has also reached a key resistance zone, further sup
Forex market
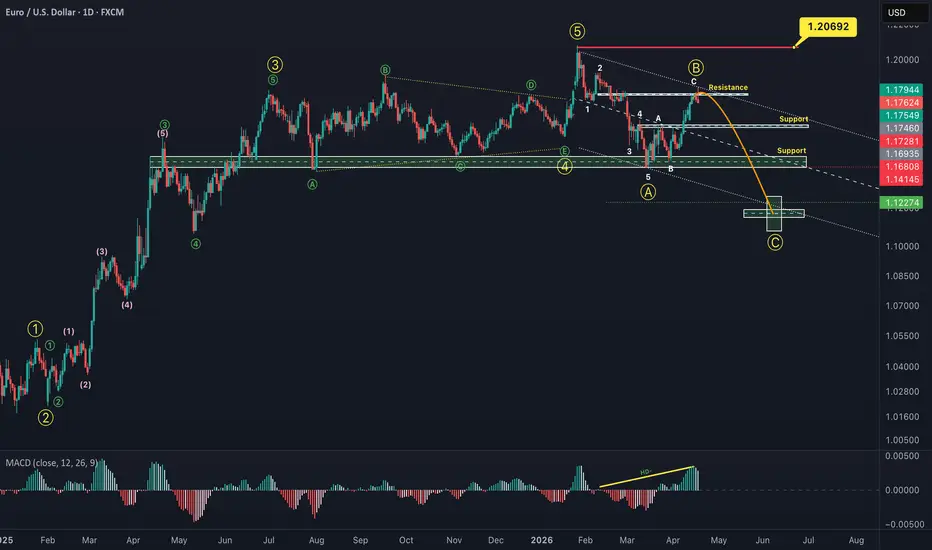
EURUSD_D📊 Technical Analysis (EURUSD – Daily Timeframe)
EURUSD is currently showing signs of a potential bearish continuation on the daily timeframe.
Based on Elliott Wave theory, wave B appears to have completed, and the market is now likely entering wave C, which typically unfolds with strong downward momentum. The structure resembles a zigzag correction (A-B-C).
Additionally, a hidden bearish divergence is visible, reinforcing the downside bias. Price has also reached a key resistance zone, increasin
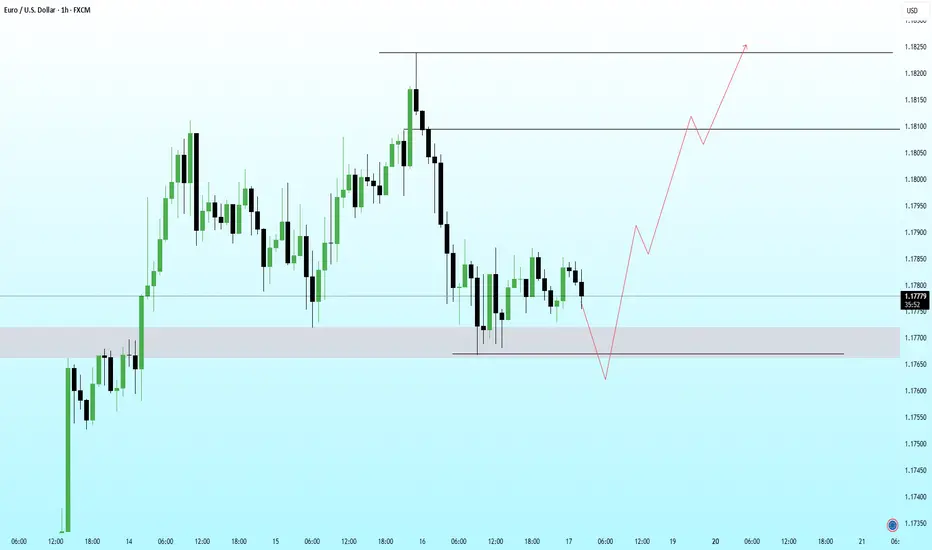
EURUSD H1 TRADE PLANPrice delivered a sell-side liquidity sweep below the Asian/session lows into a 1H demand / bullish OB. The move down looks like a displacement leg completing, not initiating.
Now I’m looking for a classic MM reversal sequence.
Narrative:
SSL taken → price trades into discount (dealing range) → taps bullish OB / imbalance → prints rejection.
Execution plan (ICT model):
Waiting for LTF BOS (shift in market structure) after the sweep
Entry on FVG retracement within that displacement leg
Prefer
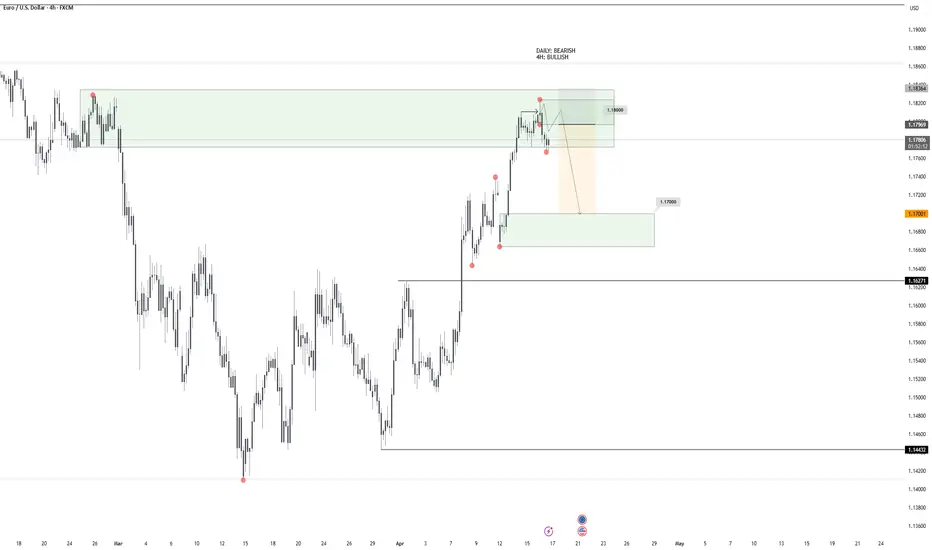
EURUSD Sell SetupBias: Bearish (Supply Zone Rejection)
Entry: 1.18051
Stop Loss: 25 pips above entry
Take Profit: 66.5 pips below entry
RR: ~1:2.6
Setup Logic:
Price is reacting from a higher timeframe supply zone, showing signs of rejection after a strong impulsive move up. The structure indicates potential distribution / liquidity grab above equal highs, followed by weakness.
We are expecting a move back toward discount levels / imbalance fill, aligning with mean reversion from premium pricing.
Confluence
Descending Triangle Chart Pattern📘 Overview
This chart highlights a Descending Triangle pattern forming at a strong support zone.
The structure reflects ongoing selling pressure through lower highs, while buyers continue to defend the same support level.
⸻⸻⸻⸻⸻⸻⸻⸻⸻
📉 Key Price Action
• Price is forming consistent lower highs, indicating bearish pressure
• Support zone is tested multiple times, showing strong demand
• Price is compressing between resistance and support
• Volatility is decreasing, suggesting a potential brea
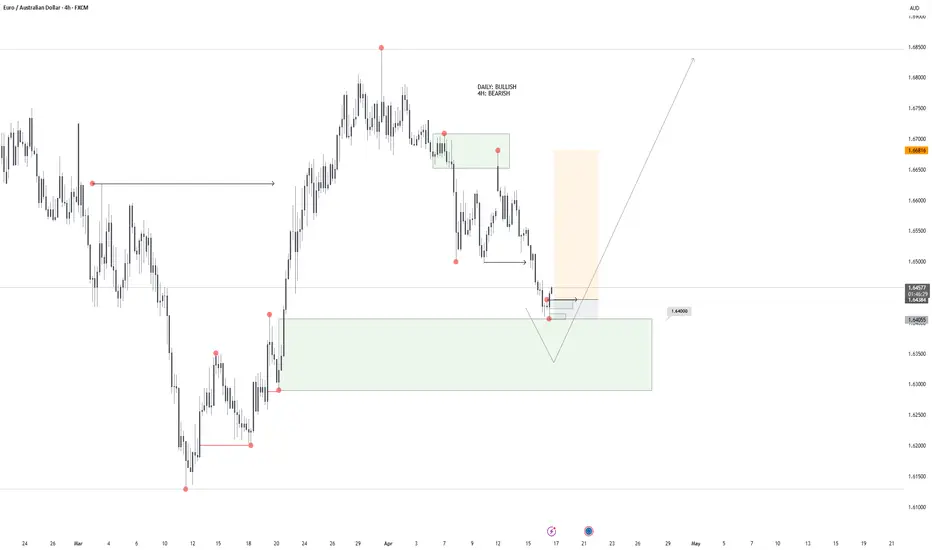
EURAUDI am currently looking for buy opportunities on EA, as the higher time frame trend remains bullish.
However, this setup is counter-trend, since the 4H market structure is still bearish.
On the 15-minute time frame, a bullish flip has already occurred, so now the plan is to stay patient and wait for further confirmation, likely into tomorrow’s session.
This zone is a refined demand zone, which previously caused the entire move to the upside, making it a key area of interest.
For risk manageme
EURUSD / SELLSI am looking for a sell setup as it goes with the HTF trend. Price as well flipped the last 15min structure, signaling it is willing to drop lower into the demand zone at 1.17 handle.
Stop Loss is conservative above the daily supply zone and this for me is a high profitability setup. Also the drawing you see - I made it yesterday and price did developed like that.
NZD/USD Threatens to Fall as Dollar RecoversThe NZD/USD maintained its positive bias for the fourth consecutive day, trading slightly above the psychological level of 0.5900.
Although gains were restrained by a modest recovery in the US dollar (USD) as a safe-haven asset, overall market sentiment remained supportive of the Kiwi thanks to positive Chinese economic data and hopes for diplomacy.
-------------------------------------------------------------------------------------
✅ Fundamental Dynamics: Geopolitical Risk Push-and-Pull
T
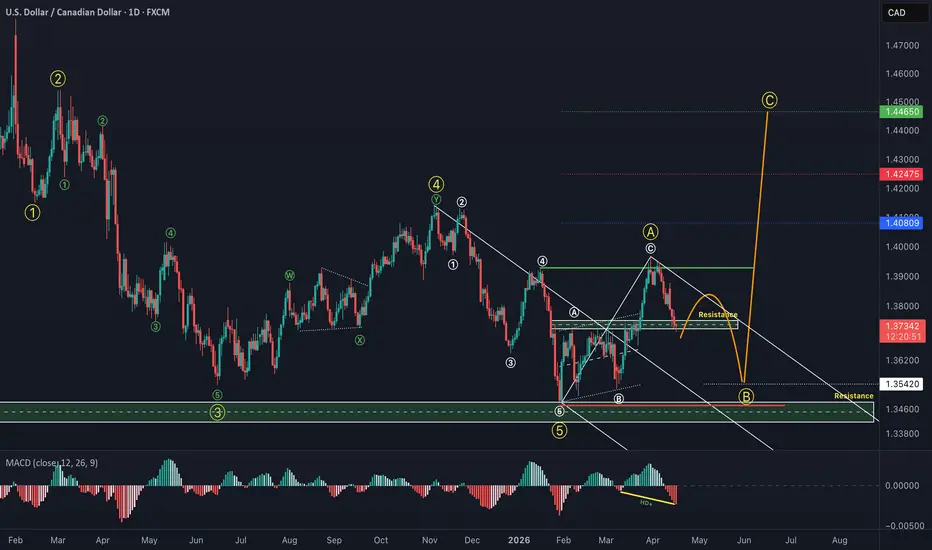
USDCAD_D📊 USDCAD Daily Analysis
Following the recent strong bearish move, price has now reached key resistance levels. At the same time, a hidden bullish divergence is forming, suggesting the potential for a short-term corrective move.
From an Elliott Wave perspective (Elliott Wave Theory), Wave A appears to be completed, and the market is currently developing within a larger Wave B structure.
In the short term, a minor pullback or consolidation is expected. However, the broader outlook remains bearish,
Dual Scenario: Fundamental vs TechnicalYen on High Alert
Japanese Finance Minister Katayama issued a fresh warning on April 15, 2026, stating she is prepared to take "bold action" to support the YEN.
- The USD/JPY pair is currently hovering around 158–159, a level that has historically triggered direct market intervention by Japanese authorities.
---------------------------------------------------------------------------------------
The 4H chart shows 2 scenarios about the USD/JPY possible price movement
1. BLUE DOWNWARD PROJEC
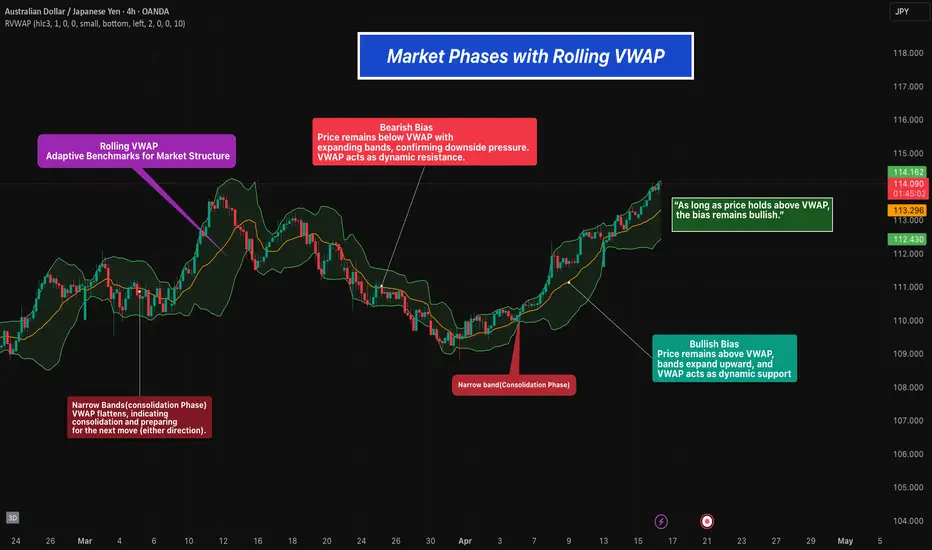
Market Phases with Rolling VWAP📘Overview
Rolling VWAP helps define market structure by identifying different phases of price behavior.
Instead of using VWAP as just a single line, combining it with expanding and contracting bands allows us to understand whether the market is trending or consolidating.
⸻⸻⸻⸻⸻⸻⸻⸻⸻
📉 Key Price Action
• Price below VWAP with expanding bands indicates bearish pressure
• Narrow bands with flat VWAP signal consolidation
• Price above VWAP with expanding bands confirms bullish momentum
• Band c
GBP/USD Analysis (Daily Chart) 15/4/26Weakness Expected in GBPUSD
The pair rose substantially (~3.0%) in the previous 7 trading sessions, while testing multi-week highs of 1.3590 yesterday.
The prices recently tested a confluence of resistance, including the iFVG, the fib level 0.618, & the upper Bollinger band.
The RSI is also reversing from the overbought zone
The pair, while writing the analysis, stays defensive due to renewed US Dollar demand.
Projection (GBPUSD)
Overall, all factors signal a correction in the GBP/USD p
EURUSD 15M — Long from discount.After an aggressive sell-off, price delivered a clean sell-side liquidity sweep, tapping into a discounted region where reactions are expected. The move into lows lacked follow-through, hinting at exhaustion rather than continuation.
📍 What stands out:
Sell-side liquidity taken → fuel for reversal
Sharp reaction from lows → presence of buyers
Failure to continue lower → momentum shift brewing
Price holding discount → favorable risk positioning
USD/JPY Gaining Fairly Weak MomentumUSD/JPY showed steady resistance above 158.00, but struggled to break through the psychological barrier of 159.00 in today's Asian trading session.
---------------------------------------------------------------------------------------
✅ Economic Reality: Japan and the Effects of the Hormuz Blockade
Despite peace talks, the economic threats to Japan are very real:
- ⚡Energy Dependence: Japan relies on the Strait of Hormuz for approximately 93% of its oil imports and the majority of its liquef
EURUSD M15Clean sell-side liquidity sweep followed by displacement to the downside. Market delivered exactly what it always does when engineered correctly: liquidity → inefficiency → retracement → continuation.
📍 Key Observations:
Equal lows taken → liquidity cleared
Strong bearish displacement → confirms intent
Price trading back into imbalance (FVG)
Premium zone aligns with supply → high-probability reaction area