Bank Nifty Regains Momentum Near Crucial ResistanceHighlights
* Bank Nifty has witnessed a sharp rebound led by heavyweight private sector banks, with renewed buying interest emerging ahead of the Q1FY27 earnings season. The index has reclaimed its short-term moving averages, reinforcing the broader bullish structure.
* The **57,800–58,000** zone remains the immediate resistance area. A decisive close above this range could trigger fresh buying momentum and pave the way for an advance towards **58,500–58,800** in the near term.
* On the downside, the **57,200–57,400** range serves as immediate support, while the **56,800** level remains a strong medium-term demand zone. Holding above these levels would keep the bullish outlook intact.
* Momentum indicators are showing signs of improvement, with RSI rebounding from neutral territory and MACD indicating strengthening momentum. Improving market breadth within the banking space further supports the ongoing recovery.
* The index has formed a higher-low pattern on the daily chart after successfully defending its key support zone, suggesting that buyers continue to accumulate positions on declines rather than chasing prices at higher levels.
* Strong participation from banking heavyweights such as HDFC Bank, ICICI Bank, and SBI, coupled with optimism surrounding quarterly earnings, continues to provide a favorable backdrop for Bank Nifty's technical setup.
Takeaway
Bank Nifty is displaying encouraging signs of a recovery following its recent consolidation phase. A sustained move above **58,000** could accelerate buying momentum and push the index towards the **58,500–58,800** zone. As long as Bank Nifty holds above the **57,200–57,400** support range, the technical bias remains positive, making short-term declines potential buying opportunities rather than indications of a trend reversal.
 Long
Long
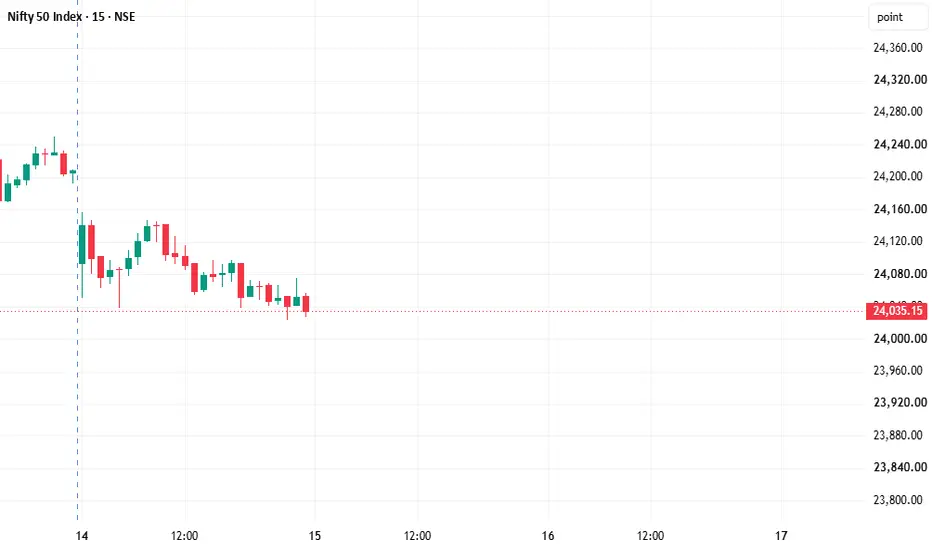
Nifty Intraday Outlook 15-07-2026NIFTY 15 Min: Support Under Pressure Near 24,000
NIFTY is trading near 24,035 and testing the important 24,025–24,000 support zone.
The lower timeframe structure is weak after rejection from higher levels. Price is still below the immediate resistance band of around 24150, so bulls need a reclaim above this zone for recovery.
Key Levels
Resistance: 24,150
Major Resistance: 24,240
Upside Target: 24,360
Support: 24,025–24,000
Next Support: 23,940–23,900
Lower Target: 23,800
Trade Plan
Bearish below 24,000
Targets: 23,940 / 23,900 / 23,807
Bullish only above 24,146
Targets: 24,239 / 24,300 / 24,369
Rejection near 24,112–24,146 can again create PE opportunity.
View
NIFTY is not bullish yet.
Below 24,000 → sellers active
Above 24,150 → recovery attempt
Above 24,240 → buyers gain strength
Educational view only. Trade with strict risk management. #NIFTY Intraday Support and Resistance Levels - 15/07/2026Nifty is expected to open with a slightly gap-up bias. The index is hovering near the crucial 24050 support zone, making today's opening important for determining the next intraday direction. Traders should wait for confirmation before initiating fresh positions, as sustained buying above support can trigger further upside.
The immediate support is placed at 24050–24100. If Nifty sustains above this zone after the slightly gap-up opening, traders can consider long positions with targets of 24150, 24200, and 24250. A decisive breakout above 24250 will confirm fresh bullish momentum and may extend the rally towards 24350, 24400, and 24450+.
On the downside, if Nifty slips below 23950, traders can consider short positions with targets of 23850, 23800, and 23750. A sustained breakdown below 23950 will strengthen the bearish trend and may accelerate the decline toward lower support levels.
Overall, a slightly gap-up opening is expected. As long as Nifty holds above the 24050 support zone, buying on dips remains the preferred strategy. Fresh short positions should only be considered after a confirmed breakdown below 23950, with strict stop-losses and disciplined profit booking at each target level. #BANKNIFTY Intraday PE & CE Levels(15/07/2026)Bank Nifty is expected to open with a gap-up bias. However, the index is trading near an important resistance zone, so traders should wait for confirmation before initiating fresh long positions. A sustained move above resistance can trigger fresh buying momentum, while failure to hold higher levels may invite profit booking.
The immediate support is placed at 57550–57600. If Bank Nifty holds above this zone after the gap-up opening, traders can consider CE positions with targets of 57750, 57850, and 57950. A decisive breakout above 58050 will confirm stronger bullish momentum and may extend the rally towards 58250, 58350, and 58450.
On the downside, if Bank Nifty slips below 57950–57900, traders can consider PE positions with targets of 57750, 57650, and 57550. A sustained breakdown below 57450 will strengthen the bearish trend and may push the index towards 57250, 57150, and 57050.
Overall, a gap-up opening is expected. As long as Bank Nifty sustains above the 57550 support zone, buying on dips remains the preferred strategy. Fresh short positions should only be considered after a confirmed breakdown below 57950 or 57450, with strict stop-losses and disciplined profit booking at each target level. NIFTY : Trading levels and Plan for 15-Jul-2026Hello Traders! 👋 Below is a complete, educational trading roadmap for NIFTY 50, covering Gap Up, Flat, and Gap Down (100+ points) opening scenarios. The plan is built around key support-resistance levels visible on the chart, along with practical risk management guidance for options traders. Please go through the entire plan before acting on any level. 🎯
🔑 Important Levels on Chart
🔸 Last Intraday Resistance → 24,375.00
🔸 Opening Resistance (relevant for Gap Up) → 24,140.00
🔸 Opening Support/Resistance (No-Trade Orange Zone) → 24,035.15 / 24,032.00
🔸 Last Intraday Support → 23,901.00
🔸 Extended Downside Level → 23,710.00
📌 Chart Legend: 🟠 Orange Line = Sideways/No-Trade Zone | 🟢 Green = Bullish/Long Bias | 🔴 Red = Bearish/Short Bias | Dashed Lines = Unconfirmed move ("trend may or may not sustain" — trade with caution and trail SL)
🟢 SCENARIO 1: GAP UP OPENING (100+ points → Open above ~24,135-24,150)
📚 Understanding the setup: A strong gap-up opening reflects positive overnight sentiment, but such openings frequently invite early profit booking. Confirmation before entry is essential — don't chase the first candle.
🟢 Action Plan:
🔹 A sustained move and 15-min candle closing above 24,140 confirms bullish strength — this is your cue to look at Call Option (CE) buying on shallow dips near 24,140-24,150.
🔹 First target for the move → 24,209 (Last Intraday Resistance).
🔹 On a strong breakout and closing above 24,209, the door opens for an extended rally toward 24,375 — remember this is a dashed/unconfirmed zone, so keep trailing your stop-loss rather than holding blindly.
🔹 If price gaps up but immediately reverses near 24,140-24,150 with weak red candles (as shown in the orange zig-zag pattern), treat it as exhaustion — avoid fresh buying. Wait for price to retest 24,035 (Opening Support/Resistance) for the next directional clue.
🔹 Stop-Loss for long positions → Below 24,032 on 15-min closing basis.
⚠️ Risk Tip: Right after a gap-up open, option premiums are often overpriced due to IV spike. Let the first 15-min candle close before entering to avoid buying into inflated premiums.
🟠 SCENARIO 2: FLAT OPENING (Open within the 24,032–24,140 range)
📚 Understanding the setup: A flat open signals market indecision. This zone marked in orange is essentially a No-Trade Zone — both buyers and sellers are testing each other without a clear winner yet.
🟠 Action Plan:
🔹 If NIFTY opens flat around 24,035-24,040 and continues to oscillate between 24,032 (support) and 24,140 (resistance), refrain from directional option buying — sideways price action combined with time decay is a losing combination for buyers. 🚫
🔹 A confirmed breakout above 24,140 with strong volume → shift to the Gap Up bullish playbook (CE buying, targets 24,209 → 24,375).
🔹 A confirmed breakdown below 23,901 with strong volume → shift to the Gap Down bearish playbook (PE buying, target 23,710).
🔹 Experienced traders may explore premium-selling strategies (like Iron Condors or hedged Short Straddles) during this range-bound phase, since sideways movement favors time decay — but only with proper hedges in place.
⚠️ Risk Tip: Flat markets punish impatient option buyers the most. Wait for a clean breakout/breakdown candle close rather than guessing direction early.
🔴 SCENARIO 3: GAP DOWN OPENING (100+ points → Open below ~23,935)
📚 Understanding the setup: A sharp gap-down usually stems from negative global cues or heavy overnight selling pressure. However, gap-downs can either extend into panic selling or attract aggressive dip-buyers — so wait for confirmation.
🔴 Action Plan:
🔹 A sustained move and 15-min candle closing below 23,901 confirms bearish continuation — look at Put Option (PE) buying on pullback rallies toward 23,935-23,950.
🔹 First bearish target → 23,710 (extended downside zone). Since this is a dashed/unconfirmed level, keep trailing your SL as confirmation isn't guaranteed.
🔹 If price gaps down but quickly reverses (dashed green recovery pattern) and reclaims 23,901, followed by a move back above 24,032-24,035, avoid fresh short positions — this hints at a V-shaped recovery. Wait for confirmation above 24,035 before considering long positions.
🔹 Stop-Loss for short positions → Above 24,032 on 15-min closing basis.
⚠️ Risk Tip: Gap-down opens often produce a "dead cat bounce." Avoid shorting impulsively at the open — wait for a retest and rejection near resistance before initiating PE positions.
🛡️ Risk Management Tips for Options Trading
🔸 Always enter with a predefined Stop-Loss — never average into a losing options trade.
🔸 Limit risk per trade to 1-2% of total capital — options carry inherent leverage risk.
🔸 Avoid buying options in the first few minutes of market open — inflated IV can hurt entries.
🔸 Book partial profits at the first target and trail SL to breakeven to protect gains.
🔸 Avoid overnight option holding unless backed by strong technical/fundamental reasoning — theta decay is a buyer's enemy.
🔸 Prefer hedged spread strategies over naked buying/selling to control downside risk.
🔸 Combine technical levels with OI data, PCR, and India VIX for stronger confirmation before entry.
📝 Summary & Conclusion
Today's structure revolves around three critical zones — 24,140 (Opening Resistance), 24,032-24,035 (No-Trade Zone), and 23,901 (Last Intraday Support).
✅ Gap Up (100+ pts): Sustained move above 24,140 → CE buying, targets 24,209/24,375.
✅ Flat Opening: Stay out between 24,032-24,140; act only after breakout/breakdown confirmation.
✅ Gap Down (100+ pts): Sustained move below 23,901 → PE buying, target 23,710; watch for reversal signs too.
Successful trading is built on patience, discipline, and strict adherence to risk management — not on predictions. Trade your plan, not your emotions! 💪📈
⚠️ Disclaimer
I am not a SEBI registered analyst. This content is shared purely for educational purposes to help traders understand chart-based support-resistance concepts and risk management in options trading. This is not a recommendation to buy or sell any security. Please consult a qualified financial advisor and do your own research (DYOR) before making any investment or trading decisions. Trading in equities and derivatives carries significant financial risk. 🙏📉📈 SENSEX Trade Plan [15.07.2026: Wednesday]Probable Scenario Analysis and Trade Plan for the SENSEX BSE:SENSEX for the 15th of July, 2026. The day is Wednesday.
🟢 Bullish Scenario
There is no bullish setup observable in the present price action. Doubt every upmove. However, if the price sustains above 77750, then the probable bullish target would be - 78000.
🔴 Bearish Scenario
Presently, the price is in the bearish zone. If the price remains below 77250, then find bearish opportunities. The probable bearish targets below 77250 would be - 77000, 76750, and 76500.
🟡 No Trading Zone (NTZ): (77750 - 77250).
⏺ Range of Consolidation (ROC): (77750 - 77000).
Here, 77375 is the median of the ROC. The median works like an intraday sentiment evaluator. The price trading above the median would offer bullish sentiment, while the price trading below the median would trigger bearish sentiment within the ROC.
● Event
No high-impact event this week. No holidays this week. No expiry. However, the next day (Thursday) is the SENSEX expiry. Lastly, geopolitical issues are omnipresent.
● Intraday Bias
Establish intraday bias with respect to the opening price. If the price sustains above the opening price, then don't think of shorting. Look for bullish trades only. On the contrary, if the price sustains below the opening price, then don't think of going long. Look for bearish trades in that case.
● Disclaimer + End Note
- All the analyses would fail in the case of a major gap up, gap down, or price structure anomaly. Thus, practice PRAGMATISM in the live session.
- Trade only if there is a set-up. Remember, not trading is an extension of the trading activity.
- Mark your points. Trade your points. Price is GOD. Anything can happen in the markets. Thus, trade what you see, not what you believe.
- Always PRACTICE RISK MANAGEMENT. Always PROTECT YOUR CAPITAL. Be RESPONSIBLE.
- Be Strategic. Be Courageous. Be Patient. Be Wise.
- Every day is a new day. Thus, do not carry the baggage of past successes or failures. Leave the gardens of winning and losing. Establish yourself in equanimity. Always think from a new perspective.
- Let the joy of trading drive your effectiveness, not greed or fear. Believe in Possibilities.
Happy Trading!
Nifty 50 Trade Plan [15.07.2026: Wednesday]Probable Scenario Analysis and Trade Plan for the Nifty 50 Index NSE:NIFTY for the 15th of July, 2026. The day is Wednesday.
🟢 Bullish Scenario
There is no bullish setup observable in the present price action. Doubt every upmove. However, if the price sustains above 24300, then the probable bullish targets would be - 24350 and 24400.
🔴 Bearish Scenario
Presently, the price is in the bearish zone. If the price remains below 24100, then find bearish opportunities. The probable bearish targets below 24100 would be - 24050, 24000, 23950, 23900, 23850, and 23800.
🟡 No Trading Zone (NTZ): (24300 - 24100).
⏺ Range of Consolidation (ROC): (24300 - 24000).
Here, 24150 is the median of the ROC. The median works like an intraday sentiment evaluator. The price trading above the median would offer bullish sentiment, while the price trading below the median would trigger bearish sentiment within the ROC.
● Event
No high-impact event this week. No holidays this week. No expiry. However, the next day (Thursday) is the SENSEX expiry. Lastly, geopolitical issues are omnipresent.
● Intraday Bias
Establish intraday bias with respect to the opening price. If the price sustains above the opening price, then don't think of shorting. Look for bullish trades only. On the contrary, if the price sustains below the opening price, then don't think of going long. Look for bearish trades in that case.
● Disclaimer + End Note
- All the analyses would fail in the case of a major gap up, gap down, or price structure anomaly. Thus, practice PRAGMATISM in the live session.
- Trade only if there is a set-up. Remember, not trading is an extension of the trading activity.
- Mark your points. Trade your points. Price is GOD. Anything can happen in the markets. Thus, trade what you see, not what you believe.
- Always PRACTICE RISK MANAGEMENT. Always PROTECT YOUR CAPITAL. Be RESPONSIBLE.
- Be Strategic. Be Courageous. Be Patient. Be Wise.
- Every day is a new day. Thus, do not carry the baggage of past successes or failures. Leave the gardens of winning and losing. Establish yourself in equanimity. Always think from a new perspective.
- Let the joy of trading drive your effectiveness, not greed or fear. Believe in Possibilities.
Happy Trading!  Education
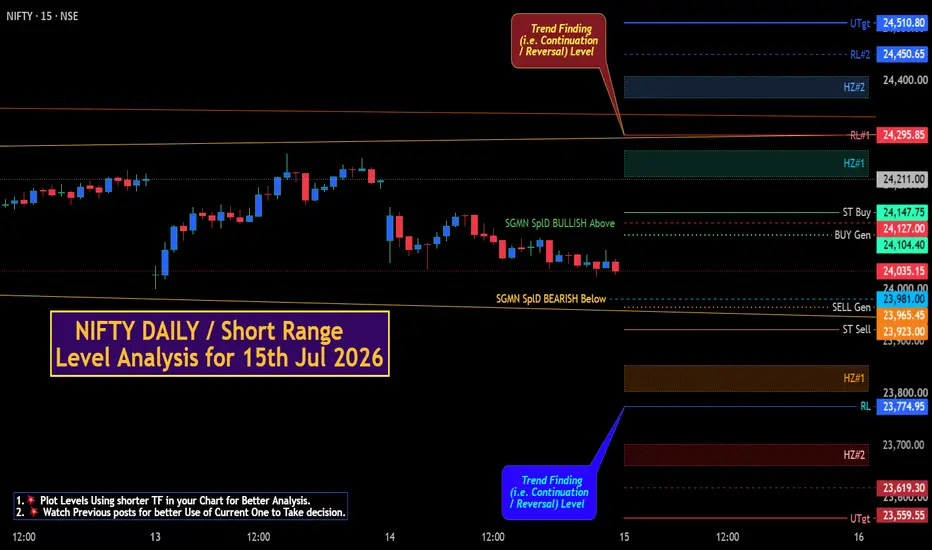
NIFTY DAILY / Short Range Level Analysis for 15th Jul 2026.NIFTY DAILY / Short Range Level Analysis for 15th Jul 2026.
🔕 SGMN SplD BULLISH Above => 24127.
🔕 SGMN SplD Bearish BELOW => 23981.
Mentioned analysis based on 2 consecutive candle close in 15 min Time Frame.
━━━━━🟥🟧🟨🟩🟦🟪⬛━━━━━
💥Level Interpretation / description:
✍🏻L#1: If the candle crossed & stays above the “Buy Gen”, it is treated / considered as Bullish bias. Cfm=> Confirmation.
L#2: Possibility / Probability of REVERSAL near 🔕RL/TF1 & 🔔RL/TF2
L#3: If the candle stays above “Sell Gen” but below “Buy Gen”, it is treated / considered as Sidewise. Aggressive Traders can take Long position near “Sell Gen” either retesting or crossed from Below & vice-versa i.e. can take Short position near “Buy Gen” either retesting or crossed downward from Above.
L#4: If the candle crossed & stays below the “Sell Gen”, it is treated / considered a Bearish bias.
L#5: Possibility / Probability of REVERSAL near 🔕RL/TF1 & 🔔RL/TF2
HZB (Buy side) & HZS (Sell side) => Hurdle Zone,
✍🏻 *** Specialty of “HZB#1, HZB#2 HZS#1 & HZS#2” is Sidewise (behaviour in Nature)
Rest Plotted and Mentioned on Chart
Color code Used:
Green, BLUE =. Positive bias.
Safron, RED =. Negative bias.
RED in Between Green means Trend Finder / Momentum Change
/ CYCLE Change and Vice Versa.
Notice One thing: HOW LEVELS are Working.
Use any Momentum Indicator / Oscillator or as you "USED to" to Take entry.
━━━━━🟥🟧🟨🟩🟦🟪⬛━━━━━
⚠️ DISCLAIMER:
The information, views, and ideas shared here are purely for educational and informational purposes only. They are not intended as investment advice or a recommendation to buy, sell, or hold any financial instruments. I am not a SEBI-registered financial adviser.
Trading and investing in the stock market involves risk, and you should do your own research and analysis. You are solely responsible for any decisions made based on this research.
"🔔As HARD EARNED MONEY IS YOUR's, So DECISION SHOULD HAVE TO BE YOUR's".
━━━━━🟥🟧🟨🟩🟦🟪⬛━━━━━
❇️ Follow notification about periodical View
💥 Do Comment for Stock WEEKLY Level Analysis.🚀
📊 Do you agree with this view?
✈️ HIT THE PLANE ICON if this technical observation resonates with you. It will Motivate me.
━━━━━🟥🟧🟨🟩🟦🟪⬛━━━━━
💡 If You LOOKING any CHART & want for Level and ANALYZE?
Share your desired stock names in the comments below! I will try to analyze the chart Levels, patterns and share my technical view (so far my Knowledge).
If Viewers think It can identify meaningful setups. Looking forward to hearing from all of you — let's keep this discussion going and help each other make better trading decisions.
___________🔕^^^⚫⚪^🙏🏼🙏🏼🙏🏼^⚪⚫^^^🔔___________  Education
Education