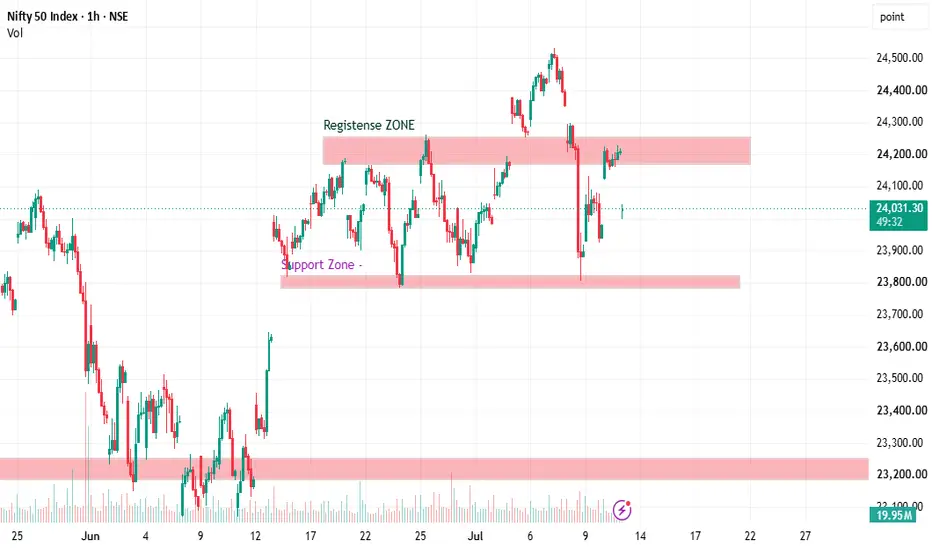
#NIFTY Intraday Support and Resistance Levels - 13/07/2026Nifty is expected to open with a gap-down bias near the 24000 level. Despite the weak opening, the index is trading close to a crucial support zone where buying interest may emerge. Traders should wait for confirmation before taking fresh positions as opening volatility is likely to remain high.
The immediate support is placed at 24050–24100. If Nifty sustains above this zone and shows buying momentum, traders can consider long positions with targets of 24150, 24200, and 24250. A decisive breakout above 24250 will confirm fresh bullish momentum and may extend the rally towards 24350, 24400, and 24450+.
On the downside, if Nifty fails to hold the 23950 support level, traders can consider short positions with targets of 23850, 23800, and 23750. A sustained breakdown below this level will indicate renewed selling pressure and strengthen the bearish outlook.
Overall, a gap-down opening near the 24000 level is expected. As long as Nifty holds above the 24050–24100 support zone, buying on dips remains the preferred strategy. Fresh shorts should be considered only after a confirmed breakdown below 23950. Follow strict stop-losses and book profits gradually at each target level. Nifty Intraday Outlook for 13-07-2026NIFTY 15 Min: Recovery Reaches Resistance — 24,250 Breakout Needed
NIFTY is trading near 24,200 after a strong recovery from lower levels.
The chart has improved, but price is now testing the important 24,220–24,250 resistance zone. Bulls need a clean breakout above this zone for fresh upside momentum.
____________________________
Key Levels
Resistance: 24,220
Target 1: 24,290
Target 2: 24,350
Support: 24,150
Lower Levels: 24,130 / 24,100 / 24,020
Demand Zone: 23,950
____________________________
Trade Plan
Bullish above 24,250
Targets: 24,300 / 24,350
Buy-on-dip near 24,160–24,150
Only if bullish rejection appears.
Bearish below 24,150
Targets: 24,100 / 24,020 / 23,950
____________________________
View
NIFTY is recovering, but not fully bullish yet.
Above 24,250 → buyers active
Above 24,300 → recovery strengthens
Below 24,150 → sellers return
____________________________
Educational view only. Trade with strict risk management. #BANKNIFTY Intraday PE & CE Levels(13/07/2026)Bank Nifty is expected to open with a gap-down bias, but the overall trend remains positive as long as the index holds above the immediate support zone. Early volatility is likely, and traders should wait for confirmation before initiating fresh positions.
The immediate support is placed at 57550–57600. If Bank Nifty holds this zone and attracts buying interest, traders can consider CE positions with targets of 57750, 57850, and 57950. A decisive breakout above 58050 will confirm fresh bullish momentum and may extend the rally towards 58250, 58350, and 58450+.
On the downside, if the index fails to sustain above 57950–57900 after a pullback, traders can consider reversal PE positions with targets of 57750, 57650, and 57550. A sustained breakdown below 57450–57400 will strengthen the bearish bias and may drag the index towards 57250, 57150, and 57050.
Overall, a gap-down opening is expected. However, unless Bank Nifty breaks below 57550, the broader recovery structure remains intact. Traders should prefer buying on dips above support, while fresh shorts should be considered only after a confirmed breakdown below 57450. Follow strict stop-losses and book profits gradually at each target level. NIFTY : Intraday Trading Plan | 13-Jul-2026Instrument: NIFTY 50 Index (15 Min Chart)
Previous Close: 24,211.65
Gap Consideration: 100+ points (Gap Up / Gap Down)
🧭 Chart Legend (For Reference)
🟢 Solid Green Line = Bullish / Long Bias Zone
🔴 Solid Red Line = Bearish / Short Bias Zone
🟠 Solid Orange Line = No-Trade / Sideways Zone
➖ Dashed Line (Any Color) = Trend "May or May Not" Sustain — Wait for Confirmation
🔑 KEY LEVELS TO WATCH TODAY
•🔸 Last Intraday Resistance: 24,375
•🔸 Opening Support/Resistance Zone: 24,244 – 24,276
•🔸 Opening Support Zone: 24,143 – 24,167
•🔸 Last Intraday Support: 24,036
•🔸 Deep Support (Extended): 23,926
🟢 SCENARIO 1: GAP UP OPENING (100+ points) — Open above 24,311
📈 Explanation: A gap-up opening above 24,311 will push price directly near or above the Last Intraday Resistance of 24,375. Since this is a "resistance zone," the first reaction is critical — markets often either continue the breakout or trap buyers with a false move.
•🟢 If price sustains above 24,375 with strong 15-min candle close → Fresh bullish momentum can build, targeting extended highs. Consider Long via Call Options (CE) on retracement/dip near 24,375-24,390 zone.
•🟠 If price opens gap-up but struggles to hold above 24,375 → Treat as No-Trade Zone initially. Wait for 15-30 min consolidation before deciding direction.
•🔴 If price gets rejected sharply from 24,375-24,400 and closes back below 24,311 (gap-fill zone) → This signals exhaustion. Consider Short via Put Options (PE), targeting gap-fill towards 24,244-24,276 zone.
•➖ Dashed Caution: Gap-up openings often see profit booking in first hour. Avoid chasing the first candle blindly — let structure confirm.
🟠 SCENARIO 2: FLAT OPENING (Within ±100 points) — Open between 24,111 – 24,311
⚖️ Explanation: A flat opening keeps price trapped between the Opening Support (24,143-24,167) and Opening Support/Resistance Zone (24,244-24,276). This is the most common scenario and requires patience — avoid trading inside these zones as they represent indecision/no-trade areas.
•🟠 If price opens and stays within 24,167 – 24,244 range → This is a No-Trade Zone. Wait for a clean breakout on either side with volume confirmation before taking a position.
•🟢 If price breaks above 24,276 with strong momentum → Bullish bias activates. Consider Long via Call Options (CE), targeting Last Intraday Resistance at 24,375.
•🔴 If price breaks below 24,143 with strong momentum → Bearish bias activates. Consider Short via Put Options (PE), targeting Last Intraday Support at 24,036.
•➖ Dashed Caution: In flat openings, false breakouts are common in the first 30-45 minutes. Always confirm with a candle close beyond the zone, not just a wick/spike.
🔴 SCENARIO 3: GAP DOWN OPENING (100+ points) — Open below 24,111
📉 Explanation: A gap-down opening below 24,111 will bring price closer to the Last Intraday Support at 24,036. This is a critical support zone — reaction here decides whether sellers extend control or buyers step in for a pullback.
•🔴 If price opens gap-down and breaks below 24,036 with follow-through selling → Strong bearish continuation likely. Consider Short via Put Options (PE), targeting deep support at 23,926.
•🟠 If price opens gap-down but holds above 24,036, moving sideways → Treat as No-Trade Zone. Wait for direction confirmation before entering.
•🟢 If price finds support at 24,036 and reverses with a strong bounce back above 24,143-24,167 → This signals a potential gap-fill rally. Consider Long via Call Options (CE) targeting the Opening Support/Resistance Zone (24,244-24,276).
•➖ Dashed Caution: Gap-down opens can trigger panic selling early, followed by sharp short-covering. Avoid shorting blindly at open — wait for the first 15-min candle to confirm direction.
⚠️ RISK MANAGEMENT TIPS FOR OPTIONS TRADING
•🛡️ Always trade with a predefined Stop Loss (SL) — never average a losing options position.
•🛡️ Avoid buying deep OTM options; prefer ATM or slightly ITM strikes for better delta and reduced time decay impact.
•🛡️ Position sizing matters — never risk more than 1-2% of your capital on a single trade.
•🛡️ Keep an eye on Theta decay, especially in the last hour of expiry-week trading.
•🛡️ Avoid trading inside "No-Trade Zones" (orange areas) — this is where most retail traders lose money to whipsaws.
•🛡️ Use partial profit booking on strong moves rather than holding for the entire target — markets can reverse quickly near resistance/support.
•🛡️ Always check India VIX before taking option positions — high volatility can inflate premiums and increase risk.
📝 SUMMARY & CONCLUSION
Today's plan revolves around three key zones: 24,375 (Resistance), 24,244-24,276 (Pivot Zone), and 24,036 (Support). Depending on how NIFTY opens — Gap Up, Flat, or Gap Down — traders should wait for confirmation via candle closes rather than reacting to the opening tick. The orange zones represent indecision and should be avoided for fresh entries. Green and red zones offer directional opportunities only after breakout/breakdown confirmation. Patience in the first 15-30 minutes of trade is the key to avoiding false signals today. 🎯
⚠️ DISCLAIMER
I am not a SEBI Registered Analyst. This post is purely for educational purposes and reflects personal technical analysis based on chart patterns. It should not be considered as investment/trading advice. Please consult your financial advisor before making any trading or investment decisions. Trading in equities/options involves substantial risk of loss. 🙏📚  Long
Long
NIFTY ANALYSIS | MONDAY, 13 JULY 2026 | DAILY → 4H →1H→15-MIN TF# 📊 NIFTY ANALYSIS | MONDAY, 13 JULY 2026 | DAILY → 4H → 1H → 15-MIN → 5-MIN 🔥
The close was **24,206.90**, up **244.10 points (+1.02%)** after recovering sharply from Thursday's panic sell-off. Buyers defended the **24,120** region and reclaimed the psychologically important **24,200** level.
Monday will decide whether Friday's move was genuine accumulation or merely a relief rally. Markets have a habit of rewarding patience while charging interest to impatience.
---
# 🚨 FINAL VERDICT
## Market Bias
🟢 **Bullish above 24,200**
🟡 **Range between 24,150 - 24,228**
🔴 **Bearish below 24,120**
Friday's recovery erased a large portion of Thursday's fall, but NIFTY still remains below the stronger resistance cluster around **24,300-24,400**.
A sustained move above **24,228** can trigger further short covering.
---
# 📊 PREVIOUS SESSION OHLC (10 July)
**Open:** 24,124.70
**High:** 24,228.45
**Low:** 24,120.35
**Close:** **24,206.90**
---
# 🏛️ INSTITUTIONAL SUMMARY
### Market Regime
🟡 Recovery inside broader consolidation
### Control
🟢 Buyers while above **24,120**
### Immediate Resistance
24,228
24,300
24,398
### Immediate Support
24,180
24,150
24,120
### Trader Action
Trade only after confirmation beyond Friday's range.
---
# 📊 PROBABILITY MATRIX
🟢 Bullish : **45%**
🟡 Range-bound : **35%**
🔴 Bearish : **20%**
---
# 🟢 HIGH PROBABILITY CE TRADE
## Setup
Recovery Breakout
### Entry Trigger
15-minute close above **24,228**
### Confirmation
• 5-minute retest holds
• RSI > 58
• Good volume
### Stop Loss
24,175
### Targets
🎯 T1 : 24,300
🎯 T2 : 24,398
🎯 T3 : 24,460
### Invalidation
15-minute close below **24,180**
---
### Intraday Fibonacci (10 July Range)
High = **24,228.45**
Low = **24,120.35**
23.6% = **24,145.85**
38.2% = **24,161.65**
50.0% = **24,174.40**
61.8% = **24,187.20**
78.6% = **24,205.30**
---
### Institutional Logic
Friday closed near the **78.6% retracement**, showing buyers regained control after Thursday's sharp decline.
Acceptance above **24,228** confirms absorption of overhead supply and can extend the rally toward **24,300-24,400**.
---
# 🔴 HIGH PROBABILITY PE TRADE
## Setup
Failure below Friday support
### Entry Trigger
15-minute close below **24,120**
### Confirmation
• Failed retest
• RSI below 45
• Volume expansion
### Stop Loss
24,175
### Targets
🎯 T1 : 24,050
🎯 T2 : 24,000
🎯 T3 : 23,900
### Invalidation
15-minute close above **24,180**
---
### Institutional Logic
If Friday's recovery was merely short covering, losing **24,120** could invite fresh institutional selling toward **24,000**.
---
# 📊 DAILY CHART FIBONACCI
### Swing High
**26,354.05**
### Swing Low
**22,184.45**
| Level | Price |
| ----- | --------: |
| 23.6% | 22,764.45 |
| 38.2% | 23,116.65 |
| 50.0% | 23,401.35 |
| 61.8% | 23,777.25 |
| 65% | 23,894.70 |
| 78.6% | 24,091.30 |
| 100% | 26,354.05 |
### Institutional Interpretation
NIFTY has reclaimed and closed comfortably above the important **78.6% Fibonacci level (24,091)**. This level now becomes the first major support. Sustaining above it keeps the broader bullish recovery intact, while a breakout above **24,228** may accelerate the move toward **24,400** and eventually **24,600**.
---
# 📊 OPTION CHAIN VIEW (14 JULY EXPIRY)
### ATM Strike
**24,200**
### Major Call Writing
24,300
24,400
### Major Put Writing
24,000
24,100
### Max Pain
Approximately **24,200**
### Interpretation
Option writers expect consolidation around **24,200**, but clearing **24,300** can force short covering from call writers.
---
# 📈 4H ANALYSIS
Trend
🟢 Constructive Recovery
Structure
Higher low maintained
Support
24,090
23,900
Resistance
24,300
24,400
Momentum
Improving
---
# 📉 1H ANALYSIS
Trend
Neutral to Bullish
Support
24,150
24,120
Resistance
24,228
24,300
Momentum
Positive
---
# ⏱️ 15-MINUTE ANALYSIS
### Immediate Resistance
24,228
24,300
24,398
### Immediate Support
24,180
24,150
24,120
### No Trade Zone
24,180 to 24,228
---
# ⚡ 5-MIN EXECUTION PLAN
## CE Buyers
✔ Buy above **24,228**
✔ Wait for retest
✔ Targets
24,300
24,398
24,460
---
## PE Buyers
✔ Sell below **24,120**
✔ Wait for failed retest
✔ Targets
24,050
24,000
23,900
---
# 📊 VOLUME & SENTIMENT
Previous Session
Strong recovery candle
Market Sentiment
🟢 Cautiously Bullish
Institutional Bias
Buy on confirmed breakout
---
# 🎯 TRADING DAY SCENARIOS
## 🟢 Scenario 1
Bullish Breakout
Probability
45%
Trigger
Above **24,228**
Targets
24,300 → 24,398 → 24,460
---
## 🟡 Scenario 2
Range-bound
Probability
35%
Range
24,150-24,228
Avoid aggressive option buying.
---
## 🔴 Scenario 3
Bearish Breakdown
Probability
20%
Trigger
Below **24,120**
Targets
24,050 → 24,000 → 23,900
---
# 🚫 INVALIDATION LEVELS
Bullish View Invalid
Below **24,120**
Bearish View Invalid
Above **24,228**
---
# 🔥 KEY TRADER NOTE
### Key Range
**24,120 - 24,228**
Above **24,228**, CE momentum can expand toward **24,300** and **24,398**.
Below **24,120**, PE momentum can extend toward **24,000**.
Trade confirmation, not anticipation. The market rarely pays people for guessing correctly, but it routinely invoices those who guess too early.
---
**Educational analysis only. Not financial advice.**
#Nifty50 #TechnicalAnalysis #PriceAction #OptionTrading #StockMarketIndia #IntradayTrading #SwingTrading #BankNifty #Fibonacci #SupportAndResistance #Options #NSE #TradingStrategy #MarketStructure #VolumeAnalysis #SmartMoney #TechnicalCharts #MomentumTrading #IndianStockMarket #RiskManagement
Long 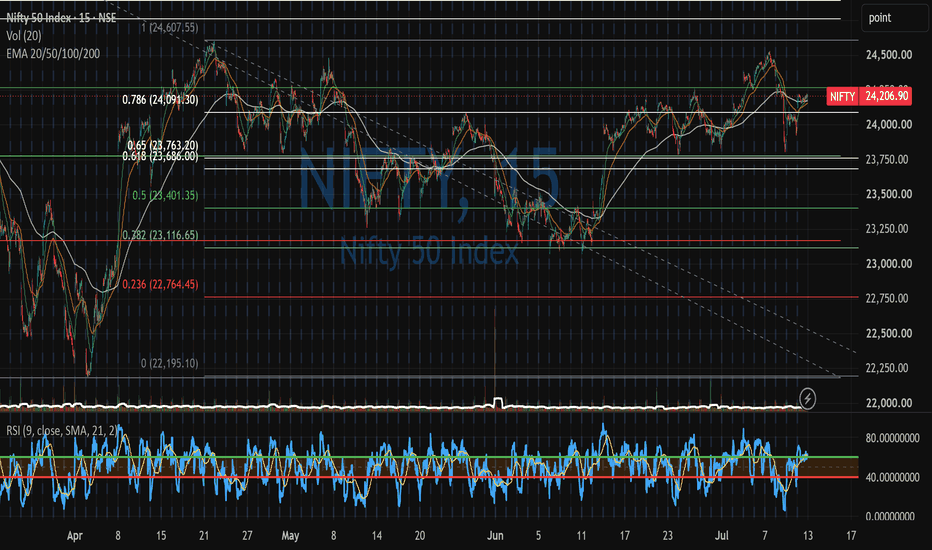
How to Choose the Best Strike Price in Options📊 Choosing the Right Strike Price 📊
Many traders correctly predict the market direction but still lose money in options.
⚠ Why?
Because direction alone is not enough.
You also need the **right strike price**.
A good trade setup with the wrong strike can still perform poorly.
That is why strike selection matters.
------------------------------------------
📌 First Understand 3 Main Types
👉 ITM (In The Money)
These options already have intrinsic value.
They usually have:
• Higher premium
• Better stability
• Lower decay pressure than OTM
• More reliable movement
👉 ATM (At The Money)
These are the strikes closest to the current price.
They usually have:
• Good liquidity
• Balanced premium
• Fast reaction to underlying movement
• Strong popularity for intraday trades
👉 OTM (Out of The Money)
These look cheaper, but they are more risky.
They usually have:
• Lower premium
• Higher decay risk
• Lower probability
• Need stronger move
• Can become worthless quickly
------------------------------------------
📌 The Biggest Beginner Mistake
Many traders choose options like this:
“Premium is cheap, so I’ll buy this one.”
That is dangerous.
A cheap option is not always a good option.
A far OTM strike may look attractive, but if momentum does not come quickly, the premium can decay fast.
So, the goal is not to buy the cheapest strike.
The goal is to choose the most suitable strike for the setup.
------------------------------------------
📌 Which Strike Is Better?
There is no one best strike for every trade.
It depends on:
• Market direction
• Momentum
• Expiry proximity
• Liquidity
• Trading style
• Risk tolerance
But in many intraday situations:
**ATM and slightly ITM are usually better choices than far OTM.**
------------------------------------------
📌 When to Choose ATM
ATM is often useful when:
• You are doing intraday trading
• Momentum is expected
• Breakout or breakdown is likely
• You want good liquidity
• You want balanced risk-reward
ATM options move quickly and are easier to trade.
That is why many traders prefer them.
------------------------------------------
📌 When to Choose Slightly ITM
Slightly ITM can be better when:
• You want more stable premium behaviour
• You want less decay pressure
• Direction is clear
• You want a relatively safer strike
• You want better quality over cheap price
ITM premium may be higher, but it often behaves better.
------------------------------------------
📌 When to Choose OTM
OTM can work when:
• Strong momentum is expected
• You are taking an aggressive trade
• You can handle higher risk
• The move is expected to be fast
But OTM should not be bought casually.
Without momentum, OTM options decay quickly.
------------------------------------------
📌 Best Rule for Beginners
If you are confused, choose:
**ATM or slightly ITM**
These are usually better than far OTM lottery-style trades.
Especially for:
• Intraday trading
• Expiry trading
• Momentum setups
• Breakout trades
• VWAP-based setups
------------------------------------------
📌 What Else to Check?
Before choosing a strike, check:
✅ Liquidity
✅ Volume
✅ Bid-ask spread
✅ Premium behaviour
✅ Expiry timing
✅ Expected move size
✅ Market condition
✅ Your risk tolerance
A good strike should move properly and allow easy entry/exit.
------------------------------------------
📌 Simple Example
If Nifty is trading at 24,500 and you are bullish:
24,400 CE = ITM
24,500 CE = ATM
24,600 CE = OTM
If you want a balanced intraday trade, ATM may be best.
If you want safer premium behaviour, slightly ITM may be better.
If you expect a strong fast move, slightly OTM can work.
But buying very far OTM without momentum is risky.
------------------------------------------
📌 Finally Important Point to Note !
Strike selection is not about buying the cheapest premium.
It is about choosing the strike that best matches your setup.
Remember:
👉 ATM = Balanced
👉 Slightly ITM = More stability
👉 OTM = More aggressive
⚠ Cheap premium ≠ Good trade
Choose quality over excitement.
Because in options trading, the right strike can make a big difference.
------------------------------------------
Educational Purpose Only.
Education 
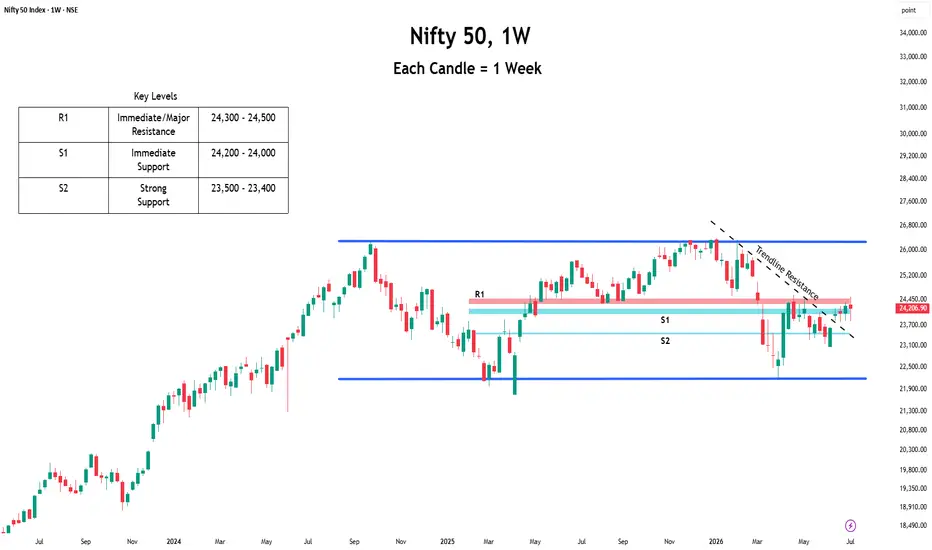
Nifty 50 Is Running Out of Room: A Decisive Move Looks NearThe Indian stock market took a breather last week.
After four consecutive weeks of gains, the Nifty 50 slipped 0.26% to close at 24,206, ending its winning streak.
At the same time, India VIX edged up 3.86% to 12.25, reflecting slightly higher uncertainty amid renewed geopolitical tensions in the Middle East.
But despite the small decline, the bigger picture hasn't changed much.
Here's what the chart is telling us.
For the past few weeks, Nifty has been trading within a narrow range, with neither buyers nor sellers taking full control.
This suggests the market is waiting for a fresh trigger before making its next meaningful move.
The first hurdle for the bulls lies in the 24,300-24,500 zone.
A decisive move above this range could improve sentiment and pave the way for further upside.
On the downside, 24,200-24,000 remains the immediate support area.
If this zone fails to hold, the next major support comes in around 23,500-23,400, where buyers could once again become active.
What could move the market this week?
📌 Q1 FY27 Earnings: Results from nearly 100 companies, including HCL Tech, Wipro, Groww, and Jio Financial Services, could drive stock-specific and broader market sentiment.
📌 Middle East Tensions: Any fresh developments could influence crude oil prices, global markets, and investor sentiment.What should traders do?
Right now, the market is trading in a narrow range, and chasing every move may not be the best strategy.
What should traders do?
Patience could be your biggest advantage.
Wait for a clear breakout or breakdown, then trade in the direction of the move while following proper risk management. Doji Formation (Indecision Candles) is the New TrendFor the past four weeks (3rd week of June to 2nd week of July), Nifty 50 NSE:NIFTY has shown extreme range-bound volatility. The volatility imprinted each week has built a culture of forming "Doji (s)" or indecision candles. In one instance, there is also evidence of a green spinning top. Even the green spinning top is considered an indecision candle. Thus, for the past four weeks, traders have been through a roller-coaster ride.
The article aims to understand the present culture of how the Nifty 50 Index is being traded. Specifically, it highlights the way doji candles are omnipresent in the existing market conditions. Lastly, it is evident that positional trading is not viable in the present market conditions, but opting for pure intraday trading is less risky.
What is Doji?
Doji is a Japanese term that means ‘Indecisiveness’ or ‘the same thing.’ The single candlestick pattern ‘Doji’ is defined as the price behavior for a particular session where the closing price has been the same as or near the opening price. Additionally, Doji shows evidence of large wicks (or candle shadows). It means that the price has shown large fluctuations during the trading session, but ultimately it closed near or at the same zone as the opening price. In the case of Doji, there is hardly any evidence of the body. Also, the presence of longer shadows confuses traders. Thus, the pattern is infamously identified as an indecisive session.
Formation of Long-Legged Doji
It is observed that Nifty 50 has consistently formed long-legged doji for the consecutive four weeks (except one green spinning top, which can also be considered as an indecisive session). Long-Legged Doji is also considered the perfect indecisive candlestick pattern. The open and close prices are equal. Also, the body stays perfectly in the middle of the upper and lower shadows. In a Gravestone Doji, though the session is indecisive, sellers still dominate. In the case of a Long-Legged Doji, both bulls and bears fail.
Impact of Consecutive Doji formation on Nifty 50 Trading
In the weekly sessions, holding on to directional trading has been extremely difficult. From a trader's perspective, any traders who have held their directional position speculating the continuation of the trend (either bullish or bearish) have been brutally punished by the market. The moment traders have speculated a continuation of the trend is the moment the market has changed its direction. The extreme range-bound volatility has been beneficial only for the intraday trend traders and the non-directional traders.
Is Doji a continuation pattern or a trend reversal pattern?
It is observed that after the completion of the indecisive session, most of the traders lose capital or end up at break-even. Furthermore, it directs the traders to speculate on the next trading session. The biggest disadvantage of working in a Doji session is that it shows the possibility of both trend continuation and trend reversal. But nothing happens. In this case, technical analysis or speculation does not work. Here comes the significance of philosophy. Traders need to nurture the philosophy that the future is unknown. A Doji session even escalates the uncertainty of future prices. It is unfortunate but true that technical analysis fails here. A short philosophy for traders to mitigate future price speculation after a Doji session is as follows:
“Be comfortable not knowing”
What's Next in the Nifty 50 Price Action?
Even if the weekly sessions have been extremely volatile and range-bound, there is hope. For the past four weeks, it can be observed that the price is slowly forming a high-highs and lower-lows structure. At least, the closing of each week is above the closing of the previous week. Also, Nifty 50 has formed a strong support zone or neckline at (23900 - 23700). Price sustaining above the zone of (23900 - 23700) could be considered bullish. Also, we have to keep an eye on the closing of the upcoming weeks. If the closings are above the previous week's closing, then it could be a relief for the bulls.
Disclaimer:
(i) The post is purely based on technical and chart analysis. The author has not studied the fundamentals. Thus, any fundamental or macroeconomic event can disrupt chart analysis.
(ii) The author has no intention to promote buy or sell recommendations.
(iii) The post is only for educational purposes.
(iv) Novice traders should stick to the cash segment for swing trading instead of F&O. This post has no intention to promote F&O trading.
(vi) Please be mindful during trading and investment decisions. Be Responsible.
Happy Trading! Nifty - Weekly review July 13 to July 17The price took support from the 23800 zone, and now it is testing the 24200 zone. Sustaining the 24180 - 24220 zone is important to move up further.
Nearby support is at the 23800 zone.
Nearby resistance is at the 24500 zone.
As per the daily chart, the important crucial zone is at the 24500 zone.
Buy above 24220 with the stop loss of 24160 for the targets 242260, 24300, 24360, 24420, 24480, 24520 and 24580.
Sell below 24080 with the stop loss of 24140 for the targets 24040, 24000, 23940, 23880, 23820 and 23780.
Always do your analysis before taking any trade.
The Elliptical Consolidation [Weekly Analysis: 13 - 17 July, 26]The Nifty 50 Index NSE:NIFTY has been in a range-bound consolidation since the 12th of June, 2026. To extend the range of analysis, it can be observed that the market is in the same range since the 08th of April, 2026. Thus, for the past four months, the Nifty 50 index has been in a sideways consolidation. It has been a painful journey for both the investors as well as the traders.
Contracting the range of price action, if we observe the range-bound consolidation since the 12th of June till now, then an "Elliptical Consolidation" is well evident. From another point of view, it can also be observed that the price structure is forming a probable structure of a "Head-&-Shoulder Pattern." The neckline of the probable H&S pattern is in the zone of (23850 - 23800). There is also strong resistance in the zone of (24600 - 24550).
Evidence of an Outlier Price Action (not part of the Elliptical Consolidation):
If we consider the price action in the date range (03rd July - 08th July, 2026), the structure is formed outside the mathematical boundaries of the Elliptical Consolidation Zone. This outlier can be considered as a "typical bull trap" price structure. The price action gave hope to the bulls to build a long-term position. However, it was only a deception. On the contrary, irrespective of the evidence of a bull trap, the bears have also failed to push down the market to extreme levels. The bulls are offering solid support to keep the market cushioned from bearishness.
🟡 The Zone of Confusion: (24300 - 24100).
Technically, in the range-bound market, nobody wins. In the present scenario, there is an equal probability of a bearish breakdown as well as a bullish breakout. The decision of the future trend will be made in the zone of confusion (24300 - 24100). There is a high probability that the price might be extremely volatile in the zone of confusion. Thus, we have to be patient enough to wait for either a breakdown or a breakout.
🟢 Bullish Scenario
A confident bullish move might emerge if the price properly sustains above the level of 24300. The probable bullish targets above the level of 24300 would be - 24400, 24500, 24600, and 24700.
🔴 Bearish Scenario
A weak bearish scenario is expected if the price breaks down below the level of 24100. The first bearish target below 24100 would be 24000. The price would receive good support at 24000. Next, if the price decisively breaks down below 24000, then the probable bearish targets would be - 23900, 23800, 23700, and 23600.
⏺ Range of Consolidation (ROC): (24300 - 23800).
A proper breakout above 24300 would trigger bullish hope. But a proper breakdown below 23800 would trigger bearish sentiment.
● Event
No high-impact event this week. No holidays this week. We have only two expiries to deal with. Geopolitical issues are omnipresent.
● Intraday Bias
Establish intraday bias with respect to the opening price. If the price sustains above the opening price, then don't think of shorting. Look for bullish trades only. On the contrary, if the price sustains below the opening price, then don't think of going long. Look for bearish trades in that case.
● Disclaimer + End Note
- All the analyses would fail in the case of a major gap up, gap down, or price structure anomaly. Thus, practice PRAGMATISM in the live session.
- Trade only if there is a set-up. Remember, not trading is an extension of the trading activity.
- Mark your points. Trade your points. Price is GOD. Anything can happen in the markets. Thus, trade what you see, not what you believe.
- Always PRACTICE RISK MANAGEMENT. Always PROTECT YOUR CAPITAL. Be RESPONSIBLE.
- Be Strategic. Be Courageous. Be Patient. Be Wise.
- Every day is a new day. Thus, do not carry the baggage of past successes or failures. Leave the gardens of winning and losing. Establish yourself in equanimity. Always think from a new perspective.
- Let the joy of trading drive your effectiveness, not greed or fear. Believe in Possibilities.
Happy Trading! Education
Nifty MidSmallCap 400 Index📈 Nifty MidSmallCap 400 Index (1W) – Breakout Signals Broader Market Strength 🚀
The Nifty MidSmallCap 400 Index has finally broken above a major resistance zone after months of consolidation, reflecting renewed strength across the broader market. This breakout suggests that midcap and smallcap stocks could continue to outperform if the momentum sustains. 👀
🔍 Technical Highlights
✅ Breakout Above Key Resistance:
The index has moved decisively above the 21,185 resistance zone, which had capped previous rallies. This breakout marks a significant shift in the medium-term trend.
✅ Strong Bullish Market Structure:
The index continues to print higher highs and higher lows, confirming that buyers remain in control and the broader market sentiment is improving.
✅ Broad-Based Participation:
A breakout in the MidSmallCap 400 Index often indicates that strength is expanding beyond large-cap stocks, with increasing participation from midcap and smallcap sectors.
🎯 Measured Move Projection:
If the index sustains above 21,185 on a weekly closing basis, the measured move projects a potential advance towards the 26,500 zone, representing an upside of approximately 24–25% from the breakout level.
⚠️ What Investors & Traders Should Watch
🔹 A weekly close above 21,185 would strengthen the breakout confirmation.
🔹 Any healthy pullback that successfully retests 21,185 as support would reinforce the bullish structure.
🔹 While the trend remains positive, avoid chasing overextended moves. Fresh entries are often more favorable after consolidation or a successful retest.
📌 Key Levels
🟢 Breakout Level: 21,185
🛡️ Major Support: 20,500 followed by 19,800
🎯 Potential Target: 26,500
💡 Final Thoughts
The Nifty MidSmallCap 400 Index has entered a technically strong phase after clearing a key resistance zone. A sustained move above 21,185 could pave the way for a fresh leg higher, supporting bullish setups across the broader market. As always, maintaining disciplined risk management and waiting for confirmation remain essential.
📢 Do you believe this breakout marks the beginning of the next broad-based rally in midcaps and smallcaps, or will the index revisit the breakout zone before moving higher? Share your views below! 👇  Long
Long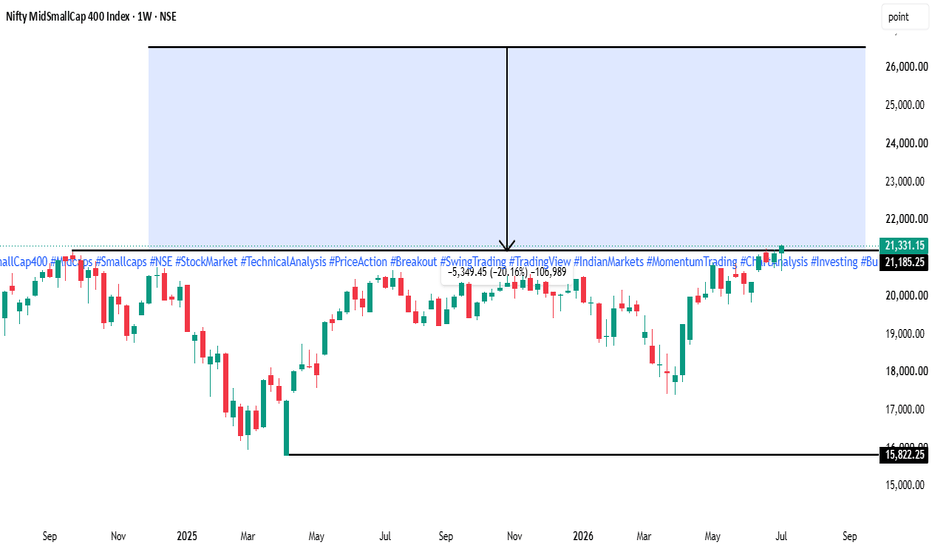
SENSEX Analysis [For 13.07.2026: Monday]Probable Scenario Analysis of SENSEX for the 13th of July, 2026. The day is Monday.
🟢 Bullish Scenario
Be bullish if the price sustains above 77750 for at least 30 minutes, with a sustained bullish candle. The first bullish target would be 78000. There will be strong resistance at 78000. Next, there is an unfilled GAP at 78079. The price might fill the GAP. If the price sustains above 78000 as well as 78079, then the next probable bullish targets would be - 78250 and 78500.
🔴 Bearish Scenario
Be bearish if the price decisively breaks down below 77250. In this case, the first bearish target would be 77000. There will be strong support at 77000. Next, there are multiple unfilled GAPs below 77000 - 76827 and 76514. If the price breaks down below 77000, then the probable bearish targets would be - 76750 and 76500.
🟡 No Trading Zone (NTZ): (77750 - 77250).
⏺ Range of Consolidation (ROC): (78000 - 77000).
Here, 77500 is the median of the ROC. The median works like an intraday sentiment evaluator. The price trading above the median would offer bullish sentiment, while the price trading below the median would trigger bearish sentiment within the ROC.
● Event
No high-impact event this week. No holidays this week. We have only two expiries to deal with. Geopolitical issues are omnipresent.
● Intraday Bias
Establish intraday bias with respect to the opening price. If the price sustains above the opening price, then don't think of shorting. Look for bullish trades only. On the contrary, if the price sustains below the opening price, then don't think of going long. Look for bearish trades in that case.
● Disclaimer + End Note
- All the analyses would fail in the case of a major gap up, gap down, or price structure anomaly. Thus, practice PRAGMATISM in the live session.
- Trade only if there is a set-up. Remember, not trading is an extension of the trading activity.
- Mark your points. Trade your points. Price is GOD. Anything can happen in the markets. Thus, trade what you see, not what you believe.
- Always PRACTICE RISK MANAGEMENT. Always PROTECT YOUR CAPITAL. Be RESPONSIBLE.
- Be Strategic. Be Courageous. Be Patient. Be Wise.
- Every day is a new day. Thus, do not carry the baggage of past successes or failures. Leave the gardens of winning and losing. Establish yourself in equanimity. Always think from a new perspective.
- Let the joy of trading drive your effectiveness, not greed or fear. Believe in Possibilities.
Happy Trading! BANKNIFTY DAILY/ Short Range Level Analysis for 13th Jul 2026🔕 SGMN SplD BULLISH Above => 58262.
🔕 SGMN SplD Bearish BELOW => 57844.
Mentioned analysis based on 2 consecutive candle close in 15 min Time Frame.
━━━━━🟥🟧🟨🟩🟦🟪⬛━━━━━
💥Level Interpretation / description:
✍🏻L#1: If the candle crossed & stays above the “Buy Gen”, it is treated / considered as Bullish bias. Cfm=> Confirmation.
L#2: Possibility / Probability of REVERSAL near 🔕RL/TF1 & 🔔RL/TF2
L#3: If the candle stays above “Sell Gen” but below “Buy Gen”, it is treated / considered as Sidewise. Aggressive Traders can take Long position near “Sell Gen” either retesting or crossed from Below & vice-versa i.e. can take Short position near “Buy Gen” either retesting or crossed downward from Above.
L#4: If the candle crossed & stays below the “Sell Gen”, it is treated / considered a Bearish bias.
L#5: Possibility / Probability of REVERSAL near 🔕RL/TF1 & 🔔RL/TF2
HZB (Buy side) & HZS (Sell side) => Hurdle Zone,
✍🏻 *** Specialty of “HZB#1, HZB#2 HZS#1 & HZS#2” is Sidewise (behaviour in Nature)
Rest Plotted and Mentioned on Chart
Color code Used:
Green, BLUE =. Positive bias.
Safron, RED =. Negative bias.
RED in Between Green means Trend Finder / Momentum Change
/ CYCLE Change and Vice Versa.
Notice One thing: HOW LEVELS are Working.
Use any Momentum Indicator / Oscillator or as you "USED to" to Take entry.
━━━━━🟥🟧🟨🟩🟦🟪⬛━━━━━
⚠️ DISCLAIMER:
The information, views, and ideas shared here are purely for educational and informational purposes only. They are not intended as investment advice or a recommendation to buy, sell, or hold any financial instruments. I am not a SEBI-registered financial adviser.
Trading and investing in the stock market involves risk, and you should do your own research and analysis. You are solely responsible for any decisions made based on this research.
"🔔As HARD EARNED MONEY IS YOUR's, So DECISION SHOULD HAVE TO BE YOUR's".
━━━━━🟥🟧🟨🟩🟦🟪⬛━━━━━
❇️ Follow notification about periodical View
💥 Do Comment for Stock WEEKLY Level Analysis.🚀
📊 Do you agree with this view?
✈️ HIT THE PLANE ICON if this technical observation resonates with you. It will Motivate me.
━━━━━🟥🟧🟨🟩🟦🟪⬛━━━━━
💡 If You LOOKING any CHART & want for Level and ANALYZE?
Share your desired stock names in the comments below! I will try to analyze the chart Levels, patterns and share my technical view (so far my Knowledge).
If Viewers think It can identify meaningful setups. Looking forward to hearing from all of you — let's keep this discussion going and help each other make better trading decisions.
___________🔕^^^⚫⚪^🙏🏼🙏🏼🙏🏼^⚪⚫^^^🔔___________ BANKNIFTY WEEKLY/ Short Range Level Analysis: 13th-17th Jul 2026🔔SGMN SplWP BULLISH Above => 58591.
🔔 SGMN SplWP Bearish BELOW => 57396.
Mentioned analysis based on 2 consecutive candle close in 15 min Time Frame.
━━━━━🟥🟧🟨🟩🟦🟪⬛━━━━━
💥Level Interpretation / description:
✍🏻L#1: If the candle crossed & stays above the “Buy Gen”, it is treated / considered as Bullish bias. Cfm=> Confirmation.
L#2: Possibility / Probability of REVERSAL near 🔕RL/TF1 & 🔔RL/TF2
L#3: If the candle stays above “Sell Gen” but below “Buy Gen”, it is treated / considered as Sidewise. Aggressive Traders can take Long position near “Sell Gen” either retesting or crossed from Below & vice-versa i.e. can take Short position near “Buy Gen” either retesting or crossed downward from Above.
L#4: If the candle crossed & stays below the “Sell Gen”, it is treated / considered a Bearish bias.
L#5: Possibility / Probability of REVERSAL near 🔕RL/TF1 & 🔔RL/TF2
HZB (Buy side) & HZS (Sell side) => Hurdle Zone,
✍🏻 *** Specialty of “HZB#1, HZB#2 HZS#1 & HZS#2” is Sidewise (behaviour in Nature)
Rest Plotted and Mentioned on Chart
Color code Used:
Green, BLUE =. Positive bias.
Safron, RED =. Negative bias.
RED in Between Green means Trend Finder / Momentum Change
/ CYCLE Change and Vice Versa.
Notice One thing: HOW LEVELS are Working.
Use any Momentum Indicator / Oscillator or as you "USED to" to Take entry.
━━━━━🟥🟧🟨🟩🟦🟪⬛━━━━━
⚠️ DISCLAIMER:
The information, views, and ideas shared here are purely for educational and informational purposes only. They are not intended as investment advice or a recommendation to buy, sell, or hold any financial instruments. I am not a SEBI-registered financial adviser.
Trading and investing in the stock market involves risk, and you should do your own research and analysis. You are solely responsible for any decisions made based on this research.
"🔔As HARD EARNED MONEY IS YOUR's, So DECISION SHOULD HAVE TO BE YOUR's".
━━━━━🟥🟧🟨🟩🟦🟪⬛━━━━━
❇️ Follow notification about periodical View
💥 Do Comment for Stock WEEKLY Level Analysis.🚀
📊 Do you agree with this view?
✈️ HIT THE PLANE ICON if this technical observation resonates with you. It will Motivate me.
━━━━━🟥🟧🟨🟩🟦🟪⬛━━━━━
💡 If You LOOKING any CHART & want for Level and ANALYZE?
Share your desired stock names in the comments below! I will try to analyze the chart Levels, patterns and share my technical view (so far my Knowledge).
If Viewers think It can identify meaningful setups. Looking forward to hearing from all of you — let's keep this discussion going and help each other make better trading decisions.
___________🔕^^^⚫⚪^🙏🏼🙏🏼🙏🏼^⚪⚫^^^🔔___________