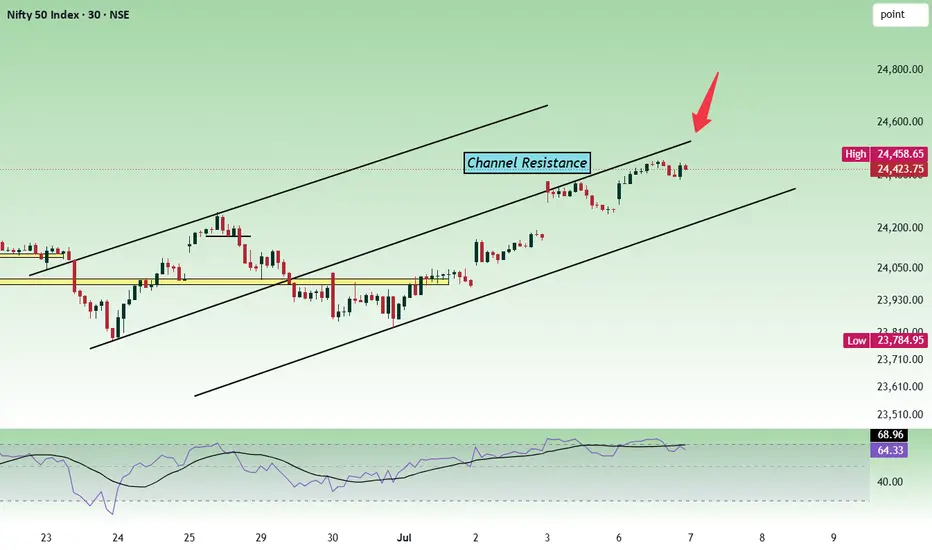
Nifty50 View for Tomorrow | Tuesday, 7 July📊 NIFTY – 2H Chart Analysis
• Price is trading just below the 24,500–24,600 supply zone.
• Rejection has started, but 24,370 is the key level to watch.
• As long as price holds above 24,370, the structure remains stable.
• A decisive break below 24,370 can trigger fresh selling pressure.
• Until then, avoid aggressive trades inside this zone.
🎯 Wait for confirmation. React to price, don't predict it.  Short
Short
NIFTY WEEKLY EXP. Level Analysis for 07th Jul 2026🔕 SGMN SplD BULLISH Above => 24489.
🔕 SGMN SplD Bearish BELOW => 24375.
Mentioned analysis based on 2 consecutive candle close in 15 min Time Frame.
━━━━━🟥🟧🟨🟩🟦🟪⬛━━━━━
💥Level Interpretation / description:
✍🏻L#1: If the candle crossed & stays above the “Buy Gen”, it is treated / considered as Bullish bias. Cfm=> Confirmation.
L#2: Possibility / Probability of REVERSAL near 🔕RL/TF1 & 🔔RL/TF2
L#3: If the candle stays above “Sell Gen” but below “Buy Gen”, it is treated / considered as Sidewise. Aggressive Traders can take Long position near “Sell Gen” either retesting or crossed from Below & vice-versa i.e. can take Short position near “Buy Gen” either retesting or crossed downward from Above.
L#4: If the candle crossed & stays below the “Sell Gen”, it is treated / considered a Bearish bias.
L#5: Possibility / Probability of REVERSAL near 🔕RL/TF1 & 🔔RL/TF2
HZB (Buy side) & HZS (Sell side) => Hurdle Zone,
✍🏻 *** Specialty of “HZB#1, HZB#2 HZS#1 & HZS#2” is Sidewise (behaviour in Nature)
Rest Plotted and Mentioned on Chart
Color code Used:
Green, BLUE =. Positive bias.
Safron, RED =. Negative bias.
RED in Between Green means Trend Finder / Momentum Change
/ CYCLE Change and Vice Versa.
Notice One thing: HOW LEVELS are Working.
Use any Momentum Indicator / Oscillator or as you "USED to" to Take entry.
━━━━━🟥🟧🟨🟩🟦🟪⬛━━━━━
⚠️ DISCLAIMER:
The information, views, and ideas shared here are purely for educational and informational purposes only. They are not intended as investment advice or a recommendation to buy, sell, or hold any financial instruments. I am not a SEBI-registered financial adviser.
Trading and investing in the stock market involves risk, and you should do your own research and analysis. You are solely responsible for any decisions made based on this research.
"🔔As HARD EARNED MONEY IS YOUR's, So DECISION SHOULD HAVE TO BE YOUR's".
━━━━━🟥🟧🟨🟩🟦🟪⬛━━━━━
❇️ Follow notification about periodical View
💥 Do Comment for Stock WEEKLY Level Analysis.🚀
📊 Do you agree with this view?
✈️ HIT THE PLANE ICON if this technical observation resonates with you. It will Motivate me.
━━━━━🟥🟧🟨🟩🟦🟪⬛━━━━━
💡 If You LOOKING any CHART & want for Level and ANALYZE?
Share your desired stock names in the comments below! I will try to analyze the chart Levels, patterns and share my technical view (so far my Knowledge).
If Viewers think It can identify meaningful setups. Looking forward to hearing from all of you — let's keep this discussion going and help each other make better trading decisions.
___________🔕^^^⚫⚪^🙏🏼🙏🏼🙏🏼^⚪⚫^^^🔔___________ Long 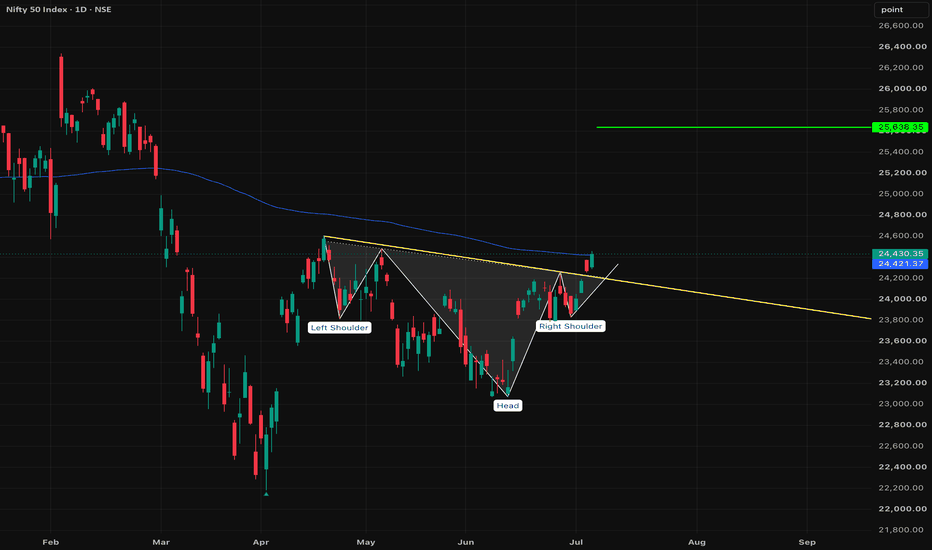
7 Rules Every Trader Must Follow📊 7 Rules Every Trader Must Follow 📊
Trading is not only about finding entries.
Many beginners think trading success depends only on:
---> Best indicator
---> Perfect strategy
---> Accurate entry
---> Big target
---> Fast profit
But in reality, long-term trading success depends more on rules, discipline, risk control, and emotional stability.
A trader without rules is like a driver without brakes.
You may go fast for some time, but one wrong move can damage everything.
These 7 rules are important for every trader, especially beginners and basic knowledge traders.
_______________________________
Rule 1: Protect Your Capital First
The first job of a trader is not to make profit.
The first job is to protect capital.
Profit comes only when capital survives.
Many beginners focus only on how much they can make, but experienced traders first think about how much they can lose.
Before every trade, ask:
“If this trade goes wrong, how much will I lose?”
If the loss is too big, skip the trade or reduce quantity.
Trading is a game of probability. Even good setups can fail. So your capital should be protected enough to take the next valid opportunity.
Simple Lesson
Do not risk your entire confidence on one trade.
Small controlled losses are part of trading. Big uncontrolled losses are dangerous.
_______________________________
Rule 2: Always Trade With a Plan
Never enter a trade only because the candle is moving fast.
Before entering, your trade plan should be clear:
---> Entry level
---> Stop-loss level
---> Target level
---> Reason for entry
---> Risk-reward
---> Quantity
---> Invalidation point
A trade without a plan usually becomes an emotional trade.
If you enter randomly, you will also exit randomly.
Professional traders do not take trades because they “feel” the market will move.
They take trades because their setup is valid.
Simple Lesson
If you cannot explain why you are entering, you should not enter.
_______________________________
Rule 3: Never Trade Without Stop-Loss
Stop-loss is not your enemy.
Stop-loss is your protection.
Many traders avoid stop-loss because they fear loss. But the truth is, not using stop-loss can turn one small mistake into a big disaster.
A stop-loss tells you:
“My trade idea is wrong here.”
It should be based on logic, not emotion.
Good stop-loss can be placed near:
---> Swing high or swing low
---> Support or resistance invalidation
---> VWAP rejection level
---> Breakout or breakdown failure point
---> Previous candle high/low
---> Structure break level
Do not keep stop-loss too tight just because you want to lose less.
And do not keep it too wide just because you do not want it to hit.
Simple Lesson
Stop-loss should be logical, not random.
_______________________________
Rule 4: Follow Risk Management Strictly
Risk management decides how long you survive in the market.
Even a good trader can have losing trades.
The difference is that disciplined traders keep losses small.
Beginners often make this mistake:
They take small profits but allow big losses.
This destroys the account slowly.
A better rule:
Risk small, trade only quality setups, and never increase quantity emotionally.
For beginners, risking a small fixed percentage of capital per trade is safer.
---> If volatility is high, reduce quantity.
---> If stop-loss is wide, reduce quantity.
---> If confidence is low, reduce quantity or avoid trade.
Simple Lesson
Your quantity should be based on risk, not greed.
_______________________________
Rule 5: Do Not Overtrade
Overtrading is one of the biggest reasons traders lose money.
Many traders enter again and again because:
---> They are bored
---> They want to recover loss
---> They missed a move
---> They want daily profit
---> They see every candle as an opportunity
But not every candle is a trade.
The market gives many movements, but only a few good setups.
Overtrading leads to:
---> More brokerage
---> More emotional pressure
---> More mistakes
---> Poor decision-making
---> Revenge trades
---> Loss of discipline
A good trader knows when to trade and when to stay silent.
Simple Lesson
Sometimes, no trade is also a profitable decision.
_______________________________
Rule 6: Trade What You See, Not What You Hope
Many traders do not lose because they cannot read charts.
They lose because they refuse to accept what the chart is showing.
Example:
Market is making lower highs and lower lows, but the trader keeps buying because he hopes for reversal.
Or market is bullish, but the trader keeps shorting because he thinks it has gone too high.
Hope is not a strategy.
The chart gives information through:
---> Structure
---> Trend
---> Volume
---> Candle close
---> Support and resistance
---> VWAP behavior
---> Breakout or rejection
Trade based on evidence, not imagination.
Simple Lesson
Do not force your view on the market. Follow what the market is actually doing.
_______________________________
Rule 7: Review Every Trade
If you do not review your trades, you will keep repeating the same mistakes.
A trading journal helps you improve.
After every trade, note:
---> Why did I enter?
---> Was the setup valid?
---> Did I follow my stop-loss?
---> Did I exit emotionally?
---> Was my quantity correct?
---> Did I chase the candle?
---> Did I trade according to plan?
---> What can I improve next time?
Many traders want better results, but they do not study their own behavior.
Your trading journal is like your personal coach.
It shows your strengths, weaknesses, habits, and emotional mistakes.
Simple Lesson
A trader who reviews improves. A trader who ignores repeats.
_______________________________
Bonus Rule: Control Emotions
Trading emotions are natural.
You may feel:
---> Fear after loss
---> Greed after profit
---> FOMO after missing a move
---> Anger after stop-loss
---> Overconfidence after winning streak
---> Revenge mindset after losing streak
The goal is not to remove emotions completely.
The goal is to not allow emotions to control your trades.
Whenever emotions are high, reduce quantity or stop trading for the day.
A calm mind makes better decisions.
_______________________________
Important
Trading success is not about winning every trade.
It is about following rules consistently.
A trader who protects capital, follows a plan, respects stop-loss, manages risk, avoids overtrading, accepts chart reality, and reviews trades will always have a better chance of long-term survival.
The market rewards discipline and punishes emotions. Education 
NIFTY Nears Key BreakoutHighlights
NIFTY continues to maintain a strong bullish structure, trading above its key short-, medium-, and long-term moving averages, reflecting sustained buying momentum.
The index is consolidating near its recent highs after a sharp recovery, indicating healthy profit booking rather than a reversal in trend.
Immediate resistance is placed around the recent swing high. A decisive breakout above this level could trigger the next leg of the rally and push the index towards fresh record highs.
On the downside, the recent consolidation zone acts as the first line of support, while stronger support lies near the previous breakout level. Holding these levels would keep the bullish outlook intact.
Momentum indicators remain positive, with improving market breadth and continued participation from heavyweight sectors such as banking, financial services, IT, and energy.
The ongoing earnings season, steady institutional inflows, supportive domestic macroeconomic conditions, and improving global sentiment continue to underpin the market's positive bias.
Takeaway
NIFTY's technical outlook remains firmly bullish as it trades close to a crucial breakout zone. A sustained move above the immediate resistance could accelerate buying momentum and extend the ongoing uptrend. As long as the index remains above its key support levels, any short-term pullback is likely to be viewed as a buying opportunity rather than a trend reversal.  Short
Short
NIFTY 50📈 Trend
Bias: Bullish
Price is making higher highs and higher lows.
Momentum remains positive as long as 24,300 holds.
🔴 Resistance Levels
R1: 24,430 – 24,450 (Immediate)
R2: 24,500
R3: 24,600
R4: 24,750
R5: 24,900 – 24,950
🟢 Support Levels
S1: 24,300
S2: 24,150
S3: 24,000 (Strong)
S4: 23,850
S5: 23,700 (Major Swing Support)
✅ Buy Above
24,450 (1H candle close)
🎯 Upside Targets
Target 1: 24,500
Target 2: 24,600
Target 3: 24,750
Target 4: 24,900–24,950
Stop Loss: 24,300
🔻 Sell Below
24,000 (1H candle close)
🎯 Downside Targets
Target 1: 23,850
Target 2: 23,700
Target 3: 23,500
Stop Loss: 24,150
🔑 Key Levels to Watch
24,450 → Breakout Trigger
24,500 → Strong Resistance
24,300 → Immediate Support
24,000 → Major Demand Zone
23,700 → Trend Reversal Level
📊 Trading Plan
Above 24,450: Stay bullish and buy on strength.
Between 24,300–24,450: Consolidation; wait for confirmation.
Below 24,300: Expect profit booking.
Below 24,000: Bears gain control, with downside toward 23,700–23,500. Bank Nifty📈 BANKNIFTY KEY LEVELS
CMP: 58,315
🟢 Resistance Levels
58,350 – Immediate Resistance
58,600 – Major Breakout Level
59,000 – Target 1
59,200 – Swing Target
59,500 – Extended Target
🔴 Support Levels
58,000 – Immediate Support
57,800 – Strong Demand Zone
57,500 – Major Support
57,200 – Trend Reversal Level
✅ Bullish Scenario
Buy Above: 58,350 (on a 1H candle close)
Targets:
🎯 58,600
🎯 59,000
🎯 59,200
🎯 59,500
Stop Loss: 58,000
🔻 Bearish Scenario
Sell Below: 57,800
Targets:
🎯 57,500
🎯 57,200
🎯 56,900
Stop Loss: 58,050
📊 Technical View
Trend: Bullish
Structure: Higher Highs & Higher Lows
Momentum: Positive above 58,350
Breakout Confirmation: Above 58,600
Bias: Buy on dips while price holds above 57,800 Short 
#NIFTY Intraday Support and Resistance Levels - 06/07/2026Nifty is expected to open with a gap-up bias around the 24270–24290 zone, indicating positive momentum at the start of the session. The index has recovered from lower levels and is trading above immediate support, but traders should watch the nearby resistance zone for confirmation before adding fresh long positions.
The immediate resistance lies at 24450–24500. A sustained breakout above this zone can trigger fresh buying momentum towards 24650, 24700, and 24750+ levels. Until then, the 24250–24300 zone remains a favorable buy-on-dips area, with upside targets of 24350, 24400, and 24450.
On the downside, 24450–24400 acts as a reversal zone. If Nifty fails to sustain near this resistance and shows rejection, short positions can be considered for targets of 24350, 24300, and 24250. A breakdown below 24200 would further strengthen the bearish outlook and may drag the index towards 24150, 24100, and 24050 levels.
Overall, a gap-up opening is expected with a positive bias, but the index is approaching an important resistance zone. Traders should prefer buying on dips near 24250–24300 or wait for a confirmed breakout above 24500 for fresh long positions. Rejection near 24450–24500 may offer short-selling opportunities. Maintain strict stop-losses and book partial profits at each target due to expected intraday volatility. #BANKNIFTY Intraday PE & CE Levels(06/07/2026)Bank Nifty is expected to open with a slightly gap-up bias around the 57980–58000 zone, indicating a mildly positive start to the session. The index is trading near an important resistance level, so traders should wait for a confirmed breakout before initiating aggressive long positions.
The immediate resistance lies at 58050–58100. A sustained move above this zone can trigger fresh buying momentum towards 58250, 58350, and 58450 levels. If Bank Nifty continues to hold above 58050, the bullish trend is likely to strengthen, with further upside potential towards 58550, 58750, 58850, and 58950 levels.
On the downside, 57950–57900 remains the immediate support zone. Failure to sustain above this range may invite profit booking and fresh selling pressure, dragging the index towards 57750, 57650, and 57550 levels. Traders should remain cautious if this support is breached.
Overall, a slightly gap-up opening is expected with Bank Nifty trading close to a key resistance zone. A decisive breakout above 58050 will favor fresh long positions, while rejection from this level or a breakdown below 57950 may offer short-selling opportunities. Maintain strict stop-losses and book partial profits at each target due to expected intraday volatility. NIFTY ANALYSIS | MONDAY, 6 JULY 2026 | 4H → 1H →15-MIN→5-MIN TF # 📊 NIFTY ANALYSIS | MONDAY, 6 JULY 2026 | 4H → 1H → 15-MIN → 5-MIN TF 🔥
The close was **24,270.85**, up **95.15 points (+0.39%)**. NIFTY continues to trade above the psychologically important **24,200** zone and remains within a short-term bullish structure. However, the index closed off the day's high, indicating profit booking near resistance. The market is constructive, but fresh longs should wait for confirmation instead of chasing momentum.
---
# 🚨 FINAL VERDICT
## Market Bias
🟢 **Bullish above 24,252.35**
🟡 **Range-bound between 24,252 and 24,320**
🔴 **Bearish only below 24,175 on sustained acceptance**
NIFTY has reclaimed higher levels over the past week and continues making higher highs and higher lows on lower timeframes. Buyers remain in control while price sustains above the day's low.
---
## Institutional Summary
* **Market Regime:** 🟢 Bullish Recovery
* **Control:** Buyers above **24,252.35**
* **Previous Session OHLC:**
* Open: **24,375.65**
* High: **24,378.15**
* Low: **24,252.35**
* Close: **24,270.85**
* **Immediate Resistance:** **24,286.60 → 24,320 → 24,378.15**
* **Immediate Support:** **24,252.35 → 24,225 → 24,175**
* **Trader Action:** Wait for a 15-minute close outside the trigger zone. Institutions generally let impatient traders pay the tuition fees.
---
## Probability Matrix
🟢 Bullish: **50%**
🟡 Range-bound: **30%**
🔴 Bearish: **20%**
━━━━━━━━━━━━━━━━━━
# 🟢 HIGH-PROBABILITY CE TRADE
## CE Setup: Breakout Above Immediate Supply
**Probability:** 50%
**Strategy:** Buy CE only after confirmation above resistance.
### Entry Trigger
* 15-minute close above **24,286.60**
### Confirmation
* 5-minute retest holds above **24,270**
* RSI above **60**
* Rising volume
### Stop Loss
**24,240**
### Targets
* 🎯 T1: **24,320**
* 🎯 T2: **24,378**
* 🎯 T3: **24,450**
### Invalidation
15-minute close below **24,252**
### Intraday Fibonacci (3 July Range)
High **24,378.15**
Low **24,252.35**
* 23.6% : **24,282.05**
* 38.2% : **24,300.40**
* 50.0% : **24,315.25**
* 61.8% : **24,330.10**
* 78.6% : **24,351.25**
### Institutional Logic
A sustained breakout above **24,286.60** confirms buyers are defending higher levels and attempting another move toward the previous swing high. Holding above the 23.6%-38.2% Fibonacci zone increases the probability of an expansion toward **24,378** and **24,450**.
━━━━━━━━━━━━━━━━━━
# 🔴 HIGH-PROBABILITY PE TRADE
## PE Setup: Breakdown Below Day Support
**Probability:** 20%
### Entry Trigger
15-minute close below **24,252.35**
### Confirmation
* Failed retest below **24,270**
* RSI below **45**
* Strong bearish volume
* VWAP rejection
### Stop Loss
**24,300**
### Targets
* 🎯 T1: **24,225**
* 🎯 T2: **24,175**
* 🎯 T3: **24,120**
### Invalidation
15-minute close back above **24,286.60**
### Institutional Logic
A break below **24,252** would indicate short-term exhaustion after the recent rally. Sellers may then attempt to revisit **24,175**, where fresh buyers are likely to defend.
━━━━━━━━━━━━━━━━━━
# 📊 OPTION-CHAIN VIEW
## ATM Strike: **24,300**
### Key Zones
* Call Writing Zone: **24,300 - 24,400**
* Put Writing Zone: **24,200 - 24,300**
* Max Pain Area: Around **24,300**
* Bullish Breakout: Above **24,286**
* Bearish Breakdown: Below **24,252**
### Option Chain Interpretation
Option writers continue defending the **24,300** region, making it the immediate battleground. A decisive move outside **24,250-24,300** is likely to trigger directional momentum.
━━━━━━━━━━━━━━━━━━
# 📈 DAILY TIMEFRAME ANALYSIS
### Trend
Primary uptrend remains intact.
### Structure
Higher highs and higher lows continue.
### EMA Position
Price remains above the 20, 50 and 200 EMA cluster, supporting the broader bullish trend.
## Daily Chart Fibonacci
Swing High: **26,354.05**
Swing Low: **22,184.45**
* 23.6% → **23,168.50**
* 38.2% → **23,777.25**
* 50.0% → **24,269.25**
* 61.8% → **24,761.25**
* 65.0% → **24,894.70**
* 78.6% → **25,461.75**
* 1.618 Extension → **26,098.50**
### Institutional Interpretation
NIFTY is trading almost exactly around the **50% Daily Fibonacci level (24,269)**. Sustained acceptance above this level strengthens the bullish continuation toward **24,761**, while rejection below it may result in another consolidation phase.
━━━━━━━━━━━━━━━━━━
# 📈 4H TIMEFRAME ANALYSIS
* Trend: Bullish
* Structure: Higher highs and higher lows
* Momentum: Positive
* Resistance: **24,320 → 24,378 → 24,450**
* Support: **24,252 → 24,175 → 24,100**
Interpretation:
The 4-hour chart continues to support the recovery trend.
━━━━━━━━━━━━━━━━━━
# 📉 1H TIMEFRAME ANALYSIS
* Trend: Bullish
* Momentum: Positive
* Resistance:
* **24,286**
* **24,320**
* **24,378**
* Support:
* **24,252**
* **24,225**
* **24,175**
Acceptance above **24,286** can restart the next leg higher.
━━━━━━━━━━━━━━━━━━
# ⏱️ 15-MINUTE TRADE FRAMEWORK
## Immediate Resistance
1. **24,286.60**
2. **24,320**
3. **24,378.15**
4. **24,450**
## Immediate Support
1. **24,252.35**
2. **24,225**
3. **24,175**
4. **24,120**
## Trigger Zone
Bullish Trigger:
**15-minute close above 24,286.60**
Bearish Trigger:
**15-minute close below 24,252.35**
No Trade Zone:
**24,252 to 24,286**
━━━━━━━━━━━━━━━━━━
# ⚡ 5-MINUTE EXECUTION PLAN
## CE Buyers
* Wait for breakout above **24,286**
* Buy only after successful retest
* Book partial at **24,320**
* Trail toward **24,378** and **24,450**
## PE Buyers
* Wait for breakdown below **24,252**
* Enter after failed retest
* Book profits near **24,225**
* Trail toward **24,175**
━━━━━━━━━━━━━━━━━━
# 🧠 MARKET PSYCHOLOGY
Retail traders are likely to chase fresh highs above **24,300**, while institutions may first test liquidity around the resistance zone before committing to the next move.
Current Edge:
🟢 Buyers remain in control while NIFTY stays above **24,252**.
━━━━━━━━━━━━━━━━━━
# 📌 TRADING DAY SCENARIOS
## Scenario 1: Bullish Continuation
**Probability:** 50%
Trigger:
15-minute close above **24,286**
Targets:
**24,320 → 24,378 → 24,450**
---
## Scenario 2: Consolidation
**Probability:** 30%
Range:
**24,252 - 24,286**
Action:
Avoid aggressive option buying inside the range.
---
## Scenario 3: Bearish Pullback
**Probability:** 20%
Trigger:
15-minute close below **24,252**
Targets:
**24,225 → 24,175 → 24,120**
━━━━━━━━━━━━━━━━━━
# 🚫 INVALIDATION LEVELS
🟢 Bullish thesis invalid below:
**24,252** on sustained 15-minute close.
🔴 Bearish thesis invalid above:
**24,286** on sustained acceptance.
━━━━━━━━━━━━━━━━━━
# 🔥 TRADER NOTE
For **6 July 2026**, the decisive trading range is:
## **24,252.35 – 24,286.60**
A confirmed breakout above **24,286.60** can extend the rally toward **24,320**, **24,378**, and possibly **24,450**. A breakdown below **24,252.35** may trigger short-term profit booking toward **24,175**.
Trade the confirmation, not the anticipation. The market has an uncanny talent for humbling people who believe they can predict its next move with absolute certainty.
*Educational analysis only. Not financial advice.*
#Nifty #Nifty50 #BankNifty #StockMarketIndia #ShareMarketIndia #IndianStockMarket #NSEIndia #DalalStreet #OptionsTrading #IntradayTrading #TechnicalAnalysis #PriceAction #Fno #SwingTrading #InvestingIndia #NiftyPrediction #MarketAnalysis #ChartPatterns #TradingView #StockMarketUpdates #NiftyTrader #IndianShareMarket #Sensex #BSEIndia #DayTrading #StocksToWatch #OptionBuying #OptionSelling #MarketInsights #FinancialFreedom
Long 
NIFTY — Trading Plan for 06 July 2026
🗓️ Date: Monday, 06 July 2026 | Timeframe: 15-Min |
"Plan your trade, Trade your plan — the market rewards discipline, not impulse."
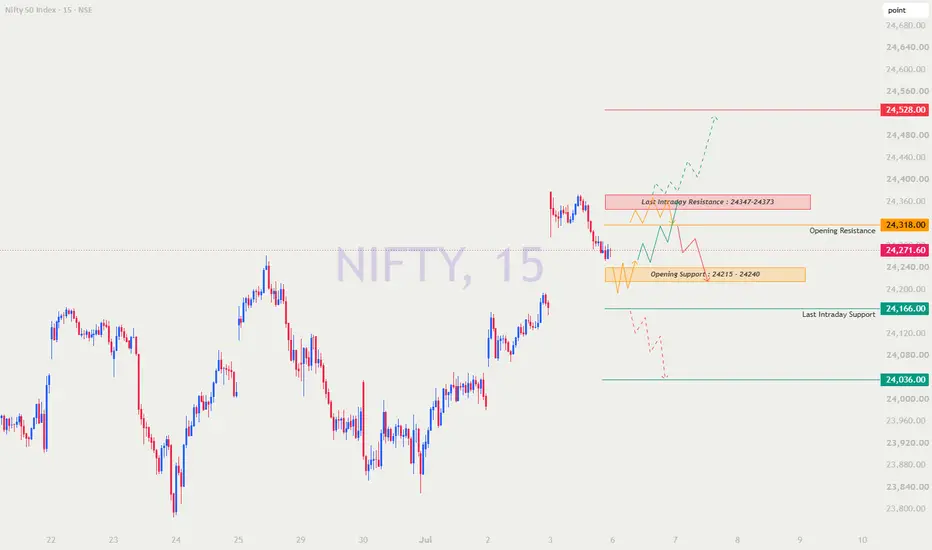
🔑 KEY LEVELS TO WATCH — Chart Reference
Before diving into scenarios, let's understand the critical zones marked on the chart:
🟠 Opening Resistance (Orange Line — NO TRADE / Sideways Zone): 24,318
→ This is the neutral/indecision zone. Price hovering here = wait & watch. No aggressive trades.
🟥 Last Intraday Resistance Zone (Red Box): 24,347 – 24,373
→ Strong supply zone from previous session. Expect selling pressure here.
🟥 Major Resistance (Red Line): 24,528
→ This is the ultimate hurdle for bulls today. A breakout above this = strong momentum.
🟨 Opening Support Zone (Orange Box): 24,215 – 24,240
→ Key demand zone near open. Bulls need to defend this.
🟩 Last Intraday Support (Green Line): 24,166
→ Previous session's low support. A breakdown below confirms bearish sentiment.
🟩 Major Support (Green Line): 24,036
→ Strong demand zone. This is the target for bears if breakdown sustains.
🔵 Previous Close: 24,271.60
🚀 SCENARIO 1 — GAP UP OPENING (100+ Points Above Previous Close)
📍 Expected Open: Above 24,370 (i.e., 24,372+)
📖 What Does a Gap Up Mean?
A Gap Up opening of 100+ points indicates strong overnight buying interest — possibly driven by positive global cues, FII buying, or favorable macro news. However, a large gap up also brings the risk of a "gap fill" — where prices come back down to fill the gap. Smart traders never blindly buy a gap up; they wait for confirmation.
📐 Gap Up — Plan of Action:
🔶 Situation A: Market Opens Above 24,373 (Last Intraday Resistance Zone)
If Nifty opens directly above 24,347–24,373 (red resistance box), this zone now acts as support.
🟢 Bullish Trade Setup:
📍 Wait for the first 15-minute candle to form
📍 If price sustains and consolidates above 24,373 without breaking below
📍 Look for a pullback to 24,347–24,373 zone for a long entry
📍 Entry: 24,355 – 24,373 (on retest)
📍 Target 1: 24,450
📍 Target 2: 24,528 🎯 (Major Red Resistance)
📍 Stop Loss: 24,310 (below opening resistance orange line)
🧠 Educational Note: When previous resistance becomes support, it's called a "role reversal" — one of the most powerful concepts in technical analysis. The dashed teal line on chart shows this possible move upward.
🔶 Situation B: Gap Up But Market Struggles at 24,373 – 24,528 Zone
If Nifty opens in the 24,370–24,400 range but immediately faces selling at the red box (24,347–24,373):
🟠 NO TRADE ZONE — Wait & Watch
📍 This is the Orange zone — sideways or indecision
📍 Do NOT initiate any fresh positions immediately
📍 Watch for at least 2–3 candles to see direction
🔴 If price reverses below 24,318 (Orange Resistance Line):
📍 This becomes a Bull Trap signal
📍 Short Entry: Below 24,315 (after confirmation candle)
📍 Target 1: 24,240
📍 Target 2: 24,166
📍 Stop Loss: 24,375
🧠 Educational Note: A gap up that fails to hold its opening level is called a "Exhaustion Gap" — it signals that buyers are running out of strength. The red dashed arrow on the chart shows this reversal possibility.
🔶 Situation C: Strong Gap Up Above 24,450 (Directly Near Major Resistance)
📍 If market opens near 24,450–24,528, avoid chasing longs
📍 Wait for a pullback — do not buy at highs blindly
📍 Look for short setup near 24,528 with strict SL above 24,545
📍 Short Target: 24,373 → 24,318
⚠️ Tip: Extreme gap ups often lead to intraday reversals. Patience is the key!
✅ Gap Up — Summary Table:
Setup Entry Target 1 Target 2 Stop Loss
🟢 Long (Retest of 24,373) 24,355–24,373 24,450 24,528 24,310
🔴 Short (Fail below 24,318) Below 24,315 24,240 24,166 24,375
🟠 No Trade Zone 24,318–24,373 — — —
➡️ SCENARIO 2 — FLAT OPENING (Within ±50 Points of Previous Close)
📍 Expected Open: 24,220 – 24,320 (Near Previous Close of 24,271)
📖 What Does a Flat Opening Mean?
A flat opening near the previous close suggests market indecision — neither bulls nor bears are in control at the open. This is actually one of the best scenarios for intraday traders because the key levels are clean and price hasn't run away yet. Your job is to identify which side wins the early battle.
The Opening Support Zone (24,215–24,240) and Opening Resistance (24,318) on the chart are your battle lines. 🏳️
📐 Flat Opening — Plan of Action:
🔶 Situation A: Flat Open + Holds Above Opening Support (24,215–24,240)
If Nifty opens flat near 24,250–24,280 and the opening support zone 24,215–24,240 holds in the first 15 minutes:
🟢 Bullish Trade Setup:
📍 Look for a bounce from 24,215–24,240 zone (orange support box on chart)
📍 Entry on bullish 15-min candle closing above 24,260
📍 Entry: 24,260 – 24,275
📍 Target 1: 24,318 (Orange Resistance)
📍 Target 2: 24,347 – 24,373 (Red Resistance Box)
📍 Target 3 (if momentum): 24,528
📍 Stop Loss: 24,200 (below opening support zone)
🧠 Educational Note: The green zigzag line on the chart represents a possible bullish move where price bounces from support and tests resistance levels step by step. This is a classic "staircase bullish pattern" — higher highs and higher lows.
🔶 Situation B: Flat Open + Price Hovers Between 24,240 and 24,318
If Nifty opens flat and price stays stuck between 24,240 and 24,318:
🟠 NO TRADE — Sideways / Consolidation Zone
📍 This is the orange no-trade zone on your chart
📍 Market is in balance — wait for a clear breakout or breakdown
📍 Avoid scalping in this zone — it will chop your positions
📌 Wait for a decisive 15-min candle close above 24,318 OR below 24,215 before taking a trade.
🔶 Situation C: Flat Open + Breaks Below Opening Support (24,215–24,240)
If Nifty opens flat but immediately breaks below 24,215 with a strong bearish candle:
🔴 Bearish Trade Setup:
📍 Breakdown below 24,215 confirms bearish momentum
📍 Entry: Below 24,210 (on confirmation)
📍 Target 1: 24,166 (Last Intraday Support — Green Line)
📍 Target 2: 24,036 (Major Green Support)
📍 Stop Loss: 24,260 (back inside support zone)
🧠 Educational Note: When a support zone breaks, it becomes resistance. The red dashed downward arrow on the chart shows this possible bearish trajectory toward 24,036. This is called a "Support Breakdown" — a high probability short setup.
🔶 Situation D: Flat Open + Breakout Above 24,318 (Orange Resistance)
If price breaks and closes above 24,318 on 15-min timeframe:
🟢 Strong Bullish Signal:
📍 Entry: Above 24,320 (after breakout candle closes)
📍 Target 1: 24,373
📍 Target 2: 24,450
📍 Target 3: 24,528
📍 Stop Loss: 24,275
✅ Flat Open — Summary Table:
Setup Entry Target 1 Target 2 Stop Loss
🟢 Long (Bounce from 24,240) 24,260–24,275 24,318 24,373 24,200
🟢 Long (Breakout above 24,318) Above 24,320 24,373 24,528 24,275
🔴 Short (Break below 24,215) Below 24,210 24,166 24,036 24,260
🟠 No Trade 24,215–24,318 — — —
📉 SCENARIO 3 — GAP DOWN OPENING (100+ Points Below Previous Close)
📍 Expected Open: Below 24,170 (i.e., 24,171 or below)
📖 What Does a Gap Down Mean?
A Gap Down opening of 100+ points indicates strong selling pressure overnight — possibly due to negative global cues, FII selling, or adverse macro/geopolitical events. However, large gap downs can also be buying opportunities if key supports hold. The key is: don't panic, don't sell blindly — wait for confirmation.
With a 100+ point gap down, Nifty would open near or below the Last Intraday Support (24,166), making this a critical decision zone. 🎯
📐 Gap Down — Plan of Action:
🔶 Situation A: Gap Down Opening Near 24,166 (Last Intraday Support — Green Line)
If Nifty opens around 24,100–24,166 zone:
🟢 Potential Reversal / Bounce Trade:
📍 Watch first 15-min candle carefully
📍 If price holds above 24,100 and forms a bullish candle
📍 Entry: 24,130 – 24,150 (on reversal signal)
📍 Target 1: 24,215 (Opening Support zone)
📍 Target 2: 24,271 (Previous close)
📍 Stop Loss: 24,070
⚠️ This is a countertrend bounce — keep position size SMALL. Use it only if a clear reversal candle forms.
🔶 Situation B: Gap Down + Immediate Breakdown Below 24,166
If Nifty opens with a gap down and immediately breaks below 24,166 (green last intraday support line):
🔴 Strong Bearish Trade Setup:
📍 Do NOT try to catch the falling knife — wait for a dead cat bounce
📍 Wait for price to pull back to 24,166 (now resistance)
📍 Short Entry: 24,155 – 24,166 (on failed retest)
📍 Target 1: 24,036 (Major Green Support — Strong Target) 🎯
📍 Target 2: 23,950 (if momentum continues)
📍 Stop Loss: 24,210
🧠 Educational Note: The red dashed line arrow on chart shows this exact bearish scenario — price falls through support and heads toward 24,036. This is a "Support-to-Resistance Flip" trade — a textbook short setup in technical analysis.
🔶 Situation C: Gap Down But Quick Recovery Above 24,215
If Nifty gaps down but within 30 minutes recovers back above 24,215 (opening support zone):
🟢 Gap Fill Rally Setup:
📍 This signals that sellers are weak and buyers are absorbing the gap
📍 Entry: Above 24,220 (after recovery candle closes)
📍 Target 1: 24,271 (Previous close)
📍 Target 2: 24,318 (Orange Resistance)
📍 Stop Loss: 24,170
🧠 Educational Note: This is called a "Gap Fill" scenario — where the market rapidly recovers from its gap down and moves back toward the previous close. The teal dashed upward arrow on chart hints at this bullish recovery path.
🔶 Situation D: Extreme Gap Down (Below 24,036 — Major Support)
If Nifty opens below 24,036 (green major support line):
🟠 NO TRADE — Extreme Caution Zone
📍 Wait for at least 30–45 minutes before taking any trade
📍 Let the market settle — volatility will be extreme
📍 Watch for VIX levels — if VIX spikes, options premiums will be expensive
📍 Look for stability and then plan accordingly
✅ Gap Down — Summary Table:
Setup Entry Target 1 Target 2 Stop Loss
🟢 Bounce (Hold at 24,166) 24,130–24,150 24,215 24,271 24,070
🔴 Short (Break below 24,166) 24,155–24,166 24,036 23,950 24,210
🟢 Long (Gap Fill above 24,215) Above 24,220 24,271 24,318 24,170
🟠 No Trade Below 24,036 — — —
💡 RISK MANAGEMENT TIPS FOR OPTIONS TRADING
"Options can make you rich in a day — or wipe you out in an hour. Respect the instrument." 🙏
📌 Tip 1 — Never Risk More Than 1–2% Per Trade
📍 If your capital is ₹1,00,000 — your max loss per trade should be ₹1,000–₹2,000
📍 Options can go to zero. Always define your max loss before entering.
📌 Tip 2 — Avoid Buying Options in the First 15 Minutes
📍 The first 15 minutes are the most volatile
📍 Options premiums are highest (inflated IV) at open
📍 Wait for price to settle near a key level before buying options
📌 Tip 3 — Use ATM Options for Directional Trades
📍 For intraday directional trades (Gap Up/Down scenarios), prefer ATM (At The Money) options
📍 They have the best delta-to-premium ratio
📍 Avoid deep OTM options — they are lottery tickets, not trades
📌 Tip 4 — Time Decay is Your Enemy (If You're a Buyer)
📍 If you're buying options on weekly expiry day — every minute works against you
📍 Plan quick trades with defined targets — do not hold losing positions
📍 Exit by 2:30 PM at latest on expiry day — theta crush is brutal post 2:00 PM
📌 Tip 5 — Use Spreads to Reduce Cost and Risk
📍 Instead of buying a naked call/put, consider a Bull Call Spread or Bear Put Spread
📍 Example (Gap Up scenario): Buy 24,400 CE + Sell 24,500 CE
📍 This reduces premium cost and limits max loss
📌 Tip 6 — Never Average a Losing Options Position
📍 If your option is down 30–40% from your buying price — exit
📍 Averaging down on options is a dangerous habit — time decay makes it worse
📌 Tip 7 — Respect the Orange (No Trade) Zone 🟠
📍 When price is in the orange zone (24,240–24,318 on chart), avoid trading options
📍 Premium decay without movement = guaranteed loss for option buyers
📌 Tip 8 — Position Sizing Based on Scenario Confidence
📍 High confidence trade (clear breakout/breakdown with volume): 2 lots
📍 Medium confidence trade (bounce/reversal play): 1 lot
📍 Low confidence / news-driven: 0 lots — sit on hands
📌 Tip 9 — Set a Daily Stop Loss
📍 Decide before market open: "If I lose ₹X today, I stop trading."
📍 Stick to it. No exceptions. No revenge trading.
📌 Tip 10 — VIX Watch 👁️
📍 If India VIX is above 15 — options are expensive, prefer selling strategies or tighter entries
📍 If India VIX is below 12 — options are cheaper, buying strategies work better
📋 SUMMARY & CONCLUSION
🎯 Key Levels Recap:
Level Value Significance
🟥 Major Resistance 24,528 Ultimate bull target today
🟥 Resistance Zone 24,347 – 24,373 Previous intraday supply
🟠 No Trade / Opening Resistance 24,318 Indecision zone
⚪ Previous Close 24,271.60 Reference point
🟨 Opening Support Zone 24,215 – 24,240 Key demand zone
🟩 Last Intraday Support 24,166 Critical support
🟩 Major Support 24,036 Bearish target if breakdown
📝 Conclusion:
Nifty 50 enters Monday's session at 24,271.60 — sitting exactly between two important levels: the Opening Support Zone (24,215–24,240) below and the Opening Resistance (24,318) above. This creates a well-defined range for the first hour of trading.
🟢 Bulls need to: Break and hold above 24,318 → then target 24,373 → 24,450 → 24,528
🔴 Bears need to: Break below 24,215 → then target 24,166 → 24,036
🟠 In between (24,215–24,318): Respect the no-trade zone. Do not force trades. Let the market show its hand first.
The dashed lines on the chart remind us — trends are possible, not guaranteed. Trade what you SEE, not what you THINK will happen. 📊
Remember:
✅ Wait for confirmation
✅ Trade with defined risk
✅ Protect your capital above all
✅ One good trade is better than ten random ones
"The market gives opportunity every day — your job is to be ready, be disciplined, and be patient." 🧘
⚠️ DISCLAIMER
This trading plan is purely for educational and informational purposes only. The levels and scenarios mentioned are based on technical analysis of the chart and are subject to change based on market conditions.
I am NOT a SEBI Registered Research Analyst. This is NOT investment advice, NOT a buy/sell recommendation, and should NOT be treated as financial advice of any kind.
Trading in equity markets, futures, and options involves substantial risk of loss. Past performance is not indicative of future results. Please consult a SEBI Registered Investment Advisor before making any trading or investment decisions.
Trade at your own risk. The author holds no responsibility for any profit or loss arising from the use of this information.
📌 If you found this plan helpful, please Like 👍, Follow 🔔 and Share with fellow traders!
💬 Drop your views in the comments below — let's learn together!
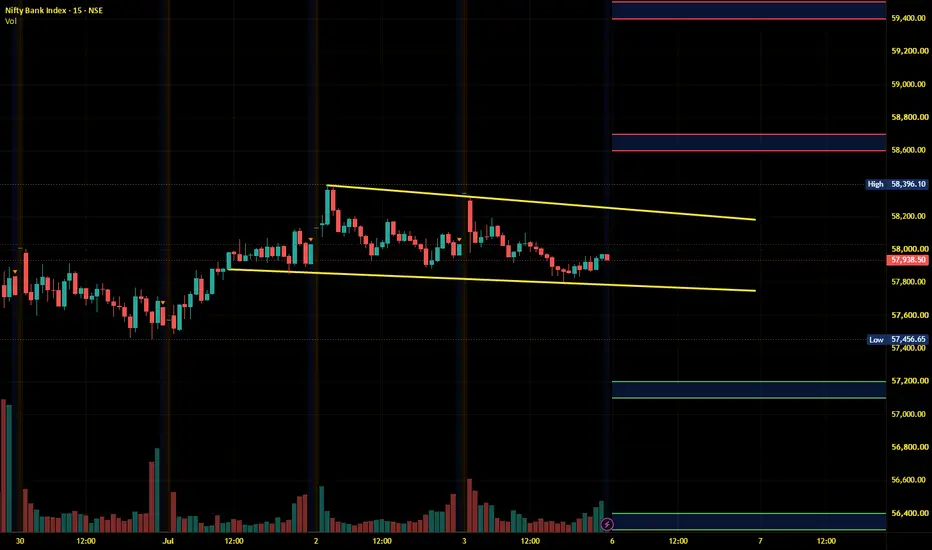
Hyper-Squeeze at 58000 [Analysis For 06.07.2026: Monday]Probable Price Structure Analysis of Nifty Bank for the 06th of July, 2026. The day is Monday.
Chart Pattern: Symmetric Triangle.
Presently, Nifty Bank is stuck in a tight range. It has formed a symmetric triangle. Only a breakout or breakdown would offer trend clarity. The index is under a hyper-squeeze zone.
🟢 Bullish Scenario
Be bullish only if the price sustains above the level of 58250 for at least 30 minutes. The probable bullish targets above the level of 58250 would be - 58375, 58500, 58625, and 58750.
🔴 Bearish Scenario
Be bearish only if the price sustains below the level of 57750 for at least 30 minutes. The probable bearish targets below the level of 57750 would be - 57625, 57500, 57375, and 57250.
🟡 No Trading Zone (NTZ): (58250 - 57750) .
Presently, the price is in the NTZ. We have to wait for a breakout or breakdown from the NTZ for trend clarity. Here, the zone of (58250 - 58125) is a strong resistance zone, and the zone of (57875 - 57750) is a strong support.
⏺ Range of Consolidation (ROC): (58500 - 57500).
Here, 58000 is the median of ROC. The median works like a sentiment. The price trading above the median would offer bullish sentiment, while the price trading below the median would trigger bearish sentiment.
● Event
This week (06th to 10th July), there is one high-impact event (the U.S. FOMC minutes). The event is on Wednesday, 08th of July. So, we have to deal with two weekly expiries and one high-impact event.
● Intraday Bias
Establish intraday bias with respect to the opening price. If the price sustains above the opening price, then don't think of shorting. Look for bullish trades only. On the contrary, if the price sustains below the opening price, then don't think of going long. Look for bearish trades in that case.
● Disclaimer + End Note
- All the analyses would fail in the case of a major gap up, gap down, or price structure anomaly. Thus, practice PRAGMATISM in the live session.
- Trade only if there is a set-up. Remember, not trading is an extension of the trading activity.
- Mark your points. Trade your points. Price is GOD. Anything can happen in the markets. Thus, trade what you see, not what you believe.
- Always PRACTICE RISK MANAGEMENT. Always PROTECT YOUR CAPITAL. Be RESPONSIBLE.
- Be Strategic. Be Courageous. Be Patient. Be Wise.
- Every day is a new day. Thus, do not carry the baggage of past successes or failures. Leave the gardens of winning and losing. Establish yourself in equanimity. Always think from a new perspective.
- Let the joy of trading drive your effectiveness, not greed or fear. Believe in Possibilities.
Happy Trading! Education

SENSEX Analysis [For 06.07.2026: Monday]Probable Scenario Analysis of SENSEX for the 06th of July, 2026. The day is Monday.
🟢 Bullish Scenario
Be bullish only when the price sustains above the level of 78000. A weak bullish move can be observed till the level of 78250. If the price decisively trades above the level of 78250, then SENSEX might reach the level of 78500. In short, be bullish and stay bullish only above 78000.
🔴 Bearish Scenario
If the price sustains below the level of 77750, then a weak bearish move can be expected till the level of 77500. There is strong support at the level of 77500. Next, if the price decisively stays for 30 minutes below the level of 77500, then we can expect sharp selling. The probable bearish levels below the level of 77500 would be - 77250 and 77000. Again, there will be strong support at the level of 77000.
🟡 No Trading Zone (NTZ): (78000 - 77750).
Presently, the price is in the NTZ. We have to wait for a breakout or breakdown from the NTZ for trend clarity.
⏺ Range of Consolidation (ROC): (78500 - 77500).
Here, 78000 is the median of ROC. The median works like a sentiment. The price trading above the median would offer bullish sentiment, while the price trading below the median would trigger bearish sentiment.
● Event
This week (06th to 10th July), there is one high-impact event (the U.S. FOMC minutes). The event is on Wednesday, 08th of July. So, we have to deal with two weekly expiries and one high-impact event.
● Intraday Bias
Establish intraday bias with respect to the opening price. If the price sustains above the opening price, then don't think of shorting. Look for bullish trades only. On the contrary, if the price sustains below the opening price, then don't think of going long. Look for bearish trades in that case.
● Disclaimer + End Note
- All the analyses would fail in the case of a major gap up, gap down, or price structure anomaly. Thus, practice PRAGMATISM in the live session.
- Trade only if there is a set-up. Remember, not trading is an extension of the trading activity.
- Mark your points. Trade your points. Price is GOD. Anything can happen in the markets. Thus, trade what you see, not what you believe.
- Always PRACTICE RISK MANAGEMENT. Always PROTECT YOUR CAPITAL. Be RESPONSIBLE.
- Be Strategic. Be Courageous. Be Patient. Be Wise.
- Every day is a new day. Thus, do not carry the baggage of past successes or failures. Leave the gardens of winning and losing. Establish yourself in equanimity. Always think from a new perspective.
- Let the joy of trading drive your effectiveness, not greed or fear. Believe in Possibilities.
Happy Trading!