NIFTY: 14-Day Rolling VWAP Remains the Key Decision ZoneNIFTY is approaching an important technical area around the 14-Day Rolling VWAP (~24,040), which has acted as resistance during today's session.
Participant-wise OI positioning continues to suggest a constructive (bullish) bias, but price confirmation is still required.
A sustained 15-minute close above the 14-Day Rolling VWAP and acceptance above 24,040 would strengthen the bullish case and shift attention toward the next resistance zone.
If price fails to reclaim this level, the market may remain range-bound or revisit nearby support levels before attempting another move.
Key Levels
• Key Decision Zone: 24,040 (14-Day Rolling VWAP)
• First Support: 23,947
• Second Support: 23,852
This analysis combines price structure with participant-wise OI positioning. As always, price confirmation is more important than anticipation.
This analysis focuses on the next trading session. For the broader market structure and higher timeframe context, please refer to the related analysis attached to this post.
This is a personal market analysis intended for educational discussion and is not investment advice.  Long
Long
Nifty Bank Analysis [For 02.06.2026: Thursday]Probable Scenario Analysis of Nifty Bank for the 02nd of July, 2026. The day is Thursday.
🟢 Bullish Scenario
If the price sustains at least 30 minutes above the level of 58000, then a weak bullish move to the level of 58250 is expected. Next, if the price breaks out above the level of 58250, then the probable bullish targets would be - 58500, 58750, and 59000.
🔴 Bearish Scenario
The level of 57500 is a make-or-break level. If the level of 57500 is broken, then there will be sharp selling. The probable bearish targets below the level of 57500 are - 57250, 57000, and 56750.
🟡 No Trading Zone (NTZ): (58000 - 57500).
Here, the zone of (57750 - 57500) is strong support.
⏺ Range of Consolidation (ROC): (58500 - 57500).
Here, 58000 is the median of ROC. The median works like a sentiment. The price trading above the median would offer bullish sentiment, while the price trading below the median would trigger bearish sentiment.
● Event
There is no high-impact event this week. However, there is the U.S. Independence Day Holiday on Friday (03rd of July). On Thursday, there is SENSEX weekly expiry. Therefore, we can expect a price anomaly.
● Intraday Bias
Establish intraday bias with respect to the opening price. If the price sustains above the opening price, then don't think of shorting. Look for bullish trades only. On the contrary, if the price sustains below the opening price, then don't think of going long. Look for bearish trades in that case.
● Disclaimer + End Note
- All the analyses would fail in the case of a major gap up, gap down, or price structure anomaly. Thus, practice PRAGMATISM in the live session.
- Trade only if there is a set-up. Remember, not trading is an extension of the trading activity.
- Mark your points. Trade your points. Price is GOD. Anything can happen in the markets. Thus, trade what you see, not what you believe.
- Always PRACTICE RISK MANAGEMENT. Always PROTECT YOUR CAPITAL. Be RESPONSIBLE.
- Be Strategic. Be Courageous. Be Patient. Be Wise.
- Every day is a new day. Thus, do not carry the baggage of past successes or failures. Leave the gardens of winning and losing. Establish yourself in equanimity. Always think from a new perspective.
- Let the joy of trading drive your effectiveness, not greed or fear. Believe in Possibilities.
Happy Trading! SENSEX Analysis [For 02.06.2026: Thursday]Probable Scenario Analysis of SENSEX for the 02nd of July, 2026. The day is Thursday.
🟢 Bullish Scenario
If the price sustains at least 30 minutes above the level of 77000, then a weak bullish move to the level of 77250 is expected. Next, if the price breaks out above the level of 77250, then the probable bullish targets would be - 77500, 77750, and 78000.
🔴 Bearish Scenario
The level of 76500 is a make-or-break level. If the level of 76500 is broken, then there will be sharp selling. The probable bearish targets below the level of 76500 are - 76250, 76000, 75750, and 75500.
🟡 No Trading Zone (NTZ): (77000 - 76500).
Here, the zone of (76750 - 76500) is strong support.
⏺ Range of Consolidation (ROC): (77500 - 76500).
Here, 77000 is the median of ROC. The median works like a sentiment. The price trading above the median would offer bullish sentiment, while the price trading below the median would trigger bearish sentiment.
● Event
There is no high-impact event this week. However, there is the U.S. Independence Day Holiday on Friday (03rd of July). On Thursday, there is SENSEX weekly expiry. Therefore, we can expect a price anomaly.
● Intraday Bias
Establish intraday bias with respect to the opening price. If the price sustains above the opening price, then don't think of shorting. Look for bullish trades only. On the contrary, if the price sustains below the opening price, then don't think of going long. Look for bearish trades in that case.
● Top-Down Analysis
- Monthly TF: The month is slightly above the close of previous month's closing. Level 76500 seems to be a strong support. Level 77500 seems to be a strong resistance. The view is indecision.
- Weekly TF: Three-week candle combination looks like a rounding top. Back-to-back three doji candles. The market is highly indecisive. A sustainable break out above the level of 77500 would ensure bullish continuation. A sustainable break down below the level of 76500 would ensure bearish continuation. The view is indecision.
- Daily TF: For 12 days, the price is in a range-bound consolidation. The consolidation looks like a rounded top. Level 77500 is strong resistance. Level 76500 seems to be a strong support. If the price breaks down below the level of 76500, then there might be a sharp sell-off till the level of 76000. The view is indecisive.
- 30-minute TF: The price is in a range-bound consolidation. There is no observable trend. The view is indecision.
● Disclaimer + End Note
- All the analyses would fail in the case of a major gap up, gap down, or price structure anomaly. Thus, practice PRAGMATISM in the live session.
- Trade only if there is a set-up. Remember, not trading is an extension of the trading activity.
- Mark your points. Trade your points. Price is GOD. Anything can happen in the markets. Thus, trade what you see, not what you believe.
- Always PRACTICE RISK MANAGEMENT. Always PROTECT YOUR CAPITAL. Be RESPONSIBLE.
- Be Strategic. Be Courageous. Be Patient. Be Wise.
- Every day is a new day. Thus, do not carry the baggage of past successes or failures. Leave the gardens of winning and losing. Establish yourself in equanimity. Always think from a new perspective.
- Let the joy of trading drive your effectiveness, not greed or fear. Believe in Possibilities.
Happy Trading! Nifty : Breakout/Breakdown zone.Current State:
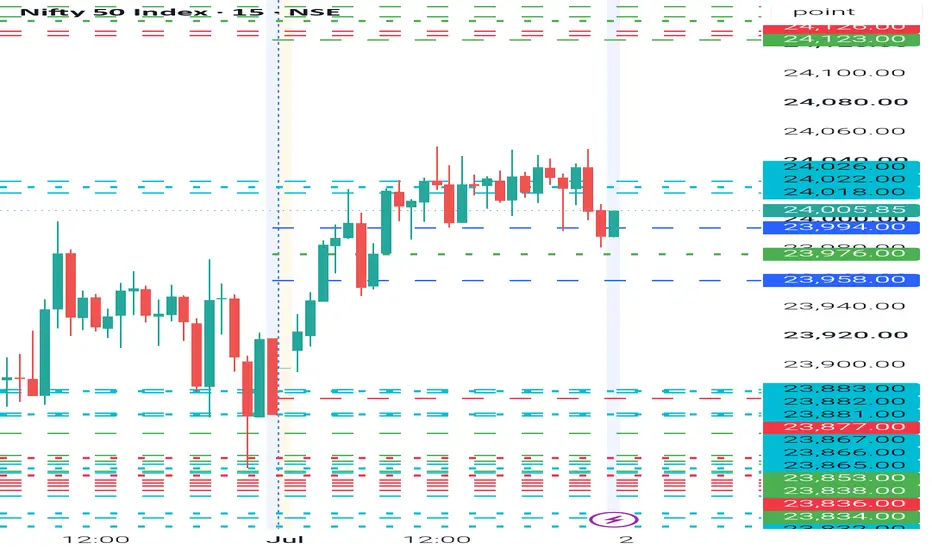
NIFTY is trading at 24,005, it is in a tight symmetrical triangular consolidation following the early-June sell-off. The probability of a strong directional move is high.
Price Action: The index is attempting to test the upper resistance (24,100–24,200).
Moving Averages: Price is short-term bullish (above DMA 20 at 23,724), but faces immediate resistance at DMA 100 at (24,123). The broader trend ) remains bearish until DMA 200 at 24,874 cleared.
RSI (55.13): Neutral-bullish, with ample room for further upside momentum.
Bullish Trigger(Higher Probability): A daily close above 24,200 (clearing both DMA 100 and the upper trendline).Possible Targets: Initial push to 24,400–24,600, with a medium-term objective of 24,874.
Bearish Trigger (Lower Probability): A rejection at the 24,100–24,200 zone, followed by a close below 23,800. Possible Targets: Retest of the bottom trendline at 23,600, with a potential slide toward 23,200 if broken.
SENSEX DAILY/ Short Range Level Analysis for 02nd Jul 2026🔕 SGMN SplD BULLISH Above => 77105.
🔕 SGMN SplD Bearish BELOW => 76749.
Mentioned analysis based on 2 consecutive candle close in 15 min Time Frame.
━━━━━🟥🟧🟨🟩🟦🟪⬛━━━━━
💥Level Interpretation / description:
✍🏻L#1: If the candle crossed & stays above the “Buy Gen”, it is treated / considered as Bullish bias. Cfm=> Confirmation.
L#2: Possibility / Probability of REVERSAL near 🔕RL/TF1 & 🔔RL/TF2
L#3: If the candle stays above “Sell Gen” but below “Buy Gen”, it is treated / considered as Sidewise. Aggressive Traders can take Long position near “Sell Gen” either retesting or crossed from Below & vice-versa i.e. can take Short position near “Buy Gen” either retesting or crossed downward from Above.
L#4: If the candle crossed & stays below the “Sell Gen”, it is treated / considered a Bearish bias.
L#5: Possibility / Probability of REVERSAL near 🔕RL/TF1 & 🔔RL/TF2
HZB (Buy side) & HZS (Sell side) => Hurdle Zone,
✍🏻 *** Specialty of “HZB#1, HZB#2 HZS#1 & HZS#2” is Sidewise (behaviour in Nature)
Rest Plotted and Mentioned on Chart
Color code Used:
Green, BLUE =. Positive bias.
Safron, RED =. Negative bias.
RED in Between Green means Trend Finder / Momentum Change
/ CYCLE Change and Vice Versa.
Notice One thing: HOW LEVELS are Working.
Use any Momentum Indicator / Oscillator or as you "USED to" to Take entry.
━━━━━🟥🟧🟨🟩🟦🟪⬛━━━━━
⚠️ DISCLAIMER:
The information, views, and ideas shared here are purely for educational and informational purposes only. They are not intended as investment advice or a recommendation to buy, sell, or hold any financial instruments. I am not a SEBI-registered financial adviser.
Trading and investing in the stock market involves risk, and you should do your own research and analysis. You are solely responsible for any decisions made based on this research.
"🔔As HARD EARNED MONEY IS YOUR's, So DECISION SHOULD HAVE TO BE YOUR's".
━━━━━🟥🟧🟨🟩🟦🟪⬛━━━━━
❇️ Follow notification about periodical View
💥 Do Comment for Stock WEEKLY Level Analysis.🚀
📊 Do you agree with this view?
✈️ HIT THE PLANE ICON if this technical observation resonates with you. It will Motivate me.
━━━━━🟥🟧🟨🟩🟦🟪⬛━━━━━
💡 If You LOOKING any CHART & want for Level and ANALYZE?
Share your desired stock names in the comments below! I will try to analyze the chart Levels, patterns and share my technical view (so far my Knowledge).
If Viewers think It can identify meaningful setups. Looking forward to hearing from all of you — let's keep this discussion going and help each other make better trading decisions.
___________🔕^^^⚫⚪^🙏🏼🙏🏼🙏🏼^⚪⚫^^^🔔___________ Education 
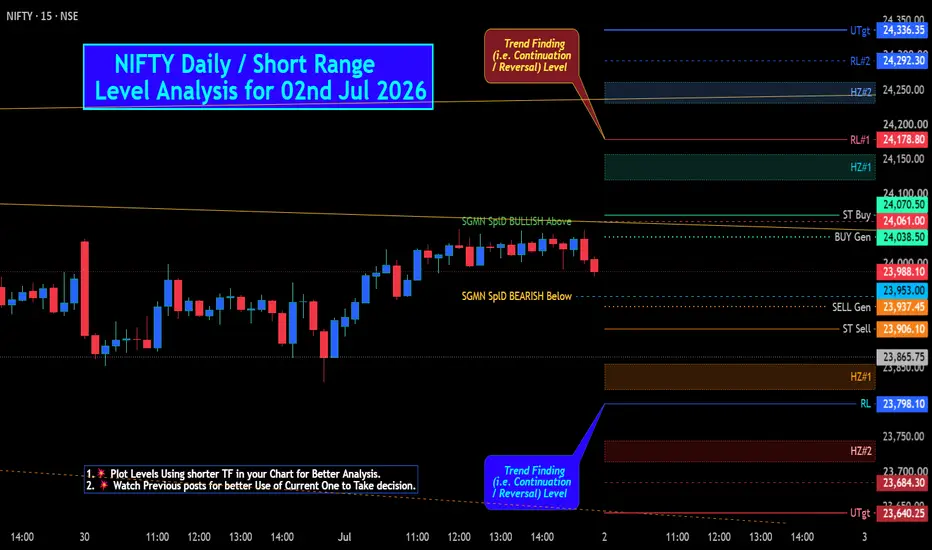
NIFTY Daily / Short Range Level Analysis for 02nd Jul 2026.🔕 SGMN SplD BULLISH Above => 24061.
🔕 SGMN SplD Bearish BELOW => 23953.
Mentioned analysis based on 2 consecutive candle close in 15 min Time Fr ame.
━━━━━🟥🟧🟨🟩🟦🟪⬛━━━━━
💥Level Interpretation / description:
✍🏻L#1: If the candle crossed & stays above the “Buy Gen”, it is treated / considered as Bullish bias. Cfm=> Confirmation.
L#2: Possibility / Probability of REVERSAL near 🔕RL/TF1 & 🔔RL/TF2
L#3: If the candle stays above “Sell Gen” but below “Buy Gen”, it is treated / considered as Sidewise. Aggressive Traders can take Long position near “Sell Gen” either retesting or crossed from Below & vice-versa i.e. can take Short position near “Buy Gen” either retesting or crossed downward from Above.
L#4: If the candle crossed & stays below the “Sell Gen”, it is treated / considered a Bearish bias.
L#5: Possibility / Probability of REVERSAL near 🔕RL/TF1 & 🔔RL/TF2
HZB (Buy side) & HZS (Sell side) => Hurdle Zone,
✍🏻 *** Specialty of “HZB#1, HZB#2 HZS#1 & HZS#2” is Sidewise (behaviour in Nature)
Rest Plotted and Mentioned on Chart
Color code Used:
Green, BLUE =. Positive bias.
Safron, RED =. Negative bias.
RED in Between Green means Trend Finder / Momentum Change
/ CYCLE Change and Vice Versa.
Notice One thing: HOW LEVELS are Working.
Use any Momentum Indicator / Oscillator or as you "USED to" to Take entry.
━━━━━🟥🟧🟨🟩🟦🟪⬛━━━━━
⚠️ DISCLAIMER:
The information, views, and ideas shared here are purely for educational and informational purposes only. They are not intended as investment advice or a recommendation to buy, sell, or hold any financial instruments. I am not a SEBI-registered financial adviser.
Trading and investing in the stock market involves risk, and you should do your own research and analysis. You are solely responsible for any decisions made based on this research.
"🔔As HARD EARNED MONEY IS YOUR's, So DECISION SHOULD HAVE TO BE YOUR's".
━━━━━🟥🟧🟨🟩🟦🟪⬛━━━━━
❇️ Follow notification about periodical View
💥 Do Comment for Stock WEEKLY Level Analysis.🚀
📊 Do you agree with this view?
✈️ HIT THE PLANE ICON if this technical observation resonates with you. It will Motivate me.
━━━━━🟥🟧🟨🟩🟦🟪⬛━━━━━
💡 If You LOOKING any CHART & want for Level and ANALYZE?
Share your desired stock names in the comments below! I will try to analyze the chart Levels, patterns and share my technical view (so far my Knowledge).
If Viewers think It can identify meaningful setups. Looking forward to hearing from all of you — let's keep this discussion going and help each other make better trading decisions.
___________🔕^^^⚫⚪^🙏🏼🙏🏼🙏🏼^⚪⚫^^^🔔___________ Nifty50 View for Tomorrow | 02 July📊 NIFTY – 2H CHART ANALYSIS
CMP: 23,988
• The sharp recovery has slowed down. • Price is now moving inside a consolidation zone (23,800–24,250). • Buyers are holding the range, but they still haven't broken the upper boundary.
🟢 Bullish View
A sustained move above 24,250 can attract fresh buying.
If that happens, the next target is 24,500–24,600.
🔴 Bearish View
If 23,800 breaks on a closing basis, the range will fail.
That can lead to a move back towards 23,600–23,500.
My View
Right now, this is a waiting game.
The market has already made its recovery move. Now it's building a base.
Avoid trading in the middle of the range.
Let price break either side first, then trade with confirmation.
Key Levels 🟢 Support: 23,800 🔴 Resistance: 24,250
🎯 The next big move will come after this consolidation ends. Patience is the edge here. STT #hashtagIt's really frustrating to see the STT hike after April. The stock market is not easy like buying and selling regular goods. It demands time, patience, continuous learning, strategy, discipline, and most importantly, our hard-earned money. Even after putting in all that effort, we still have to deal with global events that are completely out of our control. I don't even have to mention what's been happening recently because of Trump's policies and their impact on the markets.
And now, on top of all that, we have another burden—our own government. Instead of helping businesses and encouraging investors, they act like a sleeping partner. They don't share the risk, don't support the growth, but they're always ready to take a bigger share of our money. It's like having an unavoidable partner you can't even divorce. Whether we make a profit or suffer a loss, they still demand more from us through taxes like STT.
Investing is already full of uncertainty. We take the risks, face the stress, and accept the losses when things go wrong. The least we expect is a government that supports growth instead of making it more expensive to participate. Sadly, this is the reality we have to deal with in our country. Nifty Broadening Wedge: Reversal Opportunity or Breakdown Risk?Nifty is currently trading inside a Broadening Wedge pattern on the 1-hour timeframe, a structure that often signals increasing volatility before a decisive move. Price has repeatedly respected both the rising resistance trendline and the declining support zone, making the current support area one of the most important levels for the coming sessions.
The chart shows multiple rejections from the upper resistance trendline around 24,200–24,300, indicating that sellers are still defending higher levels. On the downside, buyers have consistently stepped in near 23,750–23,800, preventing a deeper correction. This repeated interaction between support and resistance has created a clear broadening wedge, where the next breakout or breakdown could determine the short-term trend.
Bullish Scenario
If Nifty successfully defends the current support zone and forms a higher low, the index could witness another recovery toward the upper resistance trendline. A decisive breakout above 24,300–24,400 with strong momentum would invalidate the current bearish pressure and could trigger a fresh bullish rally.
Bearish Scenario
If the support trendline breaks decisively, the broadening wedge would fail. Such a breakdown may invite aggressive selling, with the index potentially slipping toward 23,600 initially, followed by a larger decline toward the 23,100 region as illustrated in the bearish projection.
Key Levels
Immediate Support: 23,750–23,800
Major Resistance: 24,250–24,400
Bullish Trigger: Sustained breakout above the resistance trendline
Bearish Trigger: Breakdown below the support trendline
Technical View
The overall structure remains neutral while price trades inside the wedge. Traders should avoid anticipating the move and instead wait for confirmation. A breakout above resistance would favor bullish continuation, whereas a breakdown below support could accelerate downside momentum. The current support zone is the key level that will likely decide Nifty's next major move. #NIFTY Intraday Support and Resistance Levels - 01/07/2026Nifty 50 is expected to open with a slight gap-up bias near the 23950 zone, with no major changes compared to the previous session. The index continues to trade within a consolidation range after witnessing sustained selling pressure from higher levels. As long as Nifty holds above the immediate support zone, the broader market structure remains stable, though traders should wait for a decisive breakout before taking aggressive positions.
For today's session, 24050–24100 remains the immediate buying zone. A sustained move above this range can trigger fresh buying momentum towards 24150, 24200, and 24250 levels. If Nifty manages to break and sustain above 24250, the rally may extend further towards higher resistance levels, indicating renewed bullish strength.
On the downside, 23950–23900 remains the key support zone for intraday traders. A decisive breakdown below this level may invite fresh selling pressure towards 23850, 23800, and 23750 levels. However, unless this support zone is breached convincingly, the index is likely to continue consolidating within the current range.
Overall, the market structure remains range-bound with a slight gap-up opening expected and no major changes from yesterday's levels. Traders should avoid aggressive trades inside the consolidation zone and wait for a confirmed breakout above 24050 for long opportunities or a breakdown below 23950 for short trades. Maintain strict stop-losses and consider partial profit booking at every target as intraday volatility may remain elevated. #BANKNIFTY Intraday PE & CE Levels(01/07/2026)Bank Nifty is expected to open with a slightly gap-up bias around the 57700–57750 zone after recovering from lower levels in the previous session. Although the index continues to trade below its immediate resistance, buying interest near support indicates that bulls are attempting to regain control. A sustained move above the key resistance levels will be crucial for confirming a fresh upside rally.
For today's session, 58050 remains the immediate breakout level to watch. A sustained move above this level can trigger fresh buying momentum towards 58250, 58350, and 58450+ levels. If Bank Nifty manages to cross and sustain above 58550, the bullish rally may extend further towards 58750, 58850, and 58950+ levels.
On the downside, 57950–57900 remains the key intraday resistance zone for fresh PE opportunities. Any rejection from this area may lead to profit booking towards 57750, 57650, and 57550 levels. If the index slips below 57450, selling pressure may intensify further, dragging Bank Nifty towards 57250, 57150, and 57050 levels. Nifty Intraday Outlook 01-07-2026NIFTY Intraday Setup — Key Levels to Watch
NIFTY is currently trading near 23,900-23920, and the chart is showing a clear decision zone.
Price has rejected from the upper side and is now trading below the Immediate Supply Zone: 23,930–23,960. Until NIFTY gives a strong 15-min close above this zone, buyers should stay careful.
________________________________
Bullish Plan
Bullish momentum only above 23,960.
If NIFTY sustains above this level, upside can open toward:
Target 1: 24,020
Target 2: 24,120
This will confirm that buyers are reclaiming the supply zone.
________________________________
Bearish Plan
Weakness continues below 23,860.
If NIFTY breaks and sustains below this level, downside can open toward:
Target 1: 23,800
Target 2: 23,700
The 23,825–23,800 zone is an important demand zone. A bounce from here is possible, so avoid fresh shorts near demand without confirmation.
________________________________
Final View
NIFTY is still in a sideways-to-bearish structure below 23,960.
Best trade will come only after a clean breakout above supply or breakdown below support.
Trade the level, not the emotion.