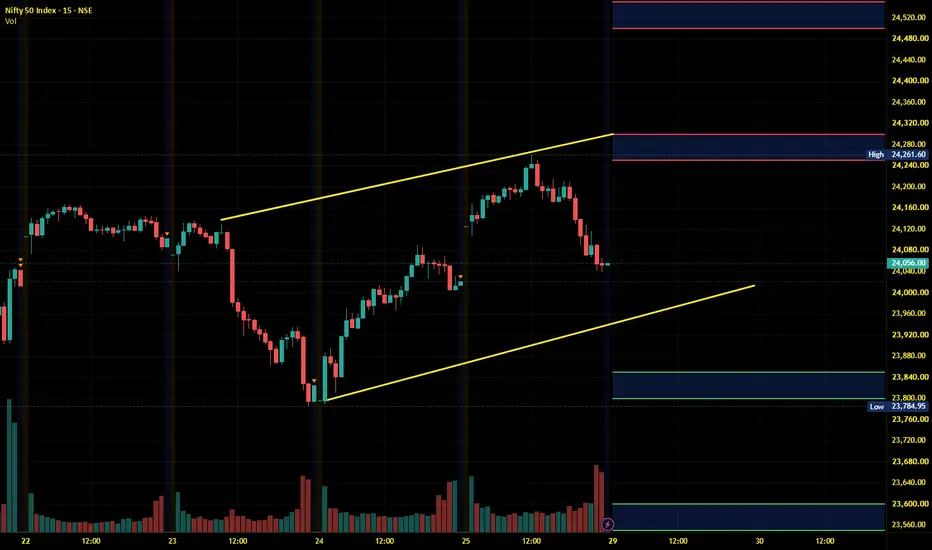
NIFTY 15-Min Outlook 30-06-2026: Bounce or Trap ?NIFTY 15-Min Outlook: Bounce or Trap?
Nifty has taken a sharp bounce from the 23,925 support zone with strong volume, but the trend is not fully bullish yet.
_____________________________
The real test is near 23,980–24,000.
If Nifty gives a strong 15-min close above 24,000, then upside can open towards:
T1: 24,050
T2: 24,100–24,120
_____________________________
But if price rejects from 24,000, sellers may again push Nifty back towards:
T1: 23,925
T2: 23,880
T3: 23,780 demand zone
_____________________________
Key Levels
Resistance: 23,980–24,000 / 24,050 / 24,120
Support: 23,925 / 23,880 / 23,780
_____________________________
Trade Plan
Bullish only above 24,000 with confirmation.
Bearish below 23,925 or rejection from resistance.
Avoid trading inside 23,925–24,000, because this zone can create premium decay and fake moves.
_____________________________
Important:
Nifty is at a decision point. Let price confirm the breakout or rejection before entering.
_____________________________
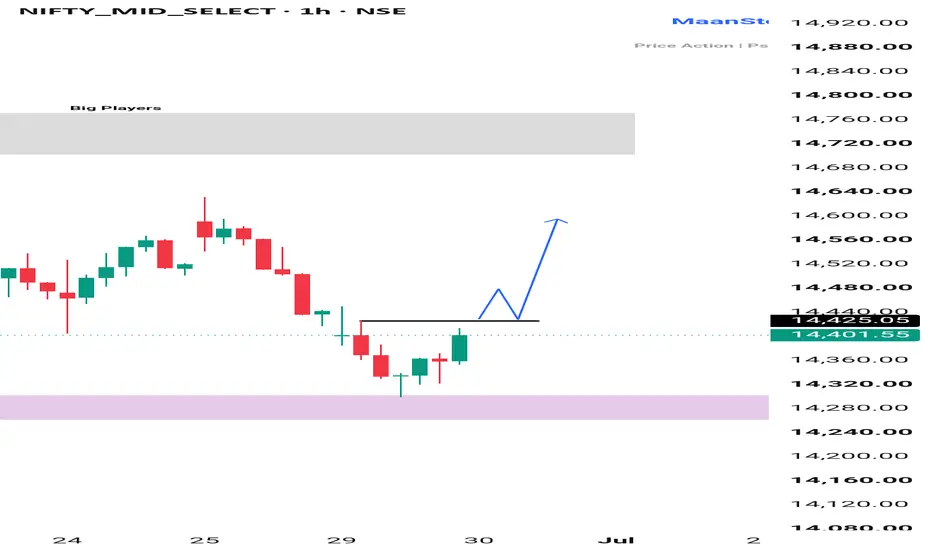
Educational view only. Not a buy/sell recommendation. MIDCAP NIFTY ANALYSIS FOR TUESDAY 📊 MIDCAP NIFTY – Monthly Expiry Outlook (30 June)
CMP: 14,402
🔹 Midcap Nifty has bounced from the 14,280–14,320 demand zone. The next move depends on whether buyers can reclaim the breakout level.
Bullish View 🟢
• Demand zone should continue to hold.
• A break and hourly close above 14,425 can attract fresh buying.
• Upside targets: 14,550–14,600.
Bearish View 🔴
• If 14,280 breaks on a closing basis, the structure turns weak.
• Downside targets: 14,200–14,100.
⚠️ Expiry Reminder:
Midcap can stay range-bound until the breakout comes. Don't rush trades inside the range.
Key Levels
🟢 Demand Zone: 14,280–14,320
🔵 Breakout Level: 14,425
🚀 Above 14,425 → 14,550–14,600
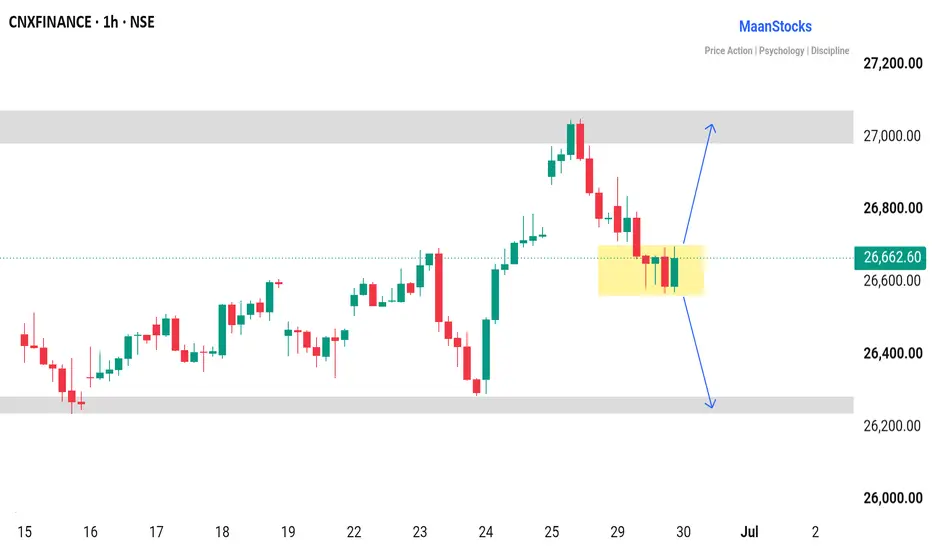
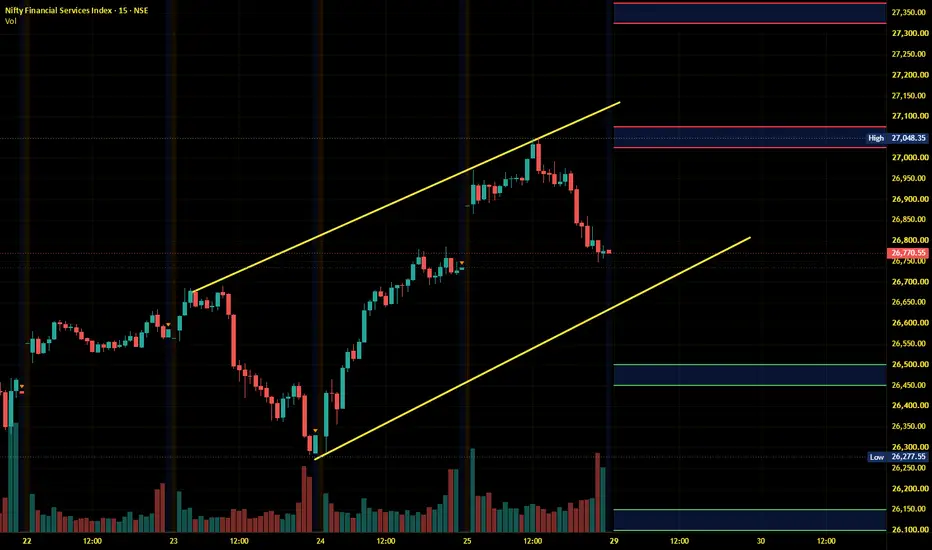
📉 Below 14,280 → 14,200–14,100 FINNIFTY VIEW FOR 30 JUNE🏦 FINNIFTY – Monthly Expiry Outlook (30 June)
CMP: 26,663
🔹 FINNIFTY is consolidating inside the 26,550–26,750 zone. Tomorrow's expiry move will likely begin after price breaks this range.
Bullish View 🟢
• Hold above the consolidation zone.
• A breakout and sustained move above 27,100 can trigger fresh buying.
• Upside targets: 27,300–27,500.
Bearish View 🔴
• A breakdown below 26,550 will weaken the short-term structure.
• Downside targets: 26,350–26,200.
⚠️ Expiry Reminder:
Avoid trading inside the range. Let the breakout or breakdown confirm first.
Key Levels
🟡 Consolidation: 26,550–26,750
🔵 Resistance: 26,900–27,100
🚀 Above 27,100 → 27,300–27,500
📉 Below 26,550 → 26,350–26,200 NIFTY 50 | Monthly Expiry Day Trading Plan | 30-Jun-2026🗺️ KEY LEVELS AT A GLANCE
🔴 Strong Resistance : 24,351
🔴 Last Intraday Resistance : 24,188
🟠 Opening Resistance : 24,092
🔵 Previous Close (CMP) : 23,978.50
🟨 Opening Support / Resistance Zone : 23,932 – 23,971
🟩 Last Intraday Support Zone : 23,842 – 23,887
🟢 Buyer's Support / Reversal Zone : 23,655 – 23,723
⚡ TODAY IS MONTHLY EXPIRY — Volatility will be elevated. Premiums are inflated at open. Options buyers must be quick and disciplined. Theta decay accelerates sharply after 12:30 PM. Never trade without a pre-defined stop loss on expiry day!
🟢 SCENARIO 1 — GAP UP OPENING (100+ Points | Opens Above 24,078+)
📖 What Does This Mean?
A Gap Up of 100+ points on Monthly Expiry day means Nifty opens directly at or above the Opening Resistance level of 24,092. This is a very significant level marked on the chart. When the market gaps up into a resistance zone, it creates two possibilities —
💪 Bulls are strong enough to push through 24,092 → 24,188 → 24,351
😤 Bears defend the resistance and price falls back to fill the gap
The key here is PATIENCE. Do not buy calls blindly at open just because market is green. Let the price PROVE itself above 24,092 first.
📍 SUB-SCENARIO A — Gap Up + Sustains Above 24,092 ✅ (Bullish Breakout)
📌 Condition : Market opens 100+ points up AND sustains above 24,092 for at least 2 consecutive 15-min candles with good buying volume
📌 What Happens : When 24,092 is held as support after gap up, it signals institutional buying and short covering. The next natural targets become 24,188 and then 24,351.
📌 Action → BUY CALL
🎯 Entry Zone : 24,100 – 24,120 (on retest of 24,092 as support)
🎯 Target 1 : 24,188 (Book 40% quantity here)
🎯 Target 2 : 24,280
🎯 Target 3 : 24,351 ✅ Exit Full Position
🛑 Stop Loss : 23,980 (below 24,092 breakdown = exit immediately)
📊 Risk Reward : 1 : 2.5
🎟️ Strike : 24,100 CE or 24,200 CE (ATM preferred)
⏰ Time Rule : If target 1 not hit by 11:30 AM → exit 50% position
📖 Educational Note : The zone from 24,092 to 24,351 is approximately 259 points. On expiry day, this kind of move can deliver 3x–5x returns on ATM call options if executed correctly. The key is entering on a RETEST of 24,092 as support — not chasing the open price.
📍 SUB-SCENARIO B — Gap Up + Fails at 24,092 ❌ (Rejection / Fade the Gap)
📌 Condition : Market opens 100+ points up BUT shows reversal candles at 24,092 and price starts falling back below 24,050
📌 What Happens : Gap up into resistance + failure to hold = trapped bulls. This triggers stop loss hunting and a fast reversal back toward the opening zone of 23,932–23,971. This is one of the most powerful setups on expiry day.
📌 Action → BUY PUT
🎯 Entry Zone : 24,030 – 24,050 (on breakdown confirmation below 24,092)
🎯 Target 1 : 23,971 – 23,932 (Book 40% here)
🎯 Target 2 : 23,887 – 23,842
🎯 Target 3 : 23,723 ✅ Exit Full Position
🛑 Stop Loss : 24,150 (recovery above 24,092 = exit)
📊 Risk Reward : 1 : 3
🎟️ Strike : 24,000 PE or 23,900 PE
⏰ Time Rule : Exit all puts before 1:00 PM if targets not achieved
📖 Educational Note : "Fade the Gap" is one of the highest probability expiry day strategies. When price gaps up into a known resistance and fails, the downward move is fast and sharp because all the buyers who bought at open start exiting simultaneously. The move from 24,092 back to 23,723 is ~369 points — a highly rewarding PUT opportunity.
⚠️ Gap Up Trap Warning
🔴 If market opens above 24,200 directly (extreme gap up) — DO NOT buy calls at open. Wait for a pullback to 24,092 or 24,050 before entering. Buying at extreme highs on expiry = very high risk of IV crush and fast reversal losses.
➡️ SCENARIO 2 — FLAT OPENING (Within ±50 Points | 23,928 – 24,028)
📖 What Does This Mean?
A flat opening is actually the BEST scenario for a technical trader. When Nifty opens near previous close of 23,978, there is no overnight bias. Price is sitting right inside the Opening Support/Resistance Zone of 23,932–23,971 — the most important decision zone on the chart today.
The market will spend the first 15–30 minutes discovering direction. This gives traders the cleanest breakout or breakdown setup of all three scenarios. The rule is simple —
✅ Above 24,092 = Bulls take control
❌ Below 23,842 = Bears take control
📍 SUB-SCENARIO A — Flat Open + Breaks Above 24,092 ✅ (Bullish)
📌 Condition : Market opens flat near 23,978 and within first 30 minutes breaks above 24,092 with strong bullish candles and volume pickup
📌 What Happens : Breaking above 24,092 (Opening Resistance) with momentum on expiry day signals that buyers are aggressive. This breakout can quickly carry price to 24,188 and then 24,351.
📌 Action → BUY CALL
🎯 Entry Zone : 24,095 – 24,120 (breakout candle close above 24,092)
🎯 Target 1 : 24,188 (Book 50% here — strong resistance)
🎯 Target 2 : 24,280
🎯 Target 3 : 24,351 ✅ Exit Full Position
🛑 Stop Loss : 23,980 (back below 24,000 = exit)
📊 Risk Reward : 1 : 3
🎟️ Strike : 24,100 CE or 24,200 CE
⏰ Time Rule : Enter only if breakout happens before 11:00 AM for maximum premium benefit
📖 Educational Note : On expiry day, breakout trades work best when they happen in the first 1–2 hours of market opening. A breakout at 9:45 AM gives you enough time for the move to play out before theta decay starts eating your premium after 12:30 PM. Timing of entry is equally important as the level itself.
📍 SUB-SCENARIO B — Flat Open + Breaks Below 23,842 ❌ (Bearish)
📌 Condition : Market opens flat and within first 30–45 minutes breaks below 23,842 (Last Intraday Support Zone lower end) with bearish momentum
📌 What Happens : The Last Intraday Support zone of 23,842–23,887 is a key cluster visible on chart. If price breaks below 23,842 with volume, it confirms bears are in control and the Buyer's Reversal Zone at 23,655–23,723 becomes the target.
📌 Action → BUY PUT
🎯 Entry Zone : 23,820 – 23,840 (on candle close below 23,842)
🎯 Target 1 : 23,723 (Book 40% here)
🎯 Target 2 : 23,655 ✅ Exit Full Position
🛑 Stop Loss : 23,920 (recovery above 23,887 = exit)
📊 Risk Reward : 1 : 3.5
🎟️ Strike : 23,800 PE or 23,700 PE
⏰ Time Rule : If T1 not hit by 12:30 PM → exit completely, do not hold into afternoon
📖 Educational Note : The zone 23,842–23,887 has been a support cluster from previous sessions. Breaking this zone convincingly means sellers have overpowered buyers completely. The next zone 23,655–23,723 is the Buyer's Reversal Zone — meaning this is where strong demand is expected. Book profits here and do not hold hoping for more downside.
📍 SUB-SCENARIO C — Flat Open + Stays Rangebound (No Clear Direction)
📌 Condition : Market opens flat and stays inside 23,932 – 24,050 for more than 45 minutes with no clear breakout
📌 Action → STAY OUT or consider premium selling (experienced traders only)
🎟️ Strategy : Short Strangle or Iron Condor
📌 Sell Call : 24,200 CE
📌 Sell Put : 23,700 PE
🛑 Adjustment : If Nifty moves 150+ points in any direction — exit one leg
⚠️ Risk Level : High — Only for experienced traders with adequate margin
📖 Educational Note : Rangebound expiry days are a premium seller's paradise. When IV is high at open and market stays flat, both call and put premiums decay rapidly. However, beginners should simply stay on the sidelines when there is no clear direction. Protecting capital is more important than forcing a trade.
🔴 SCENARIO 3 — GAP DOWN OPENING (100+ Points | Opens Below 23,878 or Lower)
📖 What Does This Mean?
A Gap Down of 100+ points means Nifty opens directly inside or near the Last Intraday Support Zone of 23,842–23,887. This is an extremely critical level. When the market gaps down into a support zone on expiry day, it triggers two reactions —
😱 Panic selling continues and support breaks → Sharp fall to Buyer's Zone 23,655–23,723
💪 Smart money absorbs selling and reversal kicks in → Fast gap fill rally toward 23,978 → 24,092
Both give excellent trading opportunities but require patience and confirmation. This is NOT the time to panic or chase.
📍 SUB-SCENARIO A — Gap Down + Sustains Below 23,842 ❌ (Bearish Continuation)
📌 Condition : Market opens 100+ points down AND the first 15-min candle closes below 23,842 without any recovery attempt. Selling pressure remains visible.
📌 What Happens : Sustaining below the Last Intraday Support Zone of 23,842 signals that bears are firmly in control. The next major destination is the Buyer's Reversal Zone at 23,655–23,723 — approximately 200+ points lower.
📌 Action → BUY PUT
🎯 Entry Zone : 23,820 – 23,842 (on retest of 23,842 as resistance from below)
🎯 Target 1 : 23,723 (Book 50% here — Reversal Zone begins)
🎯 Target 2 : 23,655 ✅ Exit Full Position
🛑 Stop Loss : 23,920 (recovery above 23,887 = plan invalid)
📊 Risk Reward : 1 : 2.5
🎟️ Strike : 23,800 PE or 23,700 PE (ATM/ITM preferred)
⏰ Critical Rule : Exit ALL puts before 1:00 PM regardless of targets
📖 Educational Note : On gap down expiry days, PUT premiums are already elevated at open due to high implied volatility. This means even if price falls in your direction, the returns may be lower than expected due to IV crush. This is why ITM or ATM puts are preferred over OTM puts — they have more intrinsic value and are less affected by IV changes.
📍 SUB-SCENARIO B — Gap Down + Recovers Above 23,887 ✅ (Reversal / Gap Fill Trade)
📌 Condition : Market opens 100+ points down near 23,842–23,887 zone BUT within first 30 minutes starts showing strong buying candles and closes above 23,887
📌 What Happens : This is the classic GAP FILL setup. When smart money steps in to buy at support, short sellers start covering their positions. This short covering creates a fast and explosive rally. The gap fill from 23,842 back to 23,978 is ~136 points and toward 24,092 is ~250 points.
📌 Action → BUY CALL (Gap Fill Trade)
🎯 Entry Zone : 23,890 – 23,920 (on candle close above 23,887)
🎯 Target 1 : 23,971 – 23,978 (Book 40% here)
🎯 Target 2 : 24,050
🎯 Target 3 : 24,092 – 24,120 ✅ Exit Full Position
🛑 Stop Loss : 23,780 (back below 23,842 = exit immediately)
📊 Risk Reward : 1 : 2.5
🎟️ Strike : 23,900 CE or 24,000 CE
⏰ Time Rule : This trade ideally completes before 12:00 PM
📖 Educational Note : Gap fill trades on expiry are among the most powerful intraday moves. When market gaps down 100+ points and then reverses, it creates a DOUBLE squeeze — put sellers who sold at close now scramble to buy back, and fresh call buyers add fuel. This can move Nifty 150–250 points in just 45–60 minutes. But WAIT for the 23,887 reclaim before entering.
📍 SUB-SCENARIO C — Extreme Gap Down (200+ Points | Opens Near 23,723–23,655)
📌 Condition : Market opens 200+ points down directly at the Buyer's Reversal Zone 23,655–23,723
📌 Action → DO NOT buy puts at extreme lows. Look for reversal confirmation only.
🎯 Reversal Entry : 23,730 – 23,760 (only if strong green candle forms)
🎯 Target 1 : 23,842
🎯 Target 2 : 23,932 ✅ Exit Full Position
🛑 Stop Loss : 23,620
⚠️ Quantity : 25-50% of normal position size only
🎟️ Strike : 23,800 CE or 23,900 CE
📖 Educational Note : Buying puts at a 200+ point gap down extreme low is one of the most dangerous trades on expiry day. The option premium is massively inflated and even a 100-point recovery against your position can wipe 60–70% of premium instantly. If you missed the move — you missed it. DO NOT CHASE. There will always be another trade.
🛡️ RISK MANAGEMENT TIPS FOR OPTIONS TRADING
📖 These rules are not optional — they are the difference between consistent traders and blown accounts.
🔹 The 2% Rule : Never risk more than 2% of your total trading capital in a single trade. If capital is ₹3,00,000 — max loss per trade = ₹6,000. Non-negotiable.
🔹 The 1 PM Expiry Rule : On expiry day, if your option buy position is NOT showing profit by 1:00 PM — EXIT. Time decay after 1 PM is brutal and can turn a small loss into a 80–90% loss in premium.
🔹 No Averaging Rule : Never add to a losing option position on expiry day. If trade hits stop loss → Accept the loss. Move on. The market will give another opportunity.
🔹 Strike Selection Rule : Always trade ATM ± 100 strikes on expiry. Avoid buying 24,300 CE or 23,600 PE — these need extreme moves to become profitable and have near-zero value at expiry.
🔹 Hard Stop Loss Rule : Use your broker's stop loss order — not mental stops. Expiry day moves happen in seconds. By the time you decide to exit manually, the damage is already done.
🔹 Max Daily Loss Rule : Before market opens — decide your maximum loss for the day. Once that number is hit → Close everything and walk away. No revenge trading ever.
🔹 Position Sizing by Confidence :
✅ High Confidence Setup : 100% of planned position
⚠️ Medium Confidence Setup : 50% of planned position
🚫 Low Confidence Setup : 25% or SKIP the trade
🔹 Time of Entry Matters : Best entries are between 9:30 AM – 11:00 AM. Trades entered after 12:00 PM on expiry day have very low reward potential because theta decay starts dominating price action.
🔹 Do Not Hold Overnight Greeks : This is expiry day — all positions MUST be closed before 3:15 PM. Carrying options to next day from expiry makes no sense as they will expire worthless.
🔹 Post Trade Journal : After market close — write what worked, what failed, what you did right and what mistake you repeated. This single habit will improve your trading more than any indicator.
📋 SUMMARY & CONCLUSION
🧠 The Big Picture for 30-Jun-2026 — Nifty Monthly Expiry
Nifty 50 closed at 23,978.50 on 29-Jun-2026. It sits right inside the Opening Support/Resistance Zone of 23,932–23,971 — making tomorrow a true knife-edge expiry day. The market is perfectly balanced between bulls and bears at this level.
📊 Complete Level Summary
🔴 Strong Resistance : 24,351 — Final Bull Target
🔴 Intraday Resistance : 24,188 — First Major Hurdle
🟠 Opening Resistance : 24,092 — Key Pivot Above
🔵 Previous Close : 23,978.50
🟨 Opening Zone : 23,932 – 23,971 — Decision Zone
🟩 Intraday Support : 23,842 – 23,887 — Key Bear Confirmation
🟢 Buyer Reversal Zone : 23,655 – 23,723 — Strong Demand Area
📊 Scenario Quick Reference
Gap Up 100+ → Watch 24,092 | CE if holds | PE if rejects
Flat Open → Watch 24,092 above | 23,842 below | Trade breakout
Gap Down 100+ → Watch 23,887 | PE if sustains below | CE on recovery
Key Pivot → 24,092 above = Bulls | 23,842 below = Bears
Big Bull Move → 24,188 → 24,351
Big Bear Move → 23,723 → 23,655
🎯 Final Thoughts
🔹 The most important level of the day is 24,092 on upside and 23,842 on downside
🔹 Flat opening gives the cleanest and highest reward setups — be ready for it
🔹 First 15–30 minutes = OBSERVE ONLY. Do not trade in first candle
🔹 Monthly expiry is the most volatile expiry of the month — respect the risk
🔹 Protect capital first. Profits will follow discipline.
🔹 One good trade executed perfectly is better than five random trades
🔹 If confused about direction — the best trade is NO TRADE
💬 "The market rewards patience and punishes impulsiveness — especially on expiry day."
Trade with a plan. Exit with discipline. Live to trade another day! 💪📈
⚠️ IMPORTANT DISCLAIMER
📌 I am NOT a SEBI-registered Research Analyst or Investment Advisor.
📌 This content is shared solely for EDUCATIONAL and INFORMATIONAL purposes. It should NOT be interpreted as a Buy, Sell, or Investment Recommendation.
📌 Options trading involves a HIGH DEGREE OF RISK and may not be suitable for every investor. You may lose your entire invested capital.
📌 Please consult a SEBI-registered Investment Advisor or Financial Advisor before making any investment or trading decisions.
📌 The author assumes NO RESPONSIBILITY for any financial losses or damages arising from the use of this information.
📌 All trading and investment decisions are made at YOUR OWN RISK.
💙 Found this helpful? Like 👍 | Comment your view 💬 | Follow for daily plans 🔔
📅 Plan Date : 30-Jun-2026 | Nifty 50 | Monthly Expiry Day
⏰ Analysis Time : 29-Jun-2026 | 23:38 IST
#Nifty #Nifty50 #MonthlyExpiry #OptionsTrading #TradingPlan #Expiry #NiftyOptions #TechnicalAnalysis #IndianMarkets #NSE #StockMarket #Trading #LearnTrading  Short
Short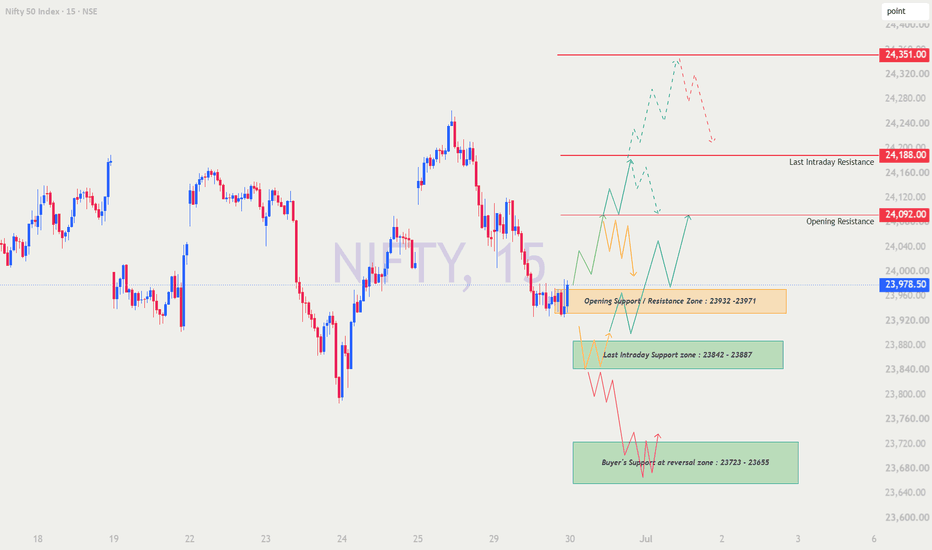
30-Jun-2026 | Bank Nifty | Monthly Expiry📊 KEY LEVELS FOR THE DAY
🔴 Strong Resistance : 58,478
🔴 Intraday Resistance : 58,171
🟠 Opening Pivot : 57,890
🔵 CMP (Prev Close) : 57,828
🟩 Support Zone : 57,369 – 57,427
🟢 Major Support : 56,874
⚡ Monthly Expiry = High Volatility | Trade only after confirmation | Theta kills option buyers after 1 PM
🟢 SCENARIO 1 — GAP UP (300+ Points | Opens Above 58,128)
📖 A 300+ gap up opens Bank Nifty directly near the 58,171 resistance zone. Two things can happen — breakout continuation OR rejection reversal. Wait for first 15-min candle to confirm direction.
▶️ IF SUSTAINS ABOVE 58,171 → BUY CALL
Entry : 58,200 – 58,250
Target 1 : 58,350
Target 2 : 58,478 ✅ Full Exit
Stop Loss : 58,050
Strike : 58,200 CE
R:R : 1:2
▶️ IF REJECTS AT 58,171 → BUY PUT
Entry : 57,850 – 57,890
Target 1 : 57,600
Target 2 : 57,369 ✅ Full Exit
Stop Loss : 58,100
Strike : 57,800 PE
R:R : 1:2.5
💡 Tip — Never chase extreme gap ups. Wait for retest of 58,171 before entering. Gap up + rejection = fast 800 point fall possible.
➡️ SCENARIO 2 — FLAT OPEN (Within ±100 Pts | 57,728 – 57,928)
📖 Flat opening is the cleanest setup. Market is sitting between resistance 57,890 and support 57,369. First 30 minutes will define direction. Trade the breakout or breakdown — do NOT anticipate.
▶️ IF BREAKS ABOVE 57,890 → BUY CALL
Entry : 57,900 – 57,950
Target 1 : 58,171 (Book 50%)
Target 2 : 58,478 ✅ Full Exit
Stop Loss : 57,700
Strike : 58,000 CE
R:R : 1:3
▶️ IF BREAKS BELOW 57,700 → BUY PUT
Entry : 57,650 – 57,700
Target 1 : 57,369 (Book 50%)
Target 2 : 56,874 ✅ Full Exit
Stop Loss : 57,900
Strike : 57,500 PE
R:R : 1:3.5
💡 Tip — 57,890 is the key pivot. Above it bulls win. Below 57,700 bears dominate. Flat open gives best Risk Reward trades of the day.
🔴 SCENARIO 3 — GAP DOWN (300+ Points | Opens Below 57,528)
📖 Gap down 300+ directly breaks the 57,369–57,427 support zone. Market can either continue falling toward 56,874 OR smart money reversal can trigger a sharp gap fill rally. First 15 min reaction is key.
▶️ IF SUSTAINS BELOW 57,369 → BUY PUT
Entry : 57,300 – 57,369
Target 1 : 57,100
Target 2 : 56,874 ✅ Full Exit
Stop Loss : 57,550
Strike : 57,200 PE (ATM/ITM)
R:R : 1:2
⏰ Exit all puts before 1:00 PM
▶️ IF RECOVERS ABOVE 57,427 → BUY CALL (Gap Fill Trade)
Entry : 57,450 – 57,500
Target 1 : 57,700
Target 2 : 57,890
Target 3 : 58,171 ✅ Full Exit
Stop Loss : 57,250
Strike : 57,500 CE
R:R : 1:3
💡 Tip — Gap fill trades on expiry are explosive. Short covering can move 500–700 points in 1–2 hours. But WAIT for 57,427 reclaim — do not buy blindly at lows.
🛡️ RISK MANAGEMENT TIPS
🔹 Never risk more than 2% capital per trade
🔹 Exit all option buys before 1:00 PM if not in profit
🔹 Never average a losing option position on expiry
🔹 Trade ATM ± 200 strikes only — avoid OTM lotto tickets
🔹 Set hard stop loss — no mental stops on expiry day
🔹 If daily max loss hit → Close screen. No revenge trading
🔹 Trade what you SEE not what you THINK
📋 QUICK SUMMARY
Gap Up → Watch 58,171 | CE above / PE on rejection
Flat → Watch 57,890 | CE above / PE below 57,700
Gap Down → Watch 57,369 | PE below / CE on recovery
Pivot → 57,890 | Bull above | Bear below
Big Move → 56,874 on downside | 58,478 on upside
🎯 First 15–30 min = Observe Only | Confirmation = Entry | Patience = Profit
⚠️ DISCLAIMER
I am NOT a SEBI Registered Analyst or Investment Advisor. This post is purely for Educational purposes only. Options trading involves substantial risk of loss. Please consult your SEBI registered financial advisor before trading. Trade at your own risk. The author holds no responsibility for any financial losses.
💙 If helpful → Like 👍 | Comment 💬 | Follow 🔔
#BankNifty #Expiry #OptionsTrading #TradingPlan #NSE  Short
Short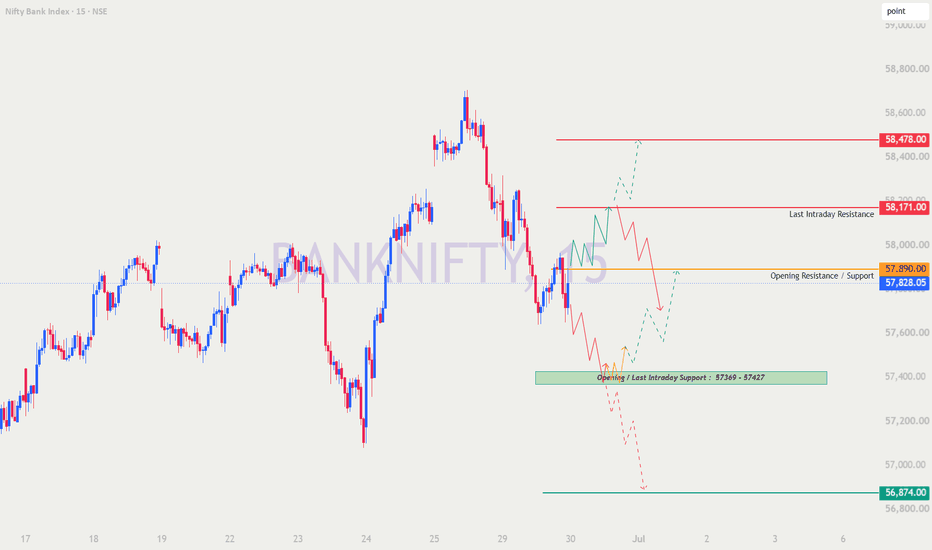
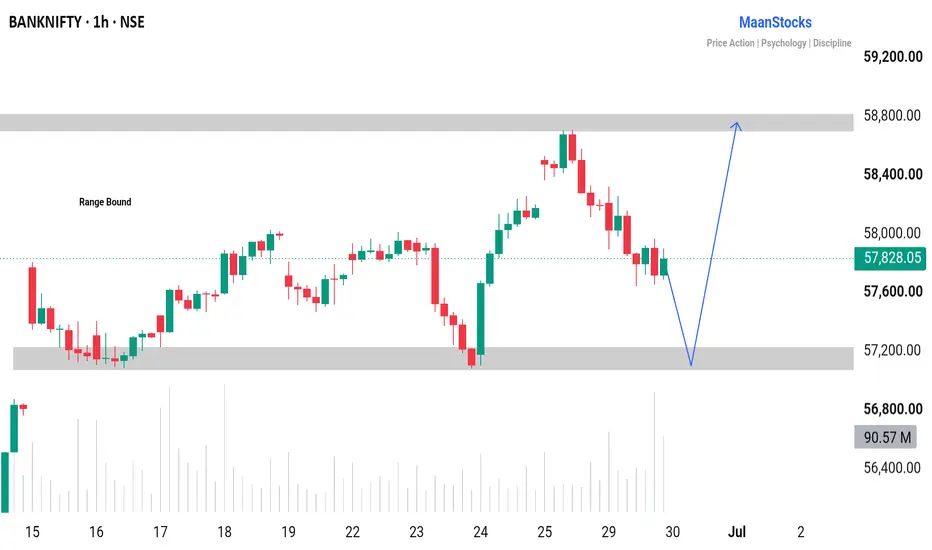
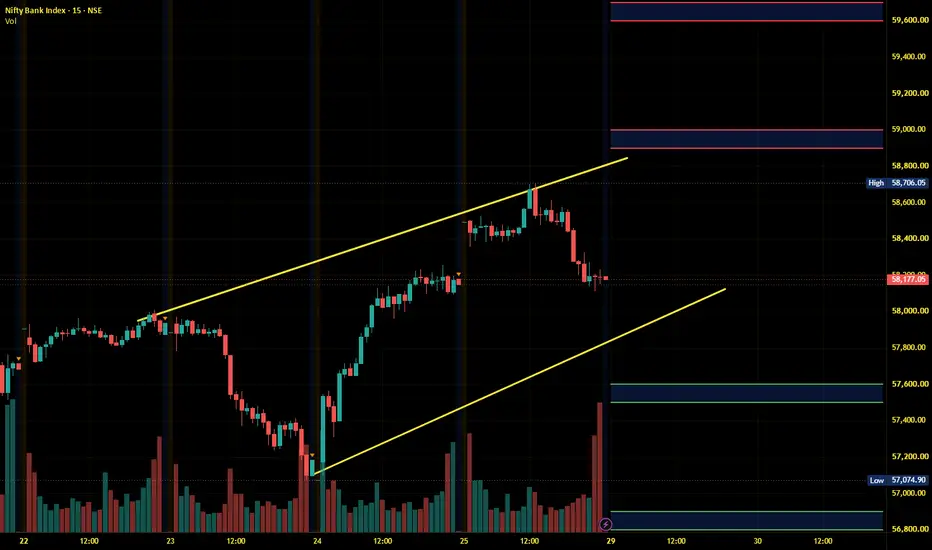
BANKNIFTY – Monthly Expiry Outlook for Tomorrow (30 June)🏦 BANKNIFTY – Monthly Expiry Outlook (30 June)
CMP: 57,828
🔹 Bank Nifty is trading inside a broad range. Tomorrow's move will depend on how price reacts near support.
Bullish View 🟢
• Strong support lies at 56,900–57,100.
• If this zone holds and buyers step in, expect a move back towards 58,800–59,000.
• A breakout and hold above 59,000 can extend the rally towards 59,300–59,500.
Bearish View 🔴
• A close below 56,900 will weaken the structure.
• Downside targets: 56,500–56,200.
⚠️ Expiry Reminder:
Bank Nifty can be extremely volatile on expiry. Wait for confirmation instead of predicting the move.
Key Levels
🟢 Support: 56,900–57,100
🔵 Resistance: 58,800–59,000
🚀 Above 59,000 → 59,300–59,500
📉 Below 56,900 → 56,500–56,200 SENSEX Analysis [For 30.06.2026: Tuesday]Probable Scenario Analysis of SENSEX for the 30th of June, 2026. The day is Tuesday.
🟢 Bullish Scenario
There is no observable bullish scenario. We have to doubt every up move. A bullish sign will emerge only if the price trades above 77500.
🔴 Bearish Scenario
Presently, the price is in a bearish scenario. If the price stays below 76750, then look for bearish trades only. A weak bearish target below 76750 is 76500. Level 76500 is weak support. Next, if the price breaks down below the level of 76500, then there will be a sharp fall. The probable bearish targets below the level of 76500 are - 76250 and 76000. There will be strong support at the level of 76000. Lastly, if the price breaks down below the level of 76000, then the probable bearish targets would be - 75750 and 75500. There is an unfilled gap till the level of 75500.
🟡 No Trading Zone (NTZ): (77500 - 76750).
⏺ Range of Consolidation (ROC): (77500 - 76500).
Here, 77000 is the median of ROC. The median works like a sentiment. The price trading above the median would offer bullish sentiment, while the price trading below the median would trigger bearish sentiment.
● Event
There is no high-impact event this week. However, there is the U.S. Independence Day Holiday on Friday (03rd of July). On Tuesday (30th of June), there will be Nifty 50 (all derivative contracts in NSE) expiry. Therefore, we can expect a price anomaly till Tuesday.
● Intraday Bias
Establish intraday bias with respect to the opening price. If the price sustains above the opening price, then don't think of shorting. Look for bullish trades only. On the contrary, if the price sustains below the opening price, then don't think of going long. Look for bearish trades in that case.
● Top-Down Analysis
- Monthly TF: A green spinning top inside the candles of the last four months. The view is indecision.
- Weekly TF: Three-week candle combination looks like a rounding top. Level 77500 is a strong resistance. No bullish trade seems doable unless price trades above 77500. Level 77000 is an additional resistance level. Level 76000 seems to be a strong support. The view is indecision.
- Daily TF: For 10 days, the price is in a range-bound consolidation. The consolidation looks like a rounded top. Levels 77500 and 77000 are strong resistance. Level 76500 seems to be weak support. If the price breaks down below the level of 76500, then there might be a sharp sell-off till the level of 76000. The view is indecisive.
- 30-minute TF: The price is in a range-bound consolidation. There is no observable trend. The view is indecision.
● Disclaimer + End Note
- All the analyses would fail in the case of a major gap up, gap down, or price structure anomaly. Thus, practice PRAGMATISM in the live session.
- Trade only if there is a set-up. Remember, not trading is an extension of the trading activity.
- Mark your points. Trade your points. Price is GOD. Anything can happen in the markets. Thus, trade what you see, not what you believe.
- Always PRACTICE RISK MANAGEMENT. Always PROTECT YOUR CAPITAL. Be RESPONSIBLE.
- Be Strategic. Be Courageous. Be Patient. Be Wise.
- Every day is a new day. Thus, do not carry the baggage of past successes or failures. Leave the gardens of winning and losing. Establish yourself in equanimity. Always think from a new perspective.
- Let the joy of trading drive your effectiveness, not greed or fear. Believe in Possibilities.
Happy Trading! BANKNIFTY Technical Analysis | Bullish ascending channelThe chart displays a bullish ascending channel with black upward-sloping trendlines. Price is consolidating near the middle/upper part of the channel after a pullback from higher levels. Overall structure remains positive as long as it holds above the lower channel line.
Recommended Levels:
Buying Level (Entry/Support): 57,500 - 57,650
(Near the lower ascending trendline and recent reaction zone — good dip-buying opportunity)
Weakness Level (Stop Loss / Breakdown): Below 57,200 - 57,000
(Break below the ascending channel support would signal weakness and potential deeper correction)
Targets:
Short-term Target 1: 58,000 - 58,200
Short-term Target 2: 58,500 - 58,700
Extended Target: 59,000+ (Upper channel projection / previous highs)
Note: These levels are derived from the visual chart analysis combined with standard support/resistance data. Always combine with volume, overall market sentiment, and your risk tolerance. Not financial advice — trade responsibly. Long 
NIFTY 50 | WEEKLY STRUCTURAL ANALYSISINTRODUCTION
NIFTY 50 continues operating within a broader Under Pressure structure while recovery participation develops around the Behavioural Pivot Zone. Recent price action continues to stabilize above support, reflecting improving participation, although broader structural pressure has not yet been removed.
STRUCTURE
Structure: Under Pressure
Structural Phase: Recovery
MARKET CONTEXT
Current Position: Below Structural Pivot Zone
Structural Area: Behavioural Pivot Zone
Participation: Recovery Active
Interpretation: Recovery continues below the Structural Pivot Zone while participation gradually improves within the current pressure structure.
KEY LEVELS
Resistance Zone: 26,000 – 26,400
Structural Pivot Zone: 24,500 – 25,000
Behavioural Pivot Zone: 23,800 – 24,200
Support Zone: 22,300 – 23,000
Structural Base: 21,300 – 21,700
STRUCTURAL TRIGGERS
Continuation: Acceptance above the Structural Pivot Zone.
Review: Acceptance below the Support Zone.
STRUCTURAL INTERPRETATION
NIFTY continues to recover while trading within the Behavioural Pivot Zone and below the Structural Pivot Zone. The recent stabilization suggests recovery participation remains active, but it does not yet represent a structural transition.
The Behavioural Pivot Zone continues to serve as the immediate participation area, while the Structural Pivot Zone remains the primary reference for determining whether recovery evolves into broader structural improvement.
Until acceptance is established above the Structural Pivot Zone, the broader market structure continues to remain under pressure.
EDUCATIONAL INSIGHT
Recovery within a pressure structure should not automatically be interpreted as a trend reversal.
Structural improvement is confirmed through market acceptance at important structural reference zones rather than by short-term price advances alone.
CLOSING THOUGHT
Recovery participation continues to strengthen.
The Structural Pivot Zone remains the key reference for confirming broader structural improvement.
Observe structure before changing bias.
EDUCATIONAL DISCLAIMER
This publication is an educational structural market study. It does not constitute investment advice, financial advice, trading advice, or a prediction of future market direction. The observations presented reflect structural market behaviour at the time of publication.
#NIFTY50 #NIFTY #NSE #IndianMarkets #MarketStructure #StructuralAnalysis #TechnicalAnalysis #PriceAction #TradingView
Structure → Level → Trigger → Probability
Analyze. Educate. Empower. #NIFTYCurrent Close: 23,946.25, down 109.75 points (-0.46%).
Trend Context: The weekly candle (1W) shows the market trading with a negative bias for the session, down from an opening of 24,061.75.
Immediate Resistance: The intraday high sits at 24,120.00, which matches closely with a minor psychological barrier at 24,100–24,120.
Immediate Support: The day's low was registered at 23,924.55. Looking at the indicator overlays (Nimblr Levels), major support targets are clustered much lower if this zone breaks, with structural levels noted down at 23,464.35 (LSL) and 23,326.65 (T1). NIFTY ANALYSIS | TUESDAY, 30 JUNE 2026 | 4H →1H→15-MIN→5-MIN TF# 📊 NIFTY ANALYSIS | TUESDAY, 30 JUNE 2026 | 4H → 1H → 15-MIN → 5-MIN TF 🔥
# 🚨 FINAL VERDICT
## Market Bias
🔴 **Bearish below 24,000**
🟢 **Bullish only above 24,060**
NIFTY ended the previous session at **23,946.25**, down **109.75 points (-0.46%)**, after failing to sustain above **24,000**. Sellers controlled most of the trading day, while the closing recovery remained weak and failed to reclaim key moving averages.
Since **30 June is weekly expiry**, expect higher volatility, aggressive premium decay, and sudden short-covering rallies.
---
# 📊 Institutional Summary
* **Market Regime:** Bearish with expiry volatility
* **Control:** 🔴 Sellers
* **Previous Day OHLC**
* Open: **24,061.75**
* High: **24,120.00**
* Low: **23,924.55**
* Close: **23,946.25**
### Immediate Resistance
* **24,000**
* **24,060**
* **24,120**
### Immediate Support
* **23,925**
* **23,880**
* **23,820**
### Trader Action
Do not chase the first expiry candle.
Allow the first **15-minute candle** to complete.
Expiry has a habit of rewarding patience and charging impatience at premium rates.
---
# 📈 Probability Matrix
🟢 Bullish : **30%**
🟡 Sideways : **25%**
🔴 Bearish : **45%**
---
# 🟢 HIGH PROBABILITY CE TRADE
## CE Strategy
Buy CE only if bulls reclaim the psychological **24,000** level.
### Entry
15-minute close above
**24,000**
Confirmation
5-minute retest holding above
**23,985**
### Stop Loss
23,945
### Targets
Target 1
24,060
Target 2
24,120
Target 3
24,180
Risk Reward
Approximately
1 : 2
### Invalidation
15-minute close back below
23,975
---
## Institutional Logic
A move above **24,000** would indicate buyers absorbing heavy call writing near the ATM strike.
Only then can short covering push the index toward **24,120**.
---
# 🔴 HIGH PROBABILITY PE TRADE
## PE Strategy
Preferred setup.
### Entry
15-minute close below
23,925
Confirmation
5-minute pullback rejection below
23,940
### Stop Loss
23,980
### Targets
Target 1
23,880
Target 2
23,820
Target 3
23,760
Risk Reward
Around
1 : 2.3
### Invalidation
15-minute close above
24,000
---
## Institutional Logic
The previous session broke below 24,000 and closed near the day's lower range.
If **23,925** fails again, expiry-related put momentum can accelerate quickly toward **23,800**.
---
# 📊 OPTION CHAIN ANALYSIS
## Weekly Expiry
**30 June 2026**
### ATM Strike
24,000
### Key Option Zones
**Highest Call Activity**
24,000
24,100
24,200
**Highest Put Activity**
23,900
23,800
### Max Pain
Near
24,000
---
## Institutional Interpretation
* Above **24,000** short covering may begin.
* Below **23,900** put writers may exit aggressively.
* Expect fake breakouts during the first hour.
---
# 📈 4H ANALYSIS
Trend remains corrective.
Price is still trading below recent swing resistance while remaining above major June swing support.
Momentum has weakened considerably.
The broader structure has shifted from bullish to neutral.
---
# 📉 1H ANALYSIS
Trend
Bearish
Price
Below 20 EMA
Momentum
Weak
Resistance
24,000
24,060
Support
23,925
23,820
Unless 24,000 is reclaimed, every bounce may attract fresh selling.
---
# ⏱️ 15-MINUTE TRADE FRAMEWORK
## Resistance
24,000
24,060
24,120
## Support
23,925
23,880
23,820
---
## Bullish Trigger
15-minute close above
24,000
## Bearish Trigger
15-minute close below
23,925
---
## No Trade Zone
23,925
to
24,000
---
# ⚡ 5-MIN EXECUTION PLAN
## CE Buyers
✔ Wait for breakout above 24,000
✔ Wait for successful retest
✔ Enter only after volume confirmation
Avoid buying if breakout volume is weak.
---
## PE Buyers
✔ Wait for breakdown below 23,925
✔ Enter after failed pullback
✔ Book partial profits near 23,880
Trail remaining quantity.
---
# 🧠 MARKET PSYCHOLOGY
Retail traders are likely to buy every green candle hoping for an expiry rally.
Institutions often use expiry to create sharp moves in both directions before revealing the actual trend.
The first hour is usually designed to confuse everyone equally. Quite democratic, really.
---
# 📌 TRADING DAY SCENARIOS
## Scenario 1
🔴 Bearish Breakdown
Probability
45%
Trigger
Below
23,925
Targets
23,880
↓
23,820
↓
23,760
---
## Scenario 2
🟡 Range-bound Expiry
Probability
25%
Range
23,925
to
24,000
Avoid aggressive option buying inside this range.
---
## Scenario 3
🟢 Bullish Short Covering
Probability
30%
Trigger
Above
24,000
Targets
24,060
↓
24,120
↓
24,180
---
# 🚫 INVALIDATION LEVELS
Bearish View Invalid
Above
24,000
on sustained 15-minute closing.
Bullish View Invalid
Below
23,925
on sustained acceptance.
---
# 🔥 TRADER NOTE
## Key Trading Zone
**23,925 → 24,000**
This **75-point range** will decide the direction for expiry.
Above **24,000**, expect short covering.
Below **23,925**, expect fresh selling pressure.
Avoid chasing the opening move. Expiry sessions often spend the first hour separating impatient traders from their capital before showing their real direction.
---
**Educational purposes only. Not financial advice.**
#Nifty50 #NiftyAnalysis #ExpiryDay #OptionTrading #TechnicalAnalysis #PriceAction #StockMarketIndia #NSE #IntradayTrading #MarketAnalysis #TradingStrategy #RiskManagement #TradingPsychology #BankNifty #DailyMarketAnalysis
Short 
BANKNIFTY MONTHLY Exp. Level Analysis for 30th Jun 2026.🔕 SGMN SplD BULLISH Above => 57943.
🔕 SGMN SplD Bearish BELOW => 57522.
Mentioned analysis based on 2 consecutive candle close in 15 min Time Frame.
━━━━━🟥🟧🟨🟩🟦🟪⬛━━━━━
💥Level Interpretation / description:
✍🏻L#1: If the candle crossed & stays above the “Buy Gen”, it is treated / considered as Bullish bias. Cfm=> Confirmation.
L#2: Possibility / Probability of REVERSAL near 🔕RL/TF1 & 🔔RL/TF2
L#3: If the candle stays above “Sell Gen” but below “Buy Gen”, it is treated / considered as Sidewise. Aggressive Traders can take Long position near “Sell Gen” either retesting or crossed from Below & vice-versa i.e. can take Short position near “Buy Gen” either retesting or crossed downward from Above.
L#4: If the candle crossed & stays below the “Sell Gen”, it is treated / considered a Bearish bias.
L#5: Possibility / Probability of REVERSAL near 🔕RL/TF1 & 🔔RL/TF2
HZB (Buy side) & HZS (Sell side) => Hurdle Zone,
✍🏻 *** Specialty of “HZB#1, HZB#2 HZS#1 & HZS#2” is Sidewise (behaviour in Nature)
Rest Plotted and Mentioned on Chart
Color code Used:
Green, BLUE =. Positive bias.
Safron, RED =. Negative bias.
RED in Between Green means Trend Finder / Momentum Change
/ CYCLE Change and Vice Versa.
Notice One thing: HOW LEVELS are Working.
Use any Momentum Indicator / Oscillator or as you "USED to" to Take entry.
━━━━━🟥🟧🟨🟩🟦🟪⬛━━━━━
⚠️ DISCLAIMER:
The information, views, and ideas shared here are purely for educational and informational purposes only. They are not intended as investment advice or a recommendation to buy, sell, or hold any financial instruments. I am not a SEBI-registered financial adviser.
Trading and investing in the stock market involves risk, and you should do your own research and analysis. You are solely responsible for any decisions made based on this research.
"🔔As HARD EARNED MONEY IS YOUR's, So DECISION SHOULD HAVE TO BE YOUR's".
━━━━━🟥🟧🟨🟩🟦🟪⬛━━━━━
❇️ Follow notification about periodical View
💥 Do Comment for Stock WEEKLY Level Analysis.🚀
📊 Do you agree with this view?
✈️ HIT THE PLANE ICON if this technical observation resonates with you. It will Motivate me.
━━━━━🟥🟧🟨🟩🟦🟪⬛━━━━━
💡 If You LOOKING any CHART & want for Level and ANALYZE?
Share your desired stock names in the comments below! I will try to analyze the chart Levels, patterns and share my technical view (so far my Knowledge).
If Viewers think It can identify meaningful setups. Looking forward to hearing from all of you — let's keep this discussion going and help each other make better trading decisions.
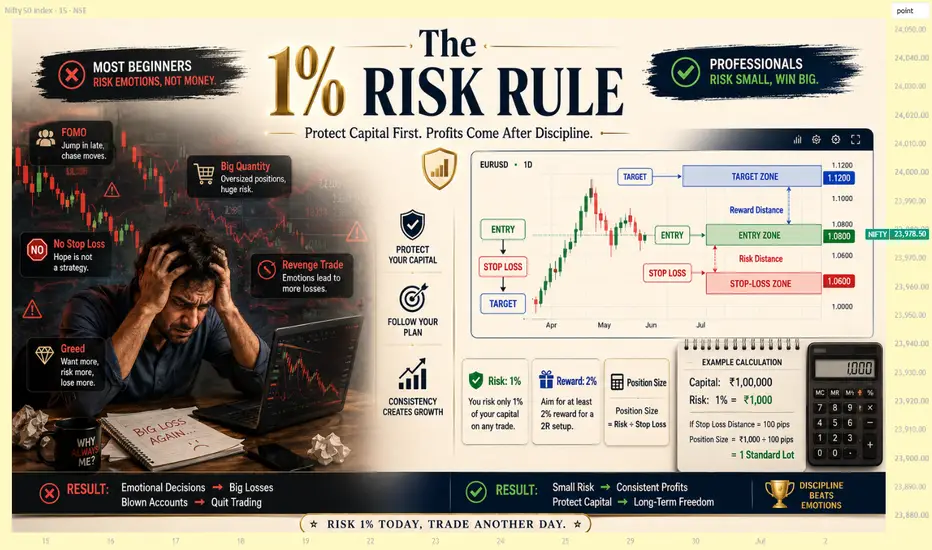
___________🔕^^^⚫⚪^🙏🏼🙏🏼🙏🏼^⚪⚫^^^🔔___________ The 1% Risk Rule Explained for BeginnersThe 1% Risk Rule
The Rule That Keeps Beginners Safe in the Market
Most new traders focus only on one thing:
“How much profit can I make?”
But experienced traders ask a better question:
“How much can I lose if this trade goes wrong?”
That mindset is where real trading discipline begins.
___________________________________
✅ What is the 1% Risk Rule?
The 1% Risk Rule means you should never risk more than 1% of your total trading capital on a single trade.
It does not mean you invest only 1% of your capital.
It means your maximum loss on one trade should be limited to 1%.
📊 Example:
If your capital is ₹1,00,000, then 1% risk is ₹1,000.
So, if your stop-loss hits, your loss should not be more than ₹1,000.
___________________________________
✅ Why This Rule Matters
Trading is not about winning every trade.
Even good traders face losing streaks.
The difference is this:
A beginner loses big when wrong.
A professional loses small when wrong.
If you risk too much on one trade, one bad setup can damage your confidence and capital.
But if you risk only 1%, even 5 losses in a row will not destroy your account.
You still stay in the game.
And in trading, survival comes before profits.
___________________________________
✅ The Simple Formula
Before entering any trade, calculate your quantity like this:
Position Size = Risk Amount ÷ Stop-Loss Difference
📊 Example:
Capital = ₹1,00,000
Risk = 1% = ₹1,000
Entry = ₹500
Stop-loss = ₹480
Risk per share = ₹20
Position size:
₹1,000 ÷ ₹20 = 50 shares
So your correct quantity is 50 shares.
Not 100.
Not 200.
Not based on confidence.
Only based on risk.
___________________________________
✅ Most Beginners Do This Wrong
Many traders decide quantity first and stop-loss later.
That is dangerous.
They think:
“I will buy 500 quantity, then manage somehow.”
But professional traders think:
“My stop-loss is here. How much quantity can I safely take?”
That is the correct approach.
Your quantity should come from your risk calculation, not from greed or excitement.
___________________________________
✅ Risk Small, Think Big
Many beginners feel:
“If I risk only 1%, my profit will be small.”
But that is not true.
You may risk 1% to make 2%, 3%, or more.
📊 Example:
Risk = 1%
Target = 2%
This means your risk-to-reward is 1:2.
Even if you win only 5 out of 10 trades, you can still be profitable if your winners are bigger than your losers.
That is why trading is not about being right every time.
It is about managing risk properly when you are wrong.
___________________________________
✅ The 1% Rule in Options Trading
Options move fast.
This is why the 1% rule becomes even more important.
Many beginners buy options because the premium looks cheap.
But cheap premium does not mean low risk.
📊Example:
Capital = ₹1,00,000
Risk allowed = ₹1,000
Option entry = ₹100
Stop-loss = ₹80
Risk per quantity = ₹20
Allowed quantity:
₹1,000 ÷ ₹20 = 50 quantity
So before buying options, always ask:
“If my stop-loss hits, how much will I lose?”
___________________________________
✅ Stop-Loss Should Be Logical
Do not place stop-loss randomly.
Your stop-loss should be based on chart structure.
Good stop-loss areas:
Below support
Below swing low
Below demand zone
Below breakout candle low
Above resistance for short trades
Above swing high for short trades
A stop-loss should be placed where your trade idea becomes invalid.
Not where your emotions feel comfortable.
___________________________________
✅ Beginner Rule to Follow
For beginners, even 1% risk can feel heavy.
So you can start with:
0.25% to 0.50% risk per trade
Your first goal is not to make big money.
Your first goal is to build discipline.
Once you become consistent, you can slowly increase risk.
___________________________________
✅ What we Learned Here
The 1% Risk Rule protects you from emotional trading.
It helps you avoid revenge trades.
It keeps your losses small.
It gives you more chances to learn.
And most importantly, it protects your capital.
___________________________________
Remember:
A trader with capital can always come back.
A trader without capital only watches the market.
Before every trade, ask yourself:
⚠️What is my entry?
⚠️Where is my stop-loss?
⚠️How much am I risking?
⚠️Is this trade worth the risk?
If you cannot answer these questions, you are not ready to enter.
A professional trader does not enter a trade because it looks exciting.
A professional trader enters only when the risk is clear, controlled, and acceptable.
Protect your capital first. Profits come after discipline .
Disclaimer: This post is for educational purposes only. Education 
BankNifty Intraday Outlook for 29-06-2026Banknifty Market Structure
Bank Nifty is currently trading inside a decision zone between the marked support zone and previous support turned resistance.
This means price is at an important inflection point.
Key Levels
Support Zone: 58,180 – 58,100
Resistance / Trigger Zone: 58,360
Bullish Target 1: 58,500
Bullish Target 2: 58,700
Bearish Target 1: 57,950
Bearish Target 2: 57,800
_________________________________________
🟢 Bullish Plan
If Bank Nifty gives a strong 15-minute close above 58,360, bulls may regain control.
Trade Idea:
Wait for breakout confirmation above 58,360
Safer entry if price retests the breakout zone and holds
Upside Levels:
➡️ 58,500-58520
➡️ 58,700
_________________________________________
🔴 Bearish Plan
If price breaks and closes below 58,100, selling pressure may continue.
Trade Idea:
Wait for a proper breakdown below 58,100
Better entry if price retests the support zone from below and fails
Downside Levels:
➡️ 57,950
➡️ 57,800
_________________________________________
⚠️ Important View
As long as price remains between 58,100 and 58,360, it is a no-trade / wait zone.
✅ Above 58,360 = Bullish bias
✅ Below 58,100 = Bearish bias
✅ Inside the zone = Avoid overtrading
_________________________________________
📌 My View
This is a clean breakout vs breakdown setup.
No need to predict — let price confirm direction first.
Trade only after confirmation, manage risk properly, and avoid emotional entries inside the range.
Educational purpose only. Not financial advice.