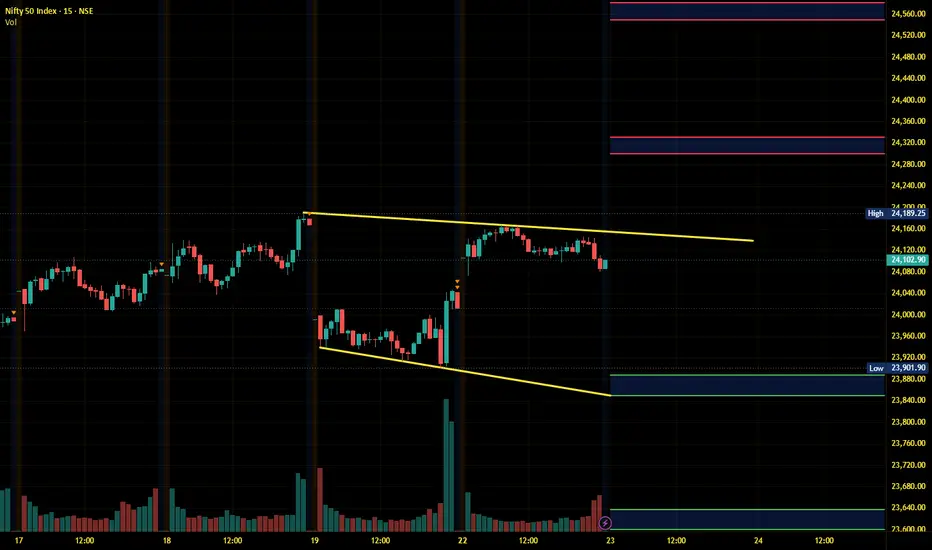
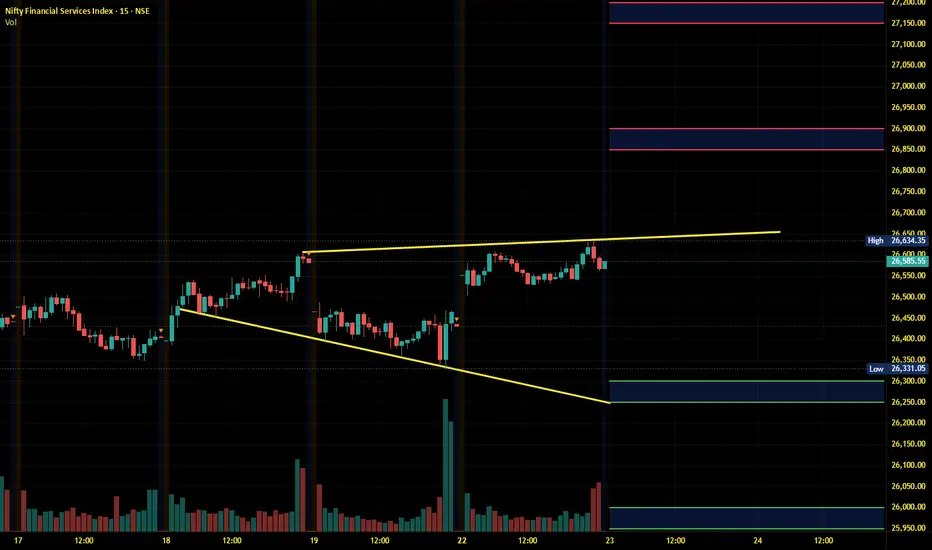
NIFTY DAILY / Short range Level Analysis for 25th Jun 2026🔕 SGMN SplD BULLISH Above => 24098.
🔕 SGMN SplD Bearish BELOW => 23949.
Mentioned analysis based on 2 consecutive candle close in 15 min Time Frame.
━━━━━🟥🟧🟨🟩🟦🟪⬛━━━━━
💥Level Interpretation / description:
✍🏻L#1: If the candle crossed & stays above the “Buy Gen”, it is treated / considered as Bullish bias. Cfm=> Confirmation.
L#2: Possibility / Probability of REVERSAL near 🔕RL/TF1 & 🔔RL/TF2
L#3: If the candle stays above “Sell Gen” but below “Buy Gen”, it is treated / considered as Sidewise. Aggressive Traders can take Long position near “Sell Gen” either retesting or crossed from Below & vice-versa i.e. can take Short position near “Buy Gen” either retesting or crossed downward from Above.
L#4: If the candle crossed & stays below the “Sell Gen”, it is treated / considered a Bearish bias.
L#5: Possibility / Probability of REVERSAL near 🔕RL/TF1 & 🔔RL/TF2
HZB (Buy side) & HZS (Sell side) => Hurdle Zone,
✍🏻 *** Specialty of “HZB#1, HZB#2 HZS#1 & HZS#2” is Sidewise (behaviour in Nature)
Rest Plotted and Mentioned on Chart
Color code Used:
Green, BLUE =. Positive bias.
Safron, RED =. Negative bias.
RED in Between Green means Trend Finder / Momentum Change
/ CYCLE Change and Vice Versa.
Notice One thing: HOW LEVELS are Working.
Use any Momentum Indicator / Oscillator or as you "USED to" to Take entry.
━━━━━🟥🟧🟨🟩🟦🟪⬛━━━━━
⚠️ DISCLAIMER:
The information, views, and ideas shared here are purely for educational and informational purposes only. They are not intended as investment advice or a recommendation to buy, sell, or hold any financial instruments. I am not a SEBI-registered financial adviser.
Trading and investing in the stock market involves risk, and you should do your own research and analysis. You are solely responsible for any decisions made based on this research.
"🔔As HARD EARNED MONEY IS YOUR's, So DECISION SHOULD HAVE TO BE YOUR's".
━━━━━🟥🟧🟨🟩🟦🟪⬛━━━━━
❇️ Follow notification about periodical View
💥 Do Comment for Stock WEEKLY Level Analysis.🚀
📊 Do you agree with this view?
✈️ HIT THE PLANE ICON if this technical observation resonates with you. It will Motivate me.
━━━━━🟥🟧🟨🟩🟦🟪⬛━━━━━
💡 If You LOOKING any CHART & want for Level and ANALYZE?
Share your desired stock names in the comments below! I will try to analyze the chart Levels, patterns and share my technical view (so far my Knowledge).
If Viewers think It can identify meaningful setups. Looking forward to hearing from all of you — let's keep this discussion going and help each other make better trading decisions.
___________🔕^^^⚫⚪^🙏🏼🙏🏼🙏🏼^⚪⚫^^^🔔___________ NIFTY Maintains Bullish MomentumHighlights
* NIFTY continues to trade with a positive bias, maintaining its broader higher-high and higher-low formation.
* The index is holding above key moving averages, indicating sustained strength and healthy market sentiment.
* Momentum indicators remain supportive, suggesting that buyers continue to have control despite intermittent volatility.
* Immediate resistance is placed near recent peak levels; a decisive breakout could support the next leg of the uptrend.
* Key support zones remain crucial, as holding these levels would preserve the current bullish structure.
* Sectoral participation from banking, financial services, IT, and heavyweight stocks will remain important for sustaining the market momentum.
Takeaway
NIFTY’s technical outlook remains positive as long as the index stays above major support levels. A breakout above resistance can open room for further upside, while dips towards support zones may provide opportunities for gradual accumulation. Traders should track momentum, volume, and broader market participation for confirmation of the next trend.
 Short
Short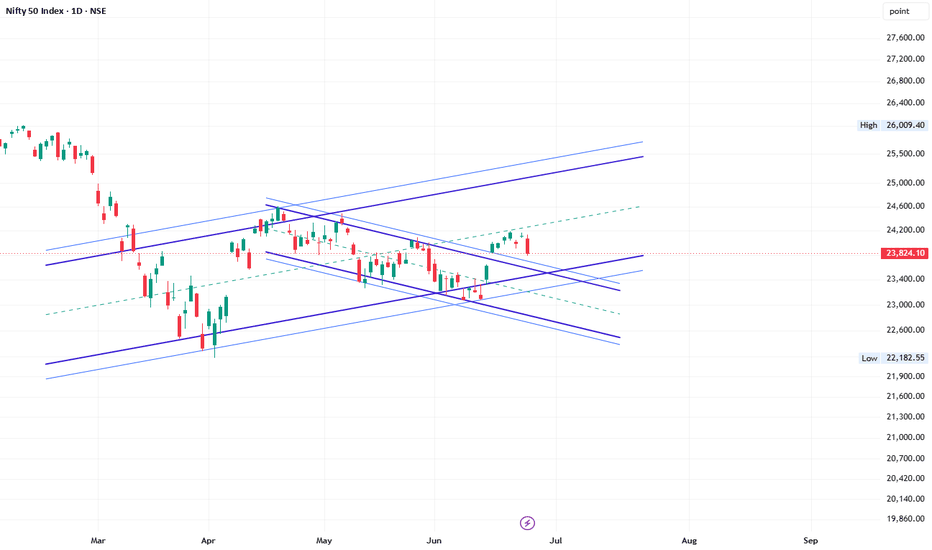
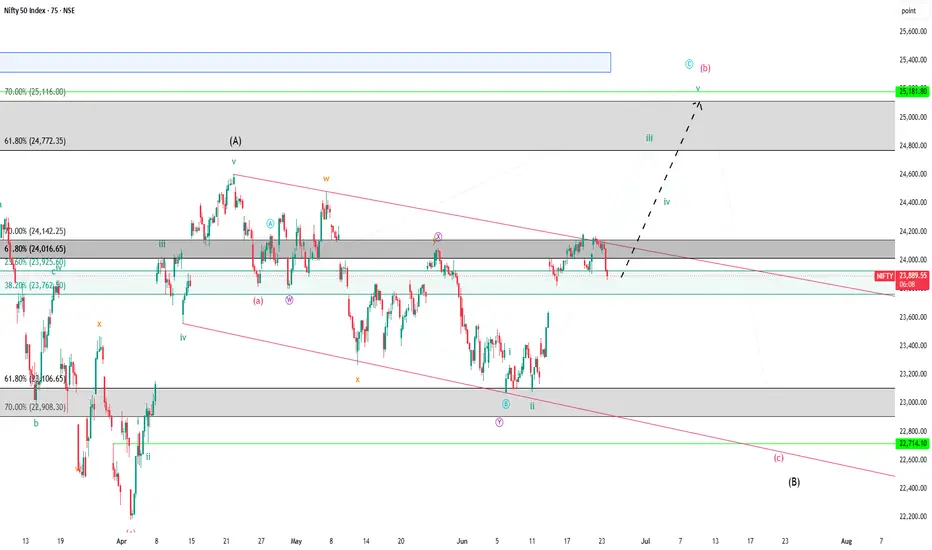
Nifty Analysis from 24 June to 03 July, 2026Wrap up:-
In major time frame, we are in wave y of x of major wave 4. In wave y, wave a has been completed at 24601 and wave b is in progress which is forming a 5-3-5 simple zig zag correction.
In wave b, internal wave a is completed at 23813, wave b is completed at 24189 and now, wave c is in progress.
What I’m Watching Nifty from 24 June to 03 July, 2026🔍
As Wave b target has been achieved, now Nifty is heading towards wave c for the target of 22908-22714. In wave c, wave 1 is completed at 23938, wave 2 at 24013 and wave 3 is in progress.
Disclaimer: Sharing my personal market view — only for educational purpose not financial advice.
"Don't predict the market. Decode them." Short 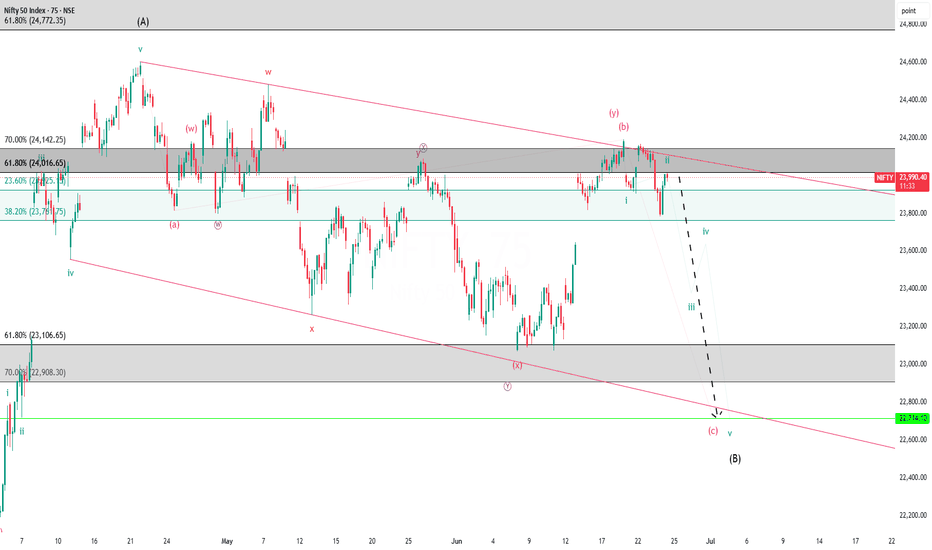
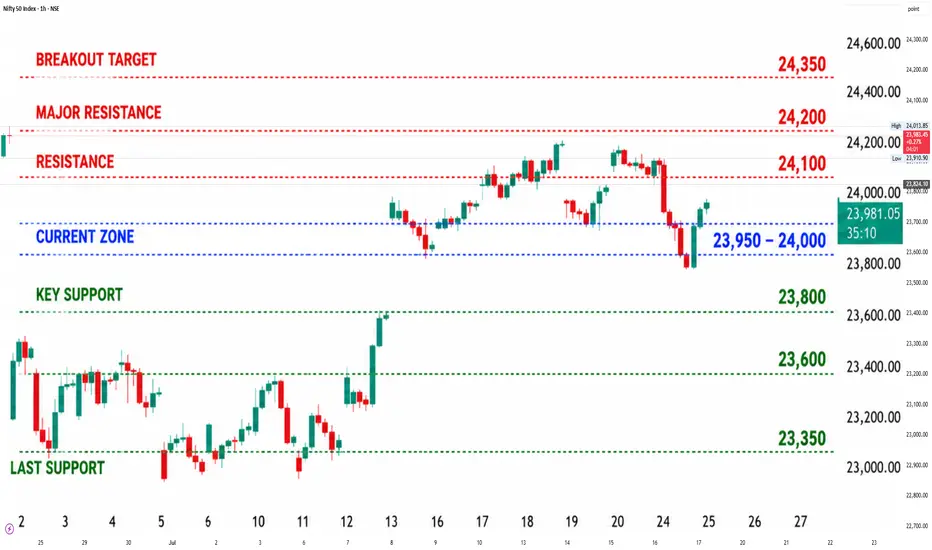
NIFTY 50 Technical AnalysisCurrent Zone: 23,950–24,000 area is the key battleground. Nifty recovered from recent weakness but is still facing resistance around 24,000–24,200.
Important Levels
Resistance Zones
24,000 (Immediate hurdle)
24,100–24,200 (Major resistance)
24,300–24,350 (Bullish breakout target)
Support Zones
23,800 (Key support)
23,650–23,600 (Strong support)
23,400–23,350 (Last bullish defense)
Trading Plan
Bullish Scenario
Sustained move above 24,000
Target: 24,100 → 24,200
Strong breakout above 24,200 can extend towards 24,300–24,350.
Bearish Scenario
Break below 23,800
Target: 23,650 → 23,600
Further weakness may drag Nifty towards 23,400–23,350.
Swing Trader View
Above 24,000: Positive bias
Below 23,800: Cautious / bearish bias
Range-bound zone: 23,800–24,000.
Chart Setup Text (for your TradingView-style chart)
RESISTANCE: 24,200
MAJOR RESISTANCE: 24,100–24,200
BREAKOUT TARGET: 24,350
CURRENT ZONE: 23,950–24,000
KEY SUPPORT: 23,800
STRONG SUPPORT: 23,600
LAST SUPPORT: 23,350
BIAS: Bullish above 24,000 | Bearish below 23,800 Long 
NIFTY KEY LEVELS FOR 24.06.2026NIFTY KEY LEVELS FOR 24.06.2026
Recommended Timeframe: 3 Minutes
If the candle stays above the pivot point, it is considered a bullish bias; if it remains below, it indicates a bearish bias. Price may reverse near Resistance 1 or Support 1. If it moves further, the next potential reversal zone is near Resistance 2 or Support 2. If these levels are also broken, we can expect the trend.
When a support or resistance level is broken, it often reverses its role; a broken resistance becomes the new support, and a broken support becomes the new resistance.
If the range(R2-S2) is narrow, the market may become volatile or trend strongly. If the range is wide, the market is more likely to remain sideways
Want to master this strategy and apply it to your daily trading? Reach out to me for details.
please like, comment and share my idea if you find it helpful
📢 Disclaimer
I am not a SEBI-registered financial adviser.
The information, views, and ideas shared here are purely for educational and informational purposes only. They are not intended as investment advice or a recommendation to buy, sell, or hold any financial instruments.
Please consult with your SEBI-registered financial advisor before making any trading or investment decisions.
Trading and investing in the stock market involves risk, and you should do your own research and analysis. You are solely responsible for any decisions made based on this research #NIFTY Intraday Support and Resistance Levels - 24/06/2026Nifty is expected to open with a flat bias around the 23750–23800 zone after witnessing sharp profit booking in the previous session. The index has slipped towards a crucial support area, and today's price action around this zone will be important in determining whether buyers can regain control or sellers continue to dominate.
For today's session, 23750–23800 remains the immediate reversal buying zone. A sustained hold above this support area can trigger a recovery move towards 23850, 23900, and 23950+ levels. If Nifty manages to reclaim and sustain above 24050, fresh bullish momentum may emerge, pushing the index towards 24150, 24200, and 24250+ levels.
On the downside, 23950–23900 remains the key resistance-based selling zone for intraday traders. Any weakness below 23750 may attract fresh selling pressure towards 23650, 23600, and 23550 levels. A decisive breakdown below this support zone could accelerate bearish momentum and extend the corrective move.
Overall, the market structure has turned cautious after the recent decline, but the index is currently approaching a strong demand zone near 23750. Traders should closely monitor price action around this level, as a sustained hold may offer reversal buying opportunities, while a breakdown below 23750 could trigger further downside pressure. Strict stop-loss and disciplined risk management are advised amid increased volatility. #BANKNIFTY Intraday PE & CE Levels(24/06/2026)Bank Nifty is expected to open with a flat bias around the 57100–57150 zone after witnessing sharp profit booking from higher levels in the previous session. The index has corrected from the 58000 region and is currently trading near an important support area, making today's session crucial for determining the next directional move.
For today's session, 57050–57100 remains the immediate buying zone. A sustained hold above this support area can trigger a relief rally towards 57250, 57350, and 57450+ levels. If Bank Nifty manages to reclaim and sustain above 57550, fresh bullish momentum may emerge, pushing the index towards 57750, 57850, and 57950+ levels.
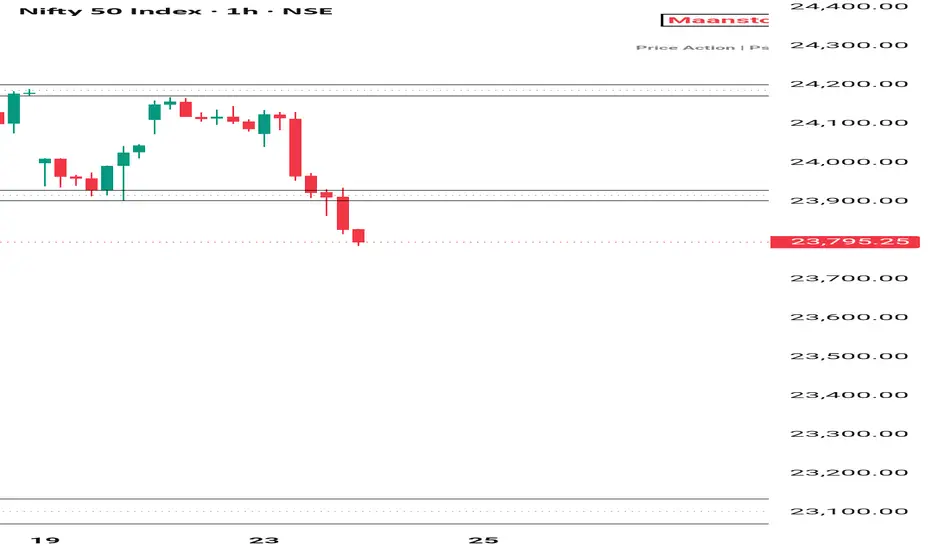
On the downside, 57450–57400 remains the key resistance-based selling zone for intraday traders. Any weakness below 56950 may attract fresh selling pressure towards 56750, 56650, and 56550 levels. A decisive breakdown below this support zone could accelerate bearish momentum in the short term. Nifty Market outlook for 24 June 2026📊 NIFTY50 – 1H CHART ANALYSIS
CMP: 23,795
Resistance: 24,150 – 24,200
Support: 23,900 – 23,950
Clear breakdown below key support
No buying strength visible right now
Price rejected perfectly from resistance
Then strong selling came after support break
Bull Case:
Only if price reclaims 23,950
Then bounce possible towards 24,100+
Bear Case:
Below 23,900 → downside continuation
Next major support: 23,100 – 23,150
Key Level: 23,900 (Decision zone)
Smart Money View:
Clean liquidity grab above → then dump
Retail trapped on upside
Strategy:
Sell on pullbacks
Avoid buying in middle
Bias: Bearish 🔻 Short 
NIFTY ANALYSIS | WEDNESDAY, 24 JUNE 2026 |4H→1H→15-MIN→5-Min TF# 📊 NIFTY ANALYSIS | WEDNESDAY, 24 JUNE 2026 | 4H → 1H → 15-MIN → 5-MIN TF 🔥
**Today’s data:**
**NIFTY Close:** **23,824.10**
**Change:** **-278.80 points (-1.16%)**
**Open:** **24,071.30**
**High:** **24,135.50**
**Low:** **23,784.95**
**Previous Close:** **24,102.90**
The index opened near 24,070, briefly tested 24,135, then sellers took control and pushed it below 24,000. NIFTY closed near the day low, which is a bearish sign. The market did not merely dip. It lost an important support zone and then spent the day reminding everyone why stop losses exist.
---
## 🚨 FINAL VERDICT
### Market Bias
🔴 **Bearish below 23,901.90**
🟡 **Short-covering recovery only above 23,901.90**
🟢 **Stronger bullish reversal only above 24,000**
NIFTY closed at **23,824.10**, below the psychological **24,000** level and below the short-term moving-average zone visible near **23,930 to 24,000**.
The broader chart shows that price rejected from the **24,090 to 24,135** zone and broke down sharply. RSI is near oversold territory, so a bounce is possible, but a bounce is not automatically a reversal. Markets have fooled enough people already.
### Institutional Summary
* **Market Regime:** 🔴 Bearish expansion
* **Control:** 🔴 Sellers below **23,901.90**
* **Previous Session OHLC:** Open **24,071.30** | High **24,135.50** | Low **23,784.95** | Close **23,824.10**
* **Immediate Resistance:** **23,867.65**, **23,901.90**, **23,918.85**
* **Major Resistance:** **23,960.25**, **24,001.65**
* **Immediate Support:** **23,784.95**, **23,763.20**, **23,686.00**
* **Trader Action:** Wait for a confirmed breakdown or reclaim. Avoid trading inside the middle range.
### Probability Matrix
* 🔴 **Bearish: 55%**
* 🟡 **Range-bound: 30%**
* 🟢 **Bullish Recovery: 15%**
━━━━━━━━━━━━━━━━━━
# 🔴 HIGH-PROBABILITY PE TRADE
## PE Setup: Breakdown Continuation Below Day Low
**Probability:** 55%
**Strategy:** Buy PE only after NIFTY confirms weakness below the previous-day low.
* **Entry Trigger:** 15-minute close below **23,784.95**
* **Confirmation:** 5-minute retest fails near **23,800**
* **Stop Loss:** **23,867.65**
* **Target 1:** **23,763.20**
* **Target 2:** **23,686.00**
* **Target 3:** **23,600**
* **Invalidation:** Sustained 15-minute close above **23,901.90**
### Fibonacci Confluence
Using 23 June range: High **24,135.50** and Low **23,784.95**
* **23.6%:** **23,867.65**
* **38.2%:** **23,918.85**
* **50.0%:** **23,960.25**
* **61.8%:** **24,001.65**
* **78.6%:** **24,060.40**
### Institutional Logic
NIFTY closed below the **23.6% Fibonacci level near 23,867.65**, which indicates sellers retained control into the close.
A confirmed break below **23,784.95** can open downside toward **23,763**, followed by **23,686**. If the market starts accepting below **23,700**, the next psychological support becomes **23,600**.
Do not buy PE after a huge opening gap-down without confirmation. That is how option premiums become expensive souvenirs.
━━━━━━━━━━━━━━━━━━
# 🟢 HIGH-PROBABILITY CE TRADE
## CE Setup: Short-Covering Reclaim
**Probability:** 15%
**Strategy:** Buy CE only if NIFTY reclaims the first major resistance zone and holds it.
* **Entry Trigger:** 15-minute close above **23,901.90**
* **Confirmation:** 5-minute retest holds above **23,875**
* **Stop Loss:** **23,824.10**
* **Target 1:** **23,918.85**
* **Target 2:** **23,960.25**
* **Target 3:** **24,001.65**
* **Invalidation:** 15-minute close back below **23,867.65**
### Institutional Logic
A move above **23,901.90** can trigger short covering because the index would reclaim the previous breakdown area.
However, this remains a counter-trend trade until NIFTY sustains above **23,960**. A real bullish recovery needs acceptance above **24,000**.
━━━━━━━━━━━━━━━━━━
# 📊 OPTION-CHAIN VIEW | 30 JUNE EXPIRY
## ATM Strike: **23,800**
With NIFTY closing at **23,824.10**, the immediate ATM zone is **23,800**.
### Key Option Zones
* **Major Call Resistance:** **23,900 to 24,000**
* **Major Put Support:** **23,800**, then **23,700**
* **Pivot Zone:** **23,800**
* **Upside Breakout Zone:** Above **23,901.90**
* **Downside Acceleration Zone:** Below **23,784.95**
### Option-Chain Interpretation
* Above **23,900**, call unwinding can support a bounce toward **23,960 to 24,000**
* Below **23,785**, put-side support may weaken and downside can extend toward **23,700**
* Between **23,800 and 23,900**, expect sharp premium decay and false moves
The 30 June expiry still has time value, but weekly option traders will somehow find a way to lose it all in one candle. Patience remains inconveniently useful.
━━━━━━━━━━━━━━━━━━
# 📈 4H TIMEFRAME ANALYSIS
* **Trend:** Broader recovery structure has weakened.
* **Structure:** Rejection from the **24,100 to 24,135** supply zone.
* **EMA Position:** Price is below the short-term EMA cluster.
* **Momentum:** Negative.
* **Major Support Zone:** **23,686 to 23,763**
* **Major Resistance Zone:** **23,960 to 24,001**
* **Interpretation:** NIFTY needs to reclaim **24,000** to repair the bullish structure.
━━━━━━━━━━━━━━━━━━
# 📉 1H TIMEFRAME ANALYSIS
* **Structure:** Lower-high and lower-low formation.
* **Resistance:** **23,867 → 23,902 → 23,960**
* **Support:** **23,785 → 23,763 → 23,686**
* **Momentum:** Bearish below **23,901.90**
* **Interpretation:** A one-hour close below **23,785** can extend selling. A one-hour close above **23,902** may trigger short covering.
━━━━━━━━━━━━━━━━━━
# ⏱️ 15-MINUTE TRADE FRAMEWORK
## 🔴 Immediate Resistance
1. **23,867.65**
2. **23,901.90**
3. **23,918.85**
4. **23,960.25**
5. **24,001.65**
## 🟢 Immediate Support
1. **23,824.10**
2. **23,784.95**
3. **23,763.20**
4. **23,686.00**
5. **23,600**
## Intraday Trigger Zones
* **Bullish Trigger:** 15-minute close above **23,901.90**
* **Bearish Trigger:** 15-minute close below **23,784.95**
* **No-Trade Zone:** **23,784.95 to 23,901.90**
━━━━━━━━━━━━━━━━━━
# ⚡ 5-MINUTE EXECUTION PLAN
## For PE Buyers
* Wait for a 15-minute close below **23,784.95**
* Enter after a failed 5-minute retest near **23,800**
* Book partial profit near **23,763**
* Trail remaining quantity toward **23,686**
* Avoid PE if NIFTY quickly reclaims **23,867.65**
## For CE Buyers
* Wait for a 15-minute close above **23,901.90**
* Enter only after a 5-minute retest holds above **23,875**
* Book partial profit near **23,918**
* Trail remaining quantity toward **23,960**
* Avoid CE if price slips back below **23,867.65**
## For Option Sellers
* Avoid naked selling during the first 30 minutes.
* Prefer defined-risk spreads after direction confirms.
* The **23,800** strike is likely to be volatile.
━━━━━━━━━━━━━━━━━━
# 🧠 MARKET PSYCHOLOGY
**Retail Behaviour:** Likely to buy CE after any small bounce because RSI is oversold, then panic if 23,785 breaks.
**Institutional Behaviour:** Likely to test the **23,800 ATM zone** first. Acceptance below it can trigger fresh selling. Acceptance above **23,902** can force short covering.
**Current Edge:** 🔴 Sellers remain in control below **23,901.90**.
━━━━━━━━━━━━━━━━━━
# 📌 TRADING DAY SCENARIOS
## Scenario 1: Bearish Continuation
**Probability:** 55%
**Trigger:** 15-minute close below **23,784.95**
**Targets:** **23,763.20 → 23,686.00 → 23,600**
## Scenario 2: Range and Premium Decay
**Probability:** 30%
**Trigger:** Price remains between **23,784.95 and 23,901.90**
**Action:** Avoid directional option buying. This range is built for whipsaws.
## Scenario 3: Short-Covering Recovery
**Probability:** 15%
**Trigger:** 15-minute close above **23,901.90**
**Targets:** **23,918.85 → 23,960.25 → 24,001.65**
━━━━━━━━━━━━━━━━━━
# 🚫 INVALIDATION LEVELS
* **Bearish thesis invalid above:** **23,901.90** on sustained 15-minute acceptance
* **Bullish thesis invalid below:** **23,784.95** on sustained 15-minute acceptance
━━━━━━━━━━━━━━━━━━
# 🔥 TRADER NOTE
For **24 June 2026**, the decisive range is:
## **23,784.95 to 23,901.90**
Below **23,784.95**, downside continuation can target **23,763** and **23,686**.
Above **23,901.90**, short covering can lift NIFTY toward **23,960** and potentially **24,000**.
Trade the confirmation, not the urge to recover yesterday’s loss. The market has plenty of liquidity already. It does not need your emergency donation.
*Educational analysis only, not financial advice.*
#mfi #moneyflowindex #tradingsignals #stockmarketindia #technicalanalysis #priceaction #daytrading #swingtrading #optiontrading #nifty50 #banknifty #volumeanalysis #momentumtrading #tradingstrategy #marketstructure #candlestick #supportandresistance #traderlife #marketanalysis
Short 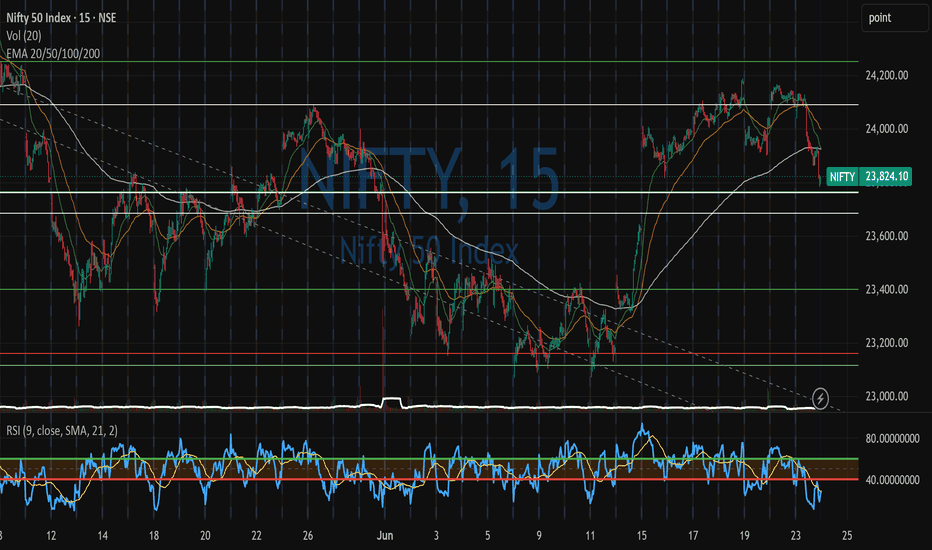
Nifty Bank Analysis [For 24.06.2026: Wednesday]Probable Scenario Analysis of Nifty Bank for the 24th of June, 2026. The day is Wednesday.
🟢 Bullish Scenario
There is no observable bullish scenario. Doubt every up move. Think of a bullish trade only if the price trades and sustains above the level of 58000. The probable bullish targets above the level of 58000 would be - 58250 and 58500.
🔴 Bearish Scenario
Presently, the price is in a bearish zone. If the price stays below the level of 57500, then stay bearish only. Doubt every up move. The probable bearish targets below the level of 57500 would be - 57250, 57000, and 56750. The price would fill an unfilled gap (at 56800 approx.) and take support at 56750. Next, if the price decisively trades below the level of 56750, then the probable bearish target would be 56500. The price would receive good support at the level of 56500.
🟡 No Trading Zone (NTZ): (58000 - 57500)
⏺ Range of Consolidation (ROC): (57500 - 56500).
Here, the level of 57000 is the median of the ROC. The median works like a sentiment. The price trading above the median would offer bullish sentiment, while the price trading below the median would trigger bearish sentiment.
🟧 Technical Pattern: Double Top Pattern as a Trend Reversal Pattern
It is observed that the price has formed a double top at the level of 58000. Here, the level of 57500 is the neckline of the double top pattern. The neckline is decisively broken. Presently, there is no sign of bullishness. Doubt every up move. Look for bearish trades only.
● Event
There are no high-impact events on Wednesday. On Thursday, there will be SENSEX monthly expiry. Thus, Thursday will be a very critical day. Lastly, Friday is a national holiday (Muharram). We have only two trading days left.
● Intraday Bias
Establish intraday bias with respect to the opening price. If the price sustains above the opening price, then don't think of shorting. Look for bullish trades only. On the contrary, if the price sustains below the opening price, then don't think of going long. Look for bearish trades in that case.
● Top-Down Analysis:
- Monthly TF: A green spinning top candle is formed. The level of 58000 is a major resistance level. The level of 57000 is a weak support. Lastly, the level of 56500 is a major support. The view is bullish to indecision.
- Weekly TF: A red marubozu is formed that has engulfed the movement of the previous doji candle. It looks like a sign of reversal. Strong resistance at 58000. Weak support at 57000. The level of 56750 seems to be achievable due to the availability of a GAP. Strong support is at 56500. The view is bullish, with signs of trend reversal.
- Daily TF: A big red marubozu. Doubt every up move. Weak support at 57000. Major support at 56500. There is a high chance of GAP filling till the level of 56750.
- 30-minute TF: The previous structure of higher-highs and lower-lows is exhausted. There is a clear sign of trend reversal (bullish to bearish). The view is bearish.
● Disclaimer + End Note
- All the analyses would fail in the case of a major gap up, gap down, or price structure anomaly. Thus, practice PRAGMATISM in the live session.
- Trade only if there is a set-up. Remember, not trading is an extension of the trading activity.
- Mark your points. Trade your points. Price is GOD. Anything can happen in the markets. Thus, trade what you see, not what you believe.
- Always PRACTICE RISK MANAGEMENT. Always PROTECT YOUR CAPITAL. Be RESPONSIBLE.
- Be Strategic. Be Courageous. Be Patient. Be Wise.
- Every day is a new day. Thus, do not carry the baggage of past successes or failures. Leave the gardens of winning and losing. Establish yourself in equanimity. Always think from a new perspective.
- Let the joy of trading drive your effectiveness, not greed or fear. Believe in Possibilities.
Happy Trading! Short 
Education 
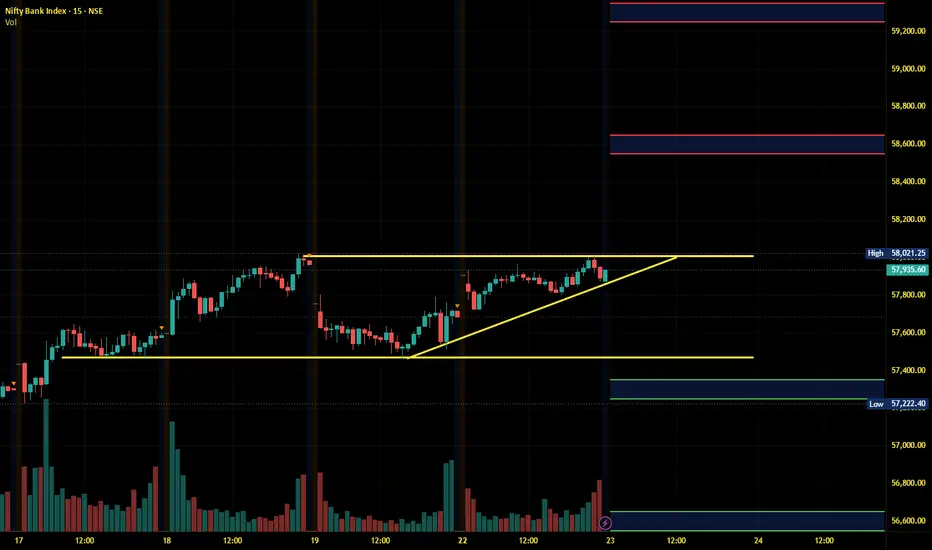
BankNifty Intraday Outlook 23-june-2026📈 BANK NIFTY: At a Crucial Resistance Zone — Breakout or Rejection?
Bank Nifty is currently trading near a major supply zone around 58,000, a level that has repeatedly acted as resistance. Price continues to respect the broader bullish channel, but buyers now need a decisive breakout to continue the uptrend.
________________________________________________________________
🔍 Technical Observations:
✅ Overall structure remains bullish with Higher Highs & Higher Lows.
✅ Price is trading within an ascending channel.
✅ Multiple rejections near 58,000 indicate strong seller presence.
✅ Immediate support is placed around 57,800, which remains a key demand zone.
📌 Key Levels to Watch:
🔴 Resistance Zone: 57,950 – 58,025
🟢 Support Zone: 57,800 – 57840
🚀 Bullish Scenario:
A sustained breakout and close above 58,025 may trigger fresh momentum towards:
🎯 Target 1: 58,150
🎯 Target 2: 58,250
📉 Bearish Scenario:
Failure to hold the support zone could lead to profit booking towards:
🎯 Target 1: 57,660
🎯 Target 2: 57,470
⚠️ Avoid trading inside the range. Wait for confirmation above resistance or below support before taking fresh positions.
Patience is a position too. Let price confirm the next move.
Do you expect Bank Nifty to break 58,000 or face another rejection? Share your view below!