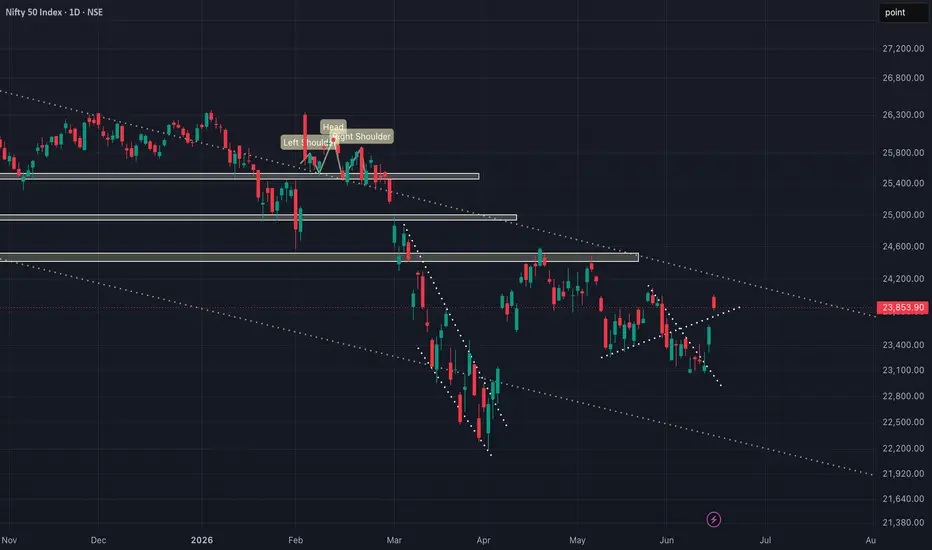
Long
Long
Nikkei Strengthens: BOJ's Interest Rate Hike DoctrineNikkei Strengthens: BOJ's Rate Hike Doctrine & Toichiro Asada's Dovish Faction Breakdown
The regular trading session on the Tokyo Stock Exchange on Tuesday afternoon, June 16, 2026, officially closed, locking in a powerful upward reversal (turns higher).
Japanese financial markets firmly resisted panic over a new era of high interest rates, instead choosing to appreciate the courage of the BOJ Governor, who legally acted decisively to protect the Yen exchange rate from the shock of global upstream commodity import inflation.
------------------------------------------------------------------------------------------------------
The Nikkei 225 index's acceleration to its all-time high was driven structurally by the legal certainty of Japan's upstream monetary policy, which clashed with the internal debate within the committee:
✅ BOJ Raises Benchmark Interest Rate by 25 Basis Points to 1.00%
- ⚡Steps in Accordance with Consensus: The Bank of Japan officially executed a 25 basis point (bp) increase in its benchmark interest rate, locking the rate at 1.00%.
- ⚡Yen Stabilization Target & Energy Inflation: This hawkish measure was released as a comparative legal draft to curb the seepage of domestic inflation that had swelled due to the Strait of Hormuz conflict (Week 13), while also providing a rigid anchor to prevent the yen's persistently weak exchange rate against global currencies.
------------------------------------------------------------------------------------------------------
✅ Sectoral Transmission: AI Data Center Component Hysteria & Swiss Route Obstacles June 19
This macroeconomic stimulus triggered a global liquidity surge that hit the Japanese electronics and hardware components cluster:
The massive buying spree was led aggressively by issuers supporting the world's physical network and server infrastructure:
- ⚡Fujikura ($5803) Flying Rampage +8.8%: Leading the Japanese tech rally, responding directly to the surge in demand for copper and fiber optic cables in global data centers following the catalyst of OpenAI's secretive IPO and SpaceX's historic $2 trillion debut.
- ⚡Taiyo Yuden (+6.2%) & Murata Manufacturing (+5.9%): The multilayer capacitor (MLCC) manufacturing giant surged, validating the return of physical orders for upstream digital components.
- ⚡Kioxia Holdings (+4.4%) & Advantest (+3.1%): The flash memory cluster and semiconductor test equipment continued to post daily gains.  Long
Long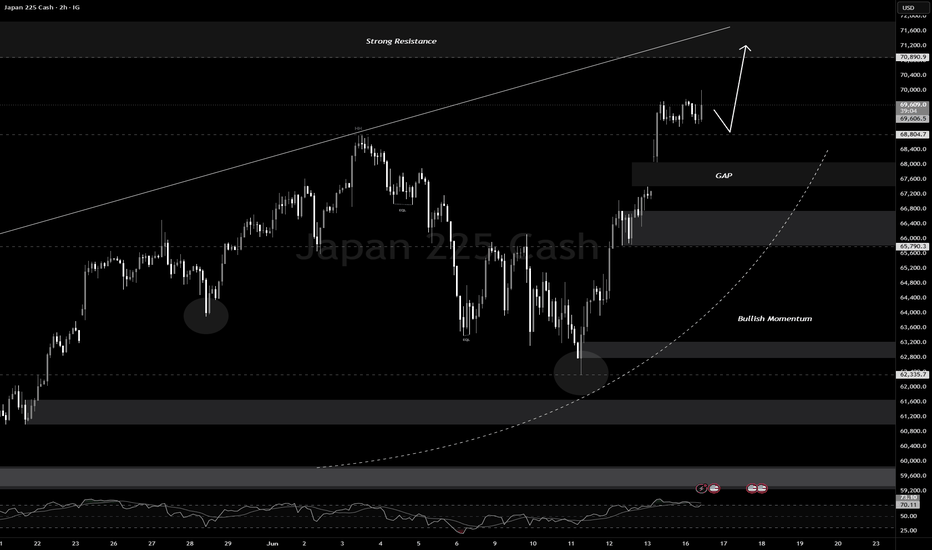
NIFTY KEY LEVELS FOR 16.06.2026NIFTY KEY LEVELS FOR 16.06.2026
Recommended Timeframe: 3 Minutes
If the candle stays above the pivot point, it is considered a bullish bias; if it remains below, it indicates a bearish bias. Price may reverse near Resistance 1 or Support 1. If it moves further, the next potential reversal zone is near Resistance 2 or Support 2. If these levels are also broken, we can expect the trend.
When a support or resistance level is broken, it often reverses its role; a broken resistance becomes the new support, and a broken support becomes the new resistance.
If the range(R2-S2) is narrow, the market may become volatile or trend strongly. If the range is wide, the market is more likely to remain sideways
Want to master this strategy and apply it to your daily trading? Reach out to me for details.
please like, comment and share my idea if you find it helpful
📢 Disclaimer
I am not a SEBI-registered financial adviser.
The information, views, and ideas shared here are purely for educational and informational purposes only. They are not intended as investment advice or a recommendation to buy, sell, or hold any financial instruments.
Please consult with your SEBI-registered financial advisor before making any trading or investment decisions.
Trading and investing in the stock market involves risk, and you should do your own research and analysis. You are solely responsible for any decisions made based on this research
#NIFTY Intraday Support and Resistance Levels - 16/06/2026Nifty 50 is expected to open with a gap-down bias near the 23800–23850 zone after facing profit booking from higher levels in the previous session. Despite the recent weakness, the broader trend remains positive as the index continues to trade above major support levels. Traders should watch the opening range carefully, as volatility may increase around key support zones.
For today's session, 23750–23800 remains the immediate support and reversal buying zone. If Nifty sustains above this area and attracts fresh buying interest, it can move towards 23850, 23900, and 23950+ levels. A strong breakout above 24050 may further strengthen bullish momentum and open the path towards 24150, 24200, and 24250+ levels.
On the downside, 23950–23900 acts as the primary resistance-based shorting zone. Failure to sustain above this range may trigger selling pressure towards 23850, 23800, and 23750 levels. If the index breaks below the crucial 23750 support, bearish momentum could intensify, leading to a decline towards 23650, 23600, and 23550 levels.
Overall, the market structure remains cautiously bullish despite the expected gap-down opening. Traders should focus on price action around the 23750–23800 support zone for potential reversal opportunities. Maintaining disciplined stop-losses and booking partial profits near target levels is advisable, especially as the market approaches important resistance zones. #BANKNIFTY Intraday PE & CE Levels(16/06/2026)Bank Nifty is expected to open with a flat bias near the 57150–57200 zone after a strong upside move in the previous sessions. The index is currently consolidating near higher levels, indicating a healthy pause within the ongoing bullish trend. Price action remains positive as long as key support zones continue to hold.
For today's session, 57050–57100 remains the immediate buying zone. A sustained move from this area can push Bank Nifty towards 57250, 57350, and 57450+ levels. If the index manages to break and sustain above 57550, fresh momentum buying may emerge, leading to an extended rally towards 57750, 57850, and 57950+ levels.
On the downside, 57450–57400 acts as the first resistance-based shorting zone. Rejection from this area may trigger a decline towards 57250, 57150, and 57050 levels. Additionally, 56950 remains the crucial support level. A breakdown below 56950 can accelerate selling pressure and drag the index towards 56750, 56650, and 56550 levels.  Long
Long
BANKNIFTY DAILYY/ Short range Level Analysis: 16th Jun 2026🔕 SGMN SplD BULLISH Above => 57418.
🔕 SGMN SplD Bearish BELOW => 56996.
Mentioned analysis based on 2 consecutive candle close in 15 min Time Frame.
━━━━━🟥🟧🟨🟩🟦🟪⬛━━━━━
💥Level Interpretation / description:
✍🏻L#1: If the candle crossed & stays above the “Buy Gen”, it is treated / considered as Bullish bias. Cfm=> Confirmation.
L#2: Possibility / Probability of REVERSAL near 🔕RL/TF1 & 🔔RL/TF2
L#3: If the candle stays above “Sell Gen” but below “Buy Gen”, it is treated / considered as Sidewise. Aggressive Traders can take Long position near “Sell Gen” either retesting or crossed from Below & vice-versa i.e. can take Short position near “Buy Gen” either retesting or crossed downward from Above.
L#4: If the candle crossed & stays below the “Sell Gen”, it is treated / considered a Bearish bias.
L#5: Possibility / Probability of REVERSAL near 🔕RL/TF1 & 🔔RL/TF2
HZB (Buy side) & HZS (Sell side) => Hurdle Zone,
✍🏻 *** Specialty of “HZB#1, HZB#2 HZS#1 & HZS#2” is Sidewise (behaviour in Nature)
Rest Plotted and Mentioned on Chart
Color code Used:
Green, BLUE =. Positive bias.
Safron, RED =. Negative bias.
RED in Between Green means Trend Finder / Momentum Change
/ CYCLE Change and Vice Versa.
Notice One thing: HOW LEVELS are Working.
Use any Momentum Indicator / Oscillator or as you "USED to" to Take entry.
━━━━━🟥🟧🟨🟩🟦🟪⬛━━━━━
⚠️ DISCLAIMER:
The information, views, and ideas shared here are purely for educational and informational purposes only. They are not intended as investment advice or a recommendation to buy, sell, or hold any financial instruments. I am not a SEBI-registered financial adviser.
Trading and investing in the stock market involves risk, and you should do your own research and analysis. You are solely responsible for any decisions made based on this research.
"🔔As HARD EARNED MONEY IS YOUR's, So DECISION SHOULD HAVE TO BE YOUR's".
━━━━━🟥🟧🟨🟩🟦🟪⬛━━━━━
❇️ Follow notification about periodical View
💥 Do Comment for Stock WEEKLY Level Analysis.🚀
📊 Do you agree with this view?
✈️ HIT THE PLANE ICON if this technical observation resonates with you. It will Motivate me.
━━━━━🟥🟧🟨🟩🟦🟪⬛━━━━━
💡 If You LOOKING any CHART & want for Level and ANALYZE?
Share your desired stock names in the comments below! I will try to analyze the chart Levels, patterns and share my technical view (so far my Knowledge).
If Viewers think It can identify meaningful setups. Looking forward to hearing from all of you — let's keep this discussion going and help each other make better trading decisions.
___________🔕^^^⚫⚪^🙏🏼🙏🏼🙏🏼^⚪⚫^^^🔔___________ NIFTY DAILY / Short Range Level Analysis for 16th Jun 2026🔕 SGMN SplD BULLISH Above => 23927.
🔕 SGMN SplD Bearish BELOW => 23786.
Mentioned analysis based on 2 consecutive candle close in 15 min Time Frame.
━━━━━🟥🟧🟨🟩🟦🟪⬛━━━━━
💥Level Interpretation / description:
✍🏻L#1: If the candle crossed & stays above the “Buy Gen”, it is treated / considered as Bullish bias. Cfm=> Confirmation.
L#2: Possibility / Probability of REVERSAL near 🔕RL/TF1 & 🔔RL/TF2
L#3: If the candle stays above “Sell Gen” but below “Buy Gen”, it is treated / considered as Sidewise. Aggressive Traders can take Long position near “Sell Gen” either retesting or crossed from Below & vice-versa i.e. can take Short position near “Buy Gen” either retesting or crossed downward from Above.
L#4: If the candle crossed & stays below the “Sell Gen”, it is treated / considered a Bearish bias.
L#5: Possibility / Probability of REVERSAL near 🔕RL/TF1 & 🔔RL/TF2
HZB (Buy side) & HZS (Sell side) => Hurdle Zone,
✍🏻 *** Specialty of “HZB#1, HZB#2 HZS#1 & HZS#2” is Sidewise (behaviour in Nature)
Rest Plotted and Mentioned on Chart
Color code Used:
Green, BLUE =. Positive bias.
Safron, RED =. Negative bias.
RED in Between Green means Trend Finder / Momentum Change
/ CYCLE Change and Vice Versa.
Notice One thing: HOW LEVELS are Working.
Use any Momentum Indicator / Oscillator or as you "USED to" to Take entry.
━━━━━🟥🟧🟨🟩🟦🟪⬛━━━━━
⚠️ DISCLAIMER:
The information, views, and ideas shared here are purely for educational and informational purposes only. They are not intended as investment advice or a recommendation to buy, sell, or hold any financial instruments. I am not a SEBI-registered financial adviser.
Trading and investing in the stock market involves risk, and you should do your own research and analysis. You are solely responsible for any decisions made based on this research.
"🔔As HARD EARNED MONEY IS YOUR's, So DECISION SHOULD HAVE TO BE YOUR's".
━━━━━🟥🟧🟨🟩🟦🟪⬛━━━━━
❇️ Follow notification about periodical View
💥 Do Comment for Stock WEEKLY Level Analysis.🚀
📊 Do you agree with this view?
✈️ HIT THE PLANE ICON if this technical observation resonates with you. It will Motivate me.
━━━━━🟥🟧🟨🟩🟦🟪⬛━━━━━
💡 If You LOOKING any CHART & want for Level and ANALYZE?
Share your desired stock names in the comments below! I will try to analyze the chart Levels, patterns and share my technical view (so far my Knowledge).
If Viewers think It can identify meaningful setups. Looking forward to hearing from all of you — let's keep this discussion going and help each other make better trading decisions.
___________🔕^^^⚫⚪^🙏🏼🙏🏼🙏🏼^⚪⚫^^^🔔___________ NIFTY ANALYSIS | TUESDAY, 16 JUNE 2026 |4H →1H→15-MIN→5-MIN TF# 📊 📊 NIFTY ANALYSIS | TUESDAY, 16 JUNE 2026 | 4H → 1H → 15-MIN → 5-MIN TF 🔥
## 🚨 FINAL VERDICT
### Market Bias
🟢 **Bullish**
### Institutional Summary
• Market Regime: Bullish Expansion
• Market Control: Buyers
• NIFTY Close: **23,853.90**
• Previous Close: **23,622.90**
• Gain: **+231 Points (+0.98%)**
• Option Chain Bias: Bullish
• Trader Action: Buy retracements, avoid emotional breakout chasing.
### Probability Matrix
🟢 Bullish: **68%**
🟡 Range Bound: **22%**
🔴 Bearish: **10%**
━━━━━━━━━━━━━━━━━━
# 🟢 HIGH-PROBABILITY CE TRADE (PRIMARY)
### Setup Quality
⭐⭐⭐⭐⭐
### Probability
🟢 68%
### Entry Zone
**23,760 - 23,700**
### Fibonacci Confluence
Using 15-Jun Range:
High = 24,011.40
Low = 23,817.80
Range = 193.60
38.2% Fib = **23,937**
50% Fib = **23,915**
61.8% Fib = **23,892**
### Preferred Buy Zone
🟢 **23,915 - 23,892**
(Fib 50% + Fib 61.8%)
### Stop Loss
23,815
(Below Day Low)
### Targets
🎯 T1: **24,000**
🎯 T2: **24,080**
🎯 T3: **24,160**
🎯 T4: **24,250**
### OI Confluence
✅ Largest Call OI above spot at 24,000
✅ Massive Put Writing at 23,800
✅ Strong Put Base at 23,500
### Institutional Logic
Institutions added **90,239 fresh contracts at 23,800 PE**, indicating aggressive support creation directly beneath spot.
━━━━━━━━━━━━━━━━━━
# 🔴 HIGH-PROBABILITY PE TRADE
### Setup Quality
⭐⭐⭐
### Probability
🔴 10%
### Entry Trigger
Below **23,800**
### Fibonacci Confluence
Loss of:
* 61.8% Retracement
* Put Writer Defense Zone
### Stop Loss
23,920
### Targets
🎯 T1: 23,700
🎯 T2: 23,620
🎯 T3: 23,500
### Institutional Logic
Only valid if aggressive put writers start unwinding.
Currently low probability.
━━━━━━━━━━━━━━━━━━
# 📐 SWING FIBONACCI (INSTITUTIONAL BIAS)
Using chart swing:
High ≈ 24,060
Low ≈ 23,072
### Key Levels
| Fib | Level |
| ----- | ------ |
| 23.6% | 23,305 |
| 38.2% | 23,449 |
| 50.0% | 23,566 |
| 61.8% | 23,683 |
| 78.6% | 23,849 |
### Institutional Interpretation
Current Close:
**23,853.90**
NIFTY closed **above the 78.6% swing retracement**.
This is significant.
A sustained hold above 23,849 opens the path toward retesting the prior swing high near 24,060.
━━━━━━━━━━━━━━━━━━
# 📐 DAILY FIBONACCI (EXECUTION LEVELS)
Using 15-Jun Session
High = 24,011.40
Low = 23,817.80
### Retracement Levels
| Fib | Level |
| ----- | ------ |
| 23.6% | 23,966 |
| 38.2% | 23,937 |
| 50.0% | 23,915 |
| 61.8% | 23,892 |
| 78.6% | 23,859 |
### Golden Pocket
🟢 **23,892 - 23,859**
### Extension Levels
| Extension | Level |
| --------- | ------ |
| 127.2% | 24,064 |
| 161.8% | 24,131 |
| 200% | 24,205 |
| 261.8% | 24,325 |
━━━━━━━━━━━━━━━━━━
# 🚨 INSTITUTIONAL DECISION MATRIX
## Market Regime
🟢 Bullish Expansion
### Why?
✅ 231-point gain
✅ Close above major swing Fib
✅ Strong global markets
✅ Strong Put Writing
✅ EMA alignment bullish
━━━━━━━━━━━━━━━━━━
## Who Controls The Market?
🟢 Buyers
### Evidence
• Price above EMA50 and EMA100
• Strong close
• Put writers defending 23,800
• Higher-high structure visible on chart
━━━━━━━━━━━━━━━━━━
# 📊 OPTION CHAIN ANALYSIS
### ATM Strike
**23,850**
### PCR
**0.95**
### Highest Call OI
📍 **24,000 CE**
OI = **284,199**
Fresh Addition = **122,636**
### Highest Put OI
📍 **23,500 PE**
OI = **159,456**
Fresh Addition = **28,850**
### Largest Fresh Call Writing
📍 **24,000 CE**
+122,636
### Largest Fresh Put Writing
📍 **23,800 PE**
+90,239
### OI Shift Analysis
* Put writers aggressively entered at 23,800.
* Strong support immediately below spot.
* 24,000 remains the major call wall.
* Market trapped between 23,800 support and 24,000 resistance.
━━━━━━━━━━━━━━━━━━
# 📈 4H TIMEFRAME ANALYSIS
### Trend
🟢 Bullish
### Swing Structure
Higher Highs
Higher Lows
### EMA Structure
Bullish Stack
### Momentum
Strong
### Institutional Interpretation
Primary trend remains upward.
━━━━━━━━━━━━━━━━━━
# 📉 1H TIMEFRAME ANALYSIS
### Structure
Bullish Continuation
### Momentum
Positive
### Volume
Expansion During Rally
### Interpretation
Buyers remain dominant.
━━━━━━━━━━━━━━━━━━
# ⏱️ 15-MINUTE TRADE FRAMEWORK
## 🔴 Resistance
24,000
24,064
24,131
24,205
## 🟢 Support
23,892
23,859
23,800
23,700
### Trigger Zones
🟢 Bullish Trigger
24,000 Break
🔴 Bearish Trigger
23,800 Break
━━━━━━━━━━━━━━━━━━
# ⚡ 5-MINUTE EXECUTION PLAN
## For CE Buyers
✔ Buy Fib Retracement
✔ Buy Golden Pocket
✔ VWAP Hold
✔ Volume Expansion
---
## For PE Buyers
✔ Only Below 23,800
✔ Breakdown Confirmation Required
---
## For Option Sellers
Prefer Put Selling Above 23,800
━━━━━━━━━━━━━━━━━━
# 🧠 MARKET PSYCHOLOGY
### Retail Behaviour
Likely chasing upside after strong green day.
### Institutional Behaviour
Accumulating on retracements while defending 23,800.
### Current Edge
🟢 Buyers
━━━━━━━━━━━━━━━━━━
# 📌 TRADING DAY SCENARIOS
## Scenario 1 (Highest Probability)
### Probability
68%
### Trigger
Above 23,849
### Targets
24,000 → 24,064 → 24,131
---
## Scenario 2
### Probability
22%
### Trigger
23,800 - 24,000
### Outcome
Range Consolidation
---
## Scenario 3
### Probability
10%
### Trigger
Below 23,800
### Targets
23,700 → 23,620 → 23,500
━━━━━━━━━━━━━━━━━━
# 🚫 INVALIDATION LEVEL
### Entire Bullish Thesis Invalid Below
🔴 **23,800**
(Strongest Fresh Put Writing Zone)
━━━━━━━━━━━━━━━━━━
# 🔥 TRADER NOTE
The most important development in the option chain is **90,239 fresh contracts added at 23,800 PE**.
That is where institutions publicly placed their line in the sand.
As long as NIFTY holds above **23,800**, the path of least resistance remains toward **24,000 and above**.
The highest-probability trade for 16 June is not buying random green candles. It is buying retracements into the **23,915-23,892 Fibonacci support cluster** while 23,800 remains defended.
#mfi #moneyflowindex #tradingsignals #stockmarketindia #technicalanalysis #priceaction #daytrading #swingtrading #optiontrading #nifty50 #banknifty #volumeanalysis #momentumtrading #tradingstrategy #marketstructure #candlestick #supportandresistance #traderlife #marketanalysis
Long 
NIFTY BANK Analysis [For 16.06.2026: Tuesday]Probable Scenario Analysis.
(1) Bullish Scenario:
If price starts to trade above 57500 and forms a higher-highs and lower-lows structure, then there will be a weak bullish move to 57750. Level 57750 is weak resistance. Next, if price breaks out above the level 57750, then there will be a strong bullish move. The probable strong bullish moves above the level 57750 are - 58000, 58250, and 58500. There will be strong resistance at the level 58500.
(2) Bearish Scenario:
There is no observable bearish scenario. Level 56500 is strong support. In case the price breaks down below the level of 56500. Then a weak bearish setup will activate. The probable weak bearish setups below the level 56500 are - 56250 and 56000. The level 56000 would offer good support. Lastly, if the price breaks down below the level of 56000, then there will be sharp selling. The probable bearish moves below the level 56000 are - 55750, 55500, and 55250.
(3) No Trading Zone (NTZ): (57500 - 56500).
Here, the zone (57500 - 57250) is a strong resistance zone. The zone (56750 - 56500) is a strong support zone. The price trading inside these two zones would be confusing for both the bulls and the bears. For trend trading, we have to wait for a breakout or breakdown. On the contrary, if the price stays within the NTZ, then we have to either execute non-directional strategies or not trade.
(4) Availability of an Unfilled GAP: (57000 - 56750).
There is a high probability that the price will fill this gap, as it is trapped in a zone. Also, Tuesday is Nifty 50 expiry. We can expect GAP filling in the first half of the session.
(5) Event:
There are no high-impact events or holidays in the week. There is NIFTY 50 weekly expiry. So, we can expect a price anomaly. We can also expect more sideways, range-bound, and indecisive moves as the market has already offered too much trend. The non-directional traders also need an opportunity to make money. Thus, we have to wait for clarity.
(6) Establish intraday bias with respect to the opening price. If the price sustains above the opening price, then don't think of shorting. Look for bullish trades only. On the contrary, if the price sustains below the opening price, then don't think of going long. Look for bearish trades in that case.
END NOTE:
(i) All the analyses would fail in the case of a major gap up, gap down, or price structure anomaly. Thus, practice PRAGMATISM in the live session.
(ii) Trade only if there is a set-up. Remember, not trading is an extension of the trading activity.
(iii) Mark your points. Trade your points. Price is GOD. Anything can happen in the markets. Thus, trade what you see, not what you believe.
(iv) Always PRACTICE RISK MANAGEMENT. Always PROTECT YOUR CAPITAL. Be RESPONSIBLE.
(v) Be Strategic. Be Courageous. Be Patient. Be Wise.
(vi) Every day is a new day. Thus, do not carry the baggage of past successes or failures. Leave the gardens of winning and losing. Establish yourself in equanimity. Always think from a new perspective.
(vii) Let the joy of trading drive your effectiveness, not greed or fear. Believe in Possibilities.
Happy Trading! NIFTY started the week with a strong gap-upNIFTY started the week with a strong gap-up move but failed to hold higher levels throughout the session.
On the daily chart, the index remains below the 20 EMA and 50 EMA, keeping the broader structure cautious despite the recent bounce from 23,000. Today's recovery pushed NIFTY back above the 100 EMA near 23,760, which now becomes an important support zone to watch.
However, the bigger hurdle remains near 24,000–24,100 where multiple moving averages and previous supply zones are clustered. Unless the index sustains above this area, rallies may continue to face resistance.
On the intraday chart, NIFTY opened with strong momentum and rallied sharply toward 24,000. But profit booking emerged near resistance, leading to a gradual decline during the second half. This suggests buyers were active at lower levels, but conviction faded near overhead supply.
📚 Trading Lesson:
A gap-up opening does not automatically mean a bullish day.
What matters is whether price can hold above key resistance after the gap.
Today, NIFTY showed strength in the morning but faced supply near a known resistance zone. This is why traders should focus on where price gets rejected, not just where it opens.
The trend improves when resistance turns into support.
Long 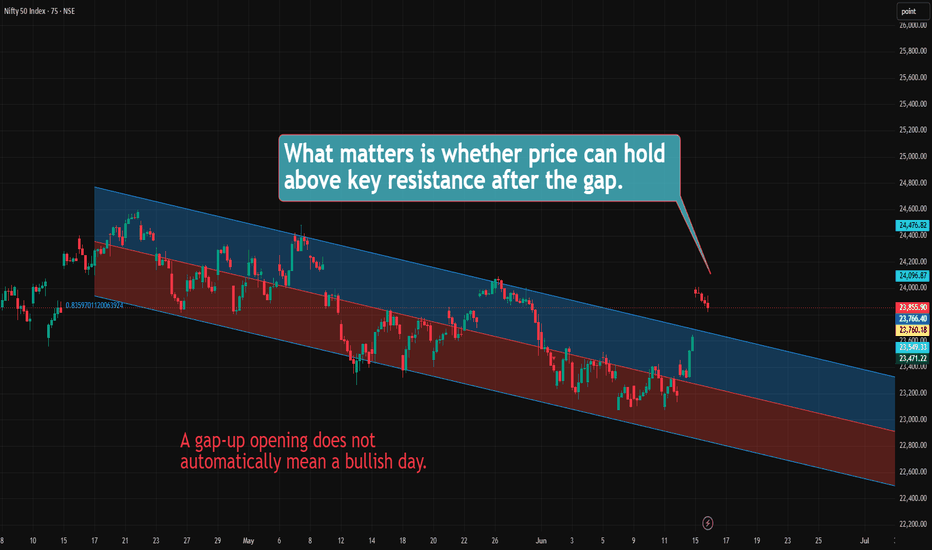
Long 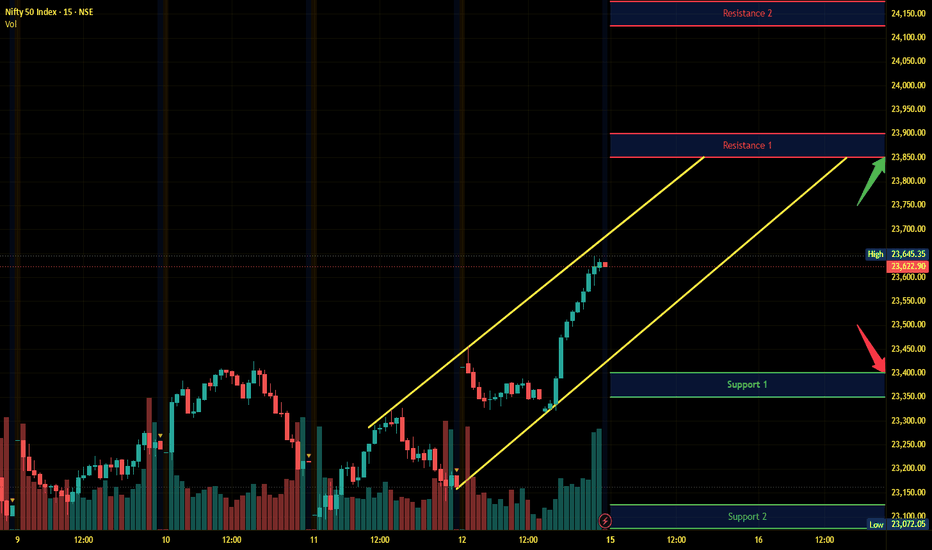
 Long
Long