Education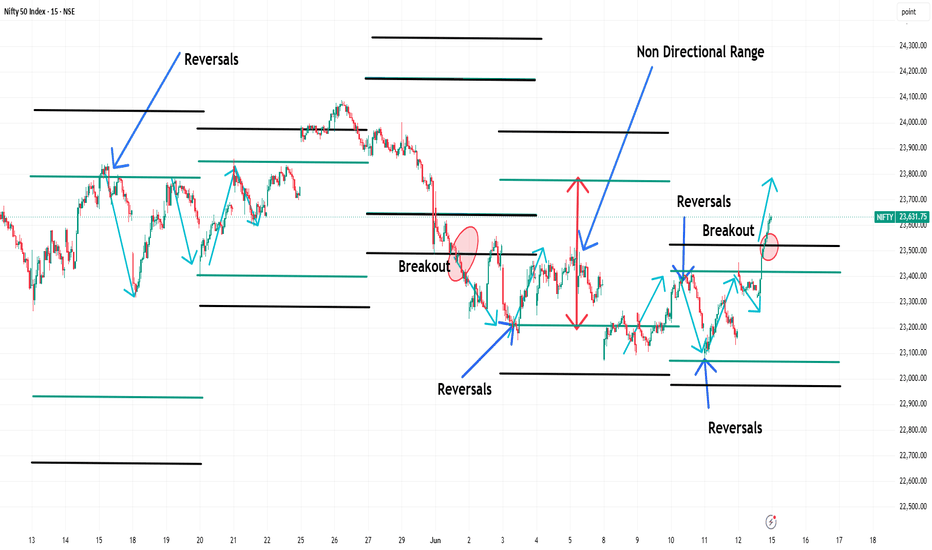
NIFTY MIDCAP SELECT DAILYY Level Analysis: 15th Jun 2026🔕 SGMN SplD BULLISH Above => 14296.
🔕 SGMN SplD Bearish BELOW => 14180.
Mentioned analysis based on 2 consecutive candle close in 15 min Time Frame.
━━━━━🟥🟧🟨🟩🟦🟪⬛━━━━━
💥Level Interpretation / description:
✍🏻L#1: If the candle crossed & stays above the “Buy Gen”, it is treated / considered as Bullish bias. Cfm=> Confirmation.
L#2: Possibility / Probability of REVERSAL near 🔕RL/TF1 & 🔔RL/TF2
L#3: If the candle stays above “Sell Gen” but below “Buy Gen”, it is treated / considered as Sidewise. Aggressive Traders can take Long position near “Sell Gen” either retesting or crossed from Below & vice-versa i.e. can take Short position near “Buy Gen” either retesting or crossed downward from Above.
L#4: If the candle crossed & stays below the “Sell Gen”, it is treated / considered a Bearish bias.
L#5: Possibility / Probability of REVERSAL near 🔕RL/TF1 & 🔔RL/TF2
HZB (Buy side) & HZS (Sell side) => Hurdle Zone,
✍🏻 *** Specialty of “HZB#1, HZB#2 HZS#1 & HZS#2” is Sidewise (behaviour in Nature)
Rest Plotted and Mentioned on Chart
Color code Used:
Green, BLUE =. Positive bias.
Safron, RED =. Negative bias.
RED in Between Green means Trend Finder / Momentum Change
/ CYCLE Change and Vice Versa.
Notice One thing: HOW LEVELS are Working.
Use any Momentum Indicator / Oscillator or as you "USED to" to Take entry.
━━━━━🟥🟧🟨🟩🟦🟪⬛━━━━━
⚠️ DISCLAIMER:
The information, views, and ideas shared here are purely for educational and informational purposes only. They are not intended as investment advice or a recommendation to buy, sell, or hold any financial instruments. I am not a SEBI-registered financial adviser.
Trading and investing in the stock market involves risk, and you should do your own research and analysis. You are solely responsible for any decisions made based on this research.
"🔔As HARD EARNED MONEY IS YOUR's, So DECISION SHOULD HAVE TO BE YOUR's".
━━━━━🟥🟧🟨🟩🟦🟪⬛━━━━━
❇️ Follow notification about periodical View
💥 Do Comment for Stock WEEKLY Level Analysis.🚀
📊 Do you agree with this view?
✈️ HIT THE PLANE ICON if this technical observation resonates with you. It will Motivate me.
━━━━━🟥🟧🟨🟩🟦🟪⬛━━━━━
💡 If You LOOKING any CHART & want for Level and ANALYZE?
Share your desired stock names in the comments below! I will try to analyze the chart Levels, patterns and share my technical view (so far my Knowledge).
If Viewers think It can identify meaningful setups. Looking forward to hearing from all of you — let's keep this discussion going and help each other make better trading decisions.
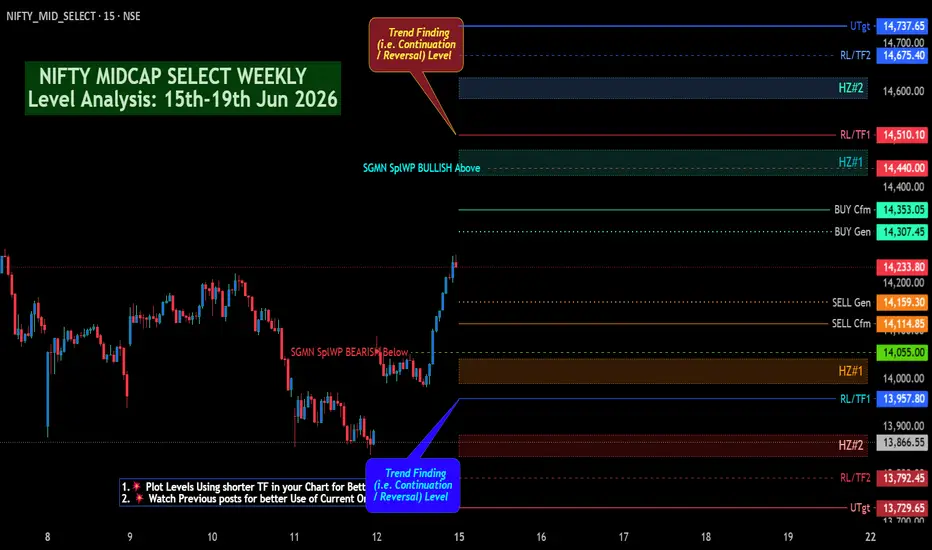
___________🔕^^^⚫⚪^🙏🏼🙏🏼🙏🏼^⚪⚫^^^🔔___________ NIFTY MIDCAP SELECT WEEKLY Level Analysis: 15th-19th Jun 2026🔔 SGMN SplWP Above BULLISH BIAS => 14440.
🔔 SGMN SplWP BELOW Bearish BIAS => 14055.
Mentioned analysis based on 2 consecutive candle close in 15 min Time Frame.
━━━━━🟥🟧🟨🟩🟦🟪⬛━━━━━
💥Level Interpretation / description:
✍🏻L#1: If the candle crossed & stays above the “Buy Gen”, it is treated / considered as Bullish bias. Cfm=> Confirmation.
L#2: Possibility / Probability of REVERSAL near 🔕RL/TF1 & 🔔RL/TF2
L#3: If the candle stays above “Sell Gen” but below “Buy Gen”, it is treated / considered as Sidewise. Aggressive Traders can take Long position near “Sell Gen” either retesting or crossed from Below & vice-versa i.e. can take Short position near “Buy Gen” either retesting or crossed downward from Above.
L#4: If the candle crossed & stays below the “Sell Gen”, it is treated / considered a Bearish bias.
L#5: Possibility / Probability of REVERSAL near 🔕RL/TF1 & 🔔RL/TF2
HZB (Buy side) & HZS (Sell side) => Hurdle Zone,
✍🏻 *** Specialty of “HZB#1, HZB#2 HZS#1 & HZS#2” is Sidewise (behaviour in Nature)
Rest Plotted and Mentioned on Chart
Color code Used:
Green, BLUE =. Positive bias.
Safron, RED =. Negative bias.
RED in Between Green means Trend Finder / Momentum Change
/ CYCLE Change and Vice Versa.
Notice One thing: HOW LEVELS are Working.
Use any Momentum Indicator / Oscillator or as you "USED to" to Take entry.
━━━━━🟥🟧🟨🟩🟦🟪⬛━━━━━
⚠️ DISCLAIMER:
The information, views, and ideas shared here are purely for educational and informational purposes only. They are not intended as investment advice or a recommendation to buy, sell, or hold any financial instruments. I am not a SEBI-registered financial adviser.
Trading and investing in the stock market involves risk, and you should do your own research and analysis. You are solely responsible for any decisions made based on this research.
"🔔As HARD EARNED MONEY IS YOUR's, So DECISION SHOULD HAVE TO BE YOUR's".
━━━━━🟥🟧🟨🟩🟦🟪⬛━━━━━
❇️ Follow notification about periodical View
💥 Do Comment for Stock WEEKLY Level Analysis.🚀
📊 Do you agree with this view?
✈️ HIT THE PLANE ICON if this technical observation resonates with you. It will Motivate me.
━━━━━🟥🟧🟨🟩🟦🟪⬛━━━━━
💡 If You LOOKING any CHART & want for Level and ANALYZE?
Share your desired stock names in the comments below! I will try to analyze the chart Levels, patterns and share my technical view (so far my Knowledge).
If Viewers think It can identify meaningful setups. Looking forward to hearing from all of you — let's keep this discussion going and help each other make better trading decisions.
___________🔕^^^⚫⚪^🙏🏼🙏🏼🙏🏼^⚪⚫^^^🔔___________
SENSEX DAILY / Short Range Level Analysis for 15th Jun 2026🔕 SGMN SplD BULLISH Above => 75702.
🔕 SGMN SplD Bearish BELOW => 75364.
Mentioned analysis based on 2 consecutive candle close in 15 min Time Frame.
━━━━━🟥🟧🟨🟩🟦🟪⬛━━━━━
💥Level Interpretation / description:
✍🏻L#1: If the candle crossed & stays above the “Buy Gen”, it is treated / considered as Bullish bias. Cfm=> Confirmation.
L#2: Possibility / Probability of REVERSAL near 🔕RL/TF1 & 🔔RL/TF2
L#3: If the candle stays above “Sell Gen” but below “Buy Gen”, it is treated / considered as Sidewise. Aggressive Traders can take Long position near “Sell Gen” either retesting or crossed from Below & vice-versa i.e. can take Short position near “Buy Gen” either retesting or crossed downward from Above.
L#4: If the candle crossed & stays below the “Sell Gen”, it is treated / considered a Bearish bias.
L#5: Possibility / Probability of REVERSAL near 🔕RL/TF1 & 🔔RL/TF2
HZB (Buy side) & HZS (Sell side) => Hurdle Zone,
✍🏻 *** Specialty of “HZB#1, HZB#2 HZS#1 & HZS#2” is Sidewise (behaviour in Nature)
Rest Plotted and Mentioned on Chart
Color code Used:
Green, BLUE =. Positive bias.
Safron, RED =. Negative bias.
RED in Between Green means Trend Finder / Momentum Change
/ CYCLE Change and Vice Versa.
Notice One thing: HOW LEVELS are Working.
Use any Momentum Indicator / Oscillator or as you "USED to" to Take entry.
━━━━━🟥🟧🟨🟩🟦🟪⬛━━━━━
⚠️ DISCLAIMER:
The information, views, and ideas shared here are purely for educational and informational purposes only. They are not intended as investment advice or a recommendation to buy, sell, or hold any financial instruments. I am not a SEBI-registered financial adviser.
Trading and investing in the stock market involves risk, and you should do your own research and analysis. You are solely responsible for any decisions made based on this research.
"🔔As HARD EARNED MONEY IS YOUR's, So DECISION SHOULD HAVE TO BE YOUR's".
━━━━━🟥🟧🟨🟩🟦🟪⬛━━━━━
❇️ Follow notification about periodical View
💥 Do Comment for Stock WEEKLY Level Analysis.🚀
📊 Do you agree with this view?
✈️ HIT THE PLANE ICON if this technical observation resonates with you. It will Motivate me.
━━━━━🟥🟧🟨🟩🟦🟪⬛━━━━━
💡 If You LOOKING any CHART & want for Level and ANALYZE?
Share your desired stock names in the comments below! I will try to analyze the chart Levels, patterns and share my technical view (so far my Knowledge).
If Viewers think It can identify meaningful setups. Looking forward to hearing from all of you — let's keep this discussion going and help each other make better trading decisions.
___________🔕^^^⚫⚪^🙏🏼🙏🏼🙏🏼^⚪⚫^^^🔔___________ SENSEX WEEKLY /Positional Level Analysis: 15th-19th Jun 2026SENSEX WEEKLY /Positional Level Analysis: 15th-19th Jun 2026.
🔔 SGMN SplWP BULLISH Above => 76190.
🔔 SGMN SplP BEARISH Below => 74899.
Mentioned analysis based on 2 consecutive candle close in 15 min Time Frame.
━━━━━🟥🟧🟨🟩🟦🟪⬛━━━━━
💥Level Interpretation / description:
✍🏻L#1: If the candle crossed & stays above the “Buy Gen”, it is treated / considered as Bullish bias. Cfm=> Confirmation.
L#2: Possibility / Probability of REVERSAL near 🔕RL/TF1 & 🔔RL/TF2
L#3: If the candle stays above “Sell Gen” but below “Buy Gen”, it is treated / considered as Sidewise. Aggressive Traders can take Long position near “Sell Gen” either retesting or crossed from Below & vice-versa i.e. can take Short position near “Buy Gen” either retesting or crossed downward from Above.
L#4: If the candle crossed & stays below the “Sell Gen”, it is treated / considered a Bearish bias.
L#5: Possibility / Probability of REVERSAL near 🔕RL/TF1 & 🔔RL/TF2
HZB (Buy side) & HZS (Sell side) => Hurdle Zone,
✍🏻 *** Specialty of “HZB#1, HZB#2 HZS#1 & HZS#2” is Sidewise (behaviour in Nature)
Rest Plotted and Mentioned on Chart
Color code Used:
Green, BLUE =. Positive bias.
Safron, RED =. Negative bias.
RED in Between Green means Trend Finder / Momentum Change
/ CYCLE Change and Vice Versa.
Notice One thing: HOW LEVELS are Working.
Use any Momentum Indicator / Oscillator or as you "USED to" to Take entry.
━━━━━🟥🟧🟨🟩🟦🟪⬛━━━━━
⚠️ DISCLAIMER:
The information, views, and ideas shared here are purely for educational and informational purposes only. They are not intended as investment advice or a recommendation to buy, sell, or hold any financial instruments. I am not a SEBI-registered financial adviser.
Trading and investing in the stock market involves risk, and you should do your own research and analysis. You are solely responsible for any decisions made based on this research.
"🔔As HARD EARNED MONEY IS YOUR's, So DECISION SHOULD HAVE TO BE YOUR's".
━━━━━🟥🟧🟨🟩🟦🟪⬛━━━━━
❇️ Follow notification about periodical View
💥 Do Comment for Stock WEEKLY Level Analysis.🚀
📊 Do you agree with this view?
✈️ HIT THE PLANE ICON if this technical observation resonates with you. It will Motivate me.
━━━━━🟥🟧🟨🟩🟦🟪⬛━━━━━
💡 If You LOOKING any CHART & want for Level and ANALYZE?
Share your desired stock names in the comments below! I will try to analyze the chart Levels, patterns and share my technical view (so far my Knowledge).
If Viewers think It can identify meaningful setups. Looking forward to hearing from all of you — let's keep this discussion going and help each other make better trading decisions.
___________🔕^^^⚫⚪^🙏🏼🙏🏼🙏🏼^⚪⚫^^^🔔___________  Education

Nifty Rebounds Strongly, But Has the Trend Really Changed?After two straight weeks of losses, the Indian market finally bounced back.
The Nifty 50 gained 1.1% last week, with nearly 2% of that gain coming on Friday alone. The rally was supported by easing concerns around the Middle East, softer crude oil prices, and improving global market sentiment.
Investor confidence also improved as India VIX fell 6.8% to 14.71, signaling lower levels of fear and uncertainty in the market.
At first glance, it may seem like the bulls have regained control.
But when we look at the chart more closely, the picture is still not completely clear.
The Recovery Is Positive, But a Key Hurdle Remains
There is no doubt that last week's rebound has improved market sentiment.
However, Nifty is still trading below an important falling trendline that has repeatedly stopped previous recovery attempts.
This trendline remains a major technical barrier.
So while the market has bounced sharply, it has not yet delivered the kind of breakout that would confirm a stronger uptrend.
In simple terms:
The recovery is encouraging, but the market still needs to prove that it can break above resistance and sustain higher levels.
The Levels That Matter This Week
📍 24,000 – 24,100: The Key Resistance Zone
This remains the most important hurdle for the bulls.
A decisive move above this area could strengthen momentum, attract fresh buying interest, and improve the short-term outlook for the broader market.
Until that happens, traders should be cautious about assuming that the rally has fully changed the trend.
📍 23,500 – 23,400: Immediate Support Zone
This is the nearest support area that needs to hold.
As long as Nifty remains above this zone, the recent recovery remains intact and buyers retain the short-term advantage.
📍 23,000 – 22,900: Stronger Support Area
If selling pressure returns, this becomes the next important zone to watch.
Three Events Investors Should Watch Closely
1️⃣ US Federal Reserve Meeting
The market largely expects the Federal Reserve to leave interest rates unchanged.
However, investors will pay close attention to the Fed's commentary and future guidance. Any clues about upcoming rate cuts or policy changes could influence global market sentiment.
2️⃣ Developments in the US-Iran Situation
Geopolitical tensions remain an important factor for global markets.
Any signs of progress toward a peace agreement or de-escalation could further improve risk appetite and support equities worldwide.
3️⃣ Crude Oil Prices
Lower and stable crude prices help reduce inflation pressures and improve the outlook for the economy.
What Does This Mean for Traders?
The broader market structure remains constructive as long as the 23,500 support zone continues to hold.
If global cues remain favorable, a move toward the 24,000 resistance area appears achievable in the near term.
That said, traders should remember that the market has not yet confirmed a fresh uptrend. The recent rebound is positive, but it still needs validation through a sustained breakout above resistance.
The Bottom Line
Last week's rally has certainly improved sentiment and reduced near-term concerns.
But from a technical perspective, the story is still unfinished.
The 24,000–24,100 zone is likely to determine whether this rally has more room to run or whether the market returns to consolidation.
For now, a sector-specific approach may offer better opportunities than making aggressive index-level bets.
Patience remains important.
The market is showing signs of strength, but it still needs to earn full confidence before participants can conclude that the trend has truly changed. Long 
Education

Nifty - Weekly analysis June 15 to June 19Last week, the price took support from the 23080 zone, broke an important zone 23500 and closed above it. It indicates the price is bullish(mild). To move up, the price should break and sustain above the nearest resistance at the 23800 zone.
As per the daily chart, the price is testing the trend line resistance.
Buy above 23600 with the stop loss of 23540 for the targets 23660, 23720, 23760, 23820, 23880, 23940, 24000 and 24060.
Sell below 23420 with the stop loss of 23480 for the targets 23360, 23300, 23240, 23180, 23120, and 23040.
Always do your analysis before taking any trade. BANKNIFTY WEEKLY/ POSITIONAL Level Analysis: 15th-19th Jun 2026🔔 SGMN SplW Above BULLISH BIAS => 56881.
🔔 SGMN SplW BELOW Bearish BIAS => 56325.
Mentioned analysis based on 2 consecutive candle close in 15 min Time Frame.
━━━━━🟥🟧🟨🟩🟦🟪⬛━━━━━
💥Level Interpretation / description:
✍🏻L#1: If the candle crossed & stays above the “Buy Gen”, it is treated / considered as Bullish bias. Cfm=> Confirmation.
L#2: Possibility / Probability of REVERSAL near 🔕RL/TF1 & 🔔RL/TF2
L#3: If the candle stays above “Sell Gen” but below “Buy Gen”, it is treated / considered as Sidewise. Aggressive Traders can take Long position near “Sell Gen” either retesting or crossed from Below & vice-versa i.e. can take Short position near “Buy Gen” either retesting or crossed downward from Above.
L#4: If the candle crossed & stays below the “Sell Gen”, it is treated / considered a Bearish bias.
L#5: Possibility / Probability of REVERSAL near 🔕RL/TF1 & 🔔RL/TF2
HZB (Buy side) & HZS (Sell side) => Hurdle Zone,
✍🏻 *** Specialty of “HZB#1, HZB#2 HZS#1 & HZS#2” is Sidewise (behaviour in Nature)
Rest Plotted and Mentioned on Chart
Color code Used:
Green, BLUE =. Positive bias.
Safron, RED =. Negative bias.
RED in Between Green means Trend Finder / Momentum Change
/ CYCLE Change and Vice Versa.
Notice One thing: HOW LEVELS are Working.
Use any Momentum Indicator / Oscillator or as you "USED to" to Take entry.
━━━━━🟥🟧🟨🟩🟦🟪⬛━━━━━
⚠️ DISCLAIMER:
The information, views, and ideas shared here are purely for educational and informational purposes only. They are not intended as investment advice or a recommendation to buy, sell, or hold any financial instruments. I am not a SEBI-registered financial adviser.
Trading and investing in the stock market involves risk, and you should do your own research and analysis. You are solely responsible for any decisions made based on this research.
"🔔As HARD EARNED MONEY IS YOUR's, So DECISION SHOULD HAVE TO BE YOUR's".
━━━━━🟥🟧🟨🟩🟦🟪⬛━━━━━
❇️ Follow notification about periodical View
💥 Do Comment for Stock WEEKLY Level Analysis.🚀
📊 Do you agree with this view?
✈️ HIT THE PLANE ICON if this technical observation resonates with you. It will Motivate me.
━━━━━🟥🟧🟨🟩🟦🟪⬛━━━━━
💡 If You LOOKING any CHART & want for Level and ANALYZE?
Share your desired stock names in the comments below! I will try to analyze the chart Levels, patterns and share my technical view (so far my Knowledge).
If Viewers think It can identify meaningful setups. Looking forward to hearing from all of you — let's keep this discussion going and help each other make better trading decisions.
___________🔕^^^⚫⚪^🙏🏼🙏🏼🙏🏼^⚪⚫^^^🔔___________ BANKNIFTY DAILYY /Short Range Level Analysis for 15th Jun 2026🔕 SGMN SplD BULLISH Above => 57018.
🔕 SGMN SplD Bearish BELOW => 56622.
Mentioned analysis based on 2 consecutive candle close in 15 min Time Frame.
━━━━━🟥🟧🟨🟩🟦🟪⬛━━━━━
💥Level Interpretation / description:
✍🏻L#1: If the candle crossed & stays above the “Buy Gen”, it is treated / considered as Bullish bias. Cfm=> Confirmation.
L#2: Possibility / Probability of REVERSAL near 🔕RL/TF1 & 🔔RL/TF2
L#3: If the candle stays above “Sell Gen” but below “Buy Gen”, it is treated / considered as Sidewise. Aggressive Traders can take Long position near “Sell Gen” either retesting or crossed from Below & vice-versa i.e. can take Short position near “Buy Gen” either retesting or crossed downward from Above.
L#4: If the candle crossed & stays below the “Sell Gen”, it is treated / considered a Bearish bias.
L#5: Possibility / Probability of REVERSAL near 🔕RL/TF1 & 🔔RL/TF2
HZB (Buy side) & HZS (Sell side) => Hurdle Zone,
✍🏻 *** Specialty of “HZB#1, HZB#2 HZS#1 & HZS#2” is Sidewise (behaviour in Nature)
Rest Plotted and Mentioned on Chart
Color code Used:
Green, BLUE =. Positive bias.
Safron, RED =. Negative bias.
RED in Between Green means Trend Finder / Momentum Change
/ CYCLE Change and Vice Versa.
Notice One thing: HOW LEVELS are Working.
Use any Momentum Indicator / Oscillator or as you "USED to" to Take entry.
━━━━━🟥🟧🟨🟩🟦🟪⬛━━━━━
⚠️ DISCLAIMER:
The information, views, and ideas shared here are purely for educational and informational purposes only. They are not intended as investment advice or a recommendation to buy, sell, or hold any financial instruments. I am not a SEBI-registered financial adviser.
Trading and investing in the stock market involves risk, and you should do your own research and analysis. You are solely responsible for any decisions made based on this research.
"🔔As HARD EARNED MONEY IS YOUR's, So DECISION SHOULD HAVE TO BE YOUR's".
━━━━━🟥🟧🟨🟩🟦🟪⬛━━━━━
❇️ Follow notification about periodical View
💥 Do Comment for Stock WEEKLY Level Analysis.🚀
📊 Do you agree with this view?
✈️ HIT THE PLANE ICON if this technical observation resonates with you. It will Motivate me.
━━━━━🟥🟧🟨🟩🟦🟪⬛━━━━━
💡 If You LOOKING any CHART & want for Level and ANALYZE?
Share your desired stock names in the comments below! I will try to analyze the chart Levels, patterns and share my technical view (so far my Knowledge).
If Viewers think It can identify meaningful setups. Looking forward to hearing from all of you — let's keep this discussion going and help each other make better trading decisions.
___________🔕^^^⚫⚪^🙏🏼🙏🏼🙏🏼^⚪⚫^^^🔔___________ NIFTY 50 (1H) – Trendline Breakout Loading? Bulls Face Two Major🟢 Simple Chart Explanation:
After taking support from the 23,050–23,100 demand zone, NIFTY has shown a strong recovery and is now testing a key descending trendline resistance.
The recent bullish move indicates buyers are stepping back into the market, but the real test lies ahead.
📌 What the Chart Shows:
✅ Strong accumulated support around 23,070
✅ Sharp bullish reaction from demand zone
✅ Price has reached the falling trendline resistance
✅ Breakout attempt underway after weeks of lower highs
🎯 Key Levels to Watch:
🔹 Trendline Resistance: 23,650–23,700
🔹 Hurdle 1: 24,050–24,100
🔹 Hurdle 2: 24,450–24,500
🔹 Major Support: 23,050–23,100
💡 Price Action Insight:
* Buyers successfully defended the support zone multiple times.
* Price is now approaching the first major decision area.
* A sustained move above the trendline can shift short-term momentum in favor of the bulls.
* Clearing Hurdle 1 could open the path toward Hurdle 2.
📈 Bias:
Bullish above 23,500
As long as the support zone remains intact, the structure favors higher levels. The next few sessions will be crucial as NIFTY approaches important resistance zones.
⸻
⚠️ Disclaimer
This analysis is shared solely for educational and informational purposes.
I am not a SEBI-registered investment advisor.
The views expressed are based on personal chart analysis and should not be considered financial, investment, or trading advice.
Trading and investing in financial markets involve substantial risk, including the potential loss of capital.
Please conduct your own research and consult a SEBI-registered financial advisor before making any investment or trading decisions. Long 
Nifty Bias & Price Action Analysis Nifty is currently down 10.54% from its last all-time high.
Nifty entered a bearish and choppy price action phase after 6th March, when it experienced a market structure shift below 24,298 and continued to move lower.
This price action led to Nifty trading in a choppy range for nearly three months, with only minor relief rallies.
I expect two possible price paths from here. The first is the Red Path, where I expect Nifty to sweep 24,000 and then make a liquidity sweep down to 21,686 before moving back toward 26,000.
Green Path: I expect Nifty to sweep the last swing high, make a move lower to grab liquidity, and then continue higher.
Main Playbook: Nifty needs to reclaim and flip the last weekly swing high around 24,600 into support to turn bullish from a price action perspective. Otherwise, I expect the market to remain choppy and range-bound.
NIFTY BANK Price Structure Analysis [For 15.06.2026: Monday]Probable Price Structure Analysis of NSE:BANKNIFTY for the 15th of June, 2026. The day is Monday.
(1) Bullish Scenario:
If the price stays above the level of 56500, then stay bullish. The probable bullish targets above the level of 56500 are - 56750, 57000, 57250, and 57500. The price will experience good resistance at the level of 57500. Next, if the price decisively breaks out above the level of 57500, then the probable bullish targets would be - 57750 and 58000.
(2) Bearish Scenario:
There is no observable bearish scenario. The level of 55750 is strong support. In case the price breaks down below the level of 55750, then the probable bearish targets would be - 55500, 55250, and 55000.
(3) No Trading Zone (NTZ): (56500 - 55750).
(4) Range of Consolidation (ROC): (57000 - 56000).
Here, the median of the ROC is 56500. If price stays above the median, then think only about executing bullish trades. On the contrary, if the price sustains below the level of 56500, then the price will be trading in the no-trading zone (NTZ). In that case, don't trade.
(5) Availability of an Unfilled GAP: (55750 - 55250).
We have to always discount the factor of an unfilled gap, as anything can happen in the market. There is a low probability of gap filling. Yet, we should keep it in mind while trading.
(6) Event:
There are no high-impact events or holidays in the week. However, we have to keep an eye on the geopolitical developments, Crude Oil Price, and USDINR.
(7) Establish intraday bias with respect to the opening price. If the price sustains above the opening price, then don't think of shorting. Look for bullish trades only. On the contrary, if the price sustains below the opening price, then don't think of going long. Look for bearish trades in that case.
Top-Down Analysis:
(1) Monthly TF:
The monthly candle is a strong bullish hammer candle trading above the level of 55000. Immediate strong resistance is 57500. The price is trading above the 20 EMA. The view is bullish.
(2) Weekly TF:
A strong perfect bullish marubozu is observable. It is a sign of strength and trend reversal (bearish to bullish). Considering the chart pattern of the period (March - June, 2026), the chart pattern is "Adam and Eve double bottom." It is a sign of trend reversal. Immediate resistance is the level of 57500. The price is trading above 9, 20, and 50 EMAs. There is no observable bearish setup. The view is bullish.
(3) Daily TF:
Candle formation trend in the period (01 June - 12 June, 2026) is higher-highs and lower-lows. The bullish trend is strong. Level 55500 seems to be a strong support level. Immediate resistance is 57500. The price is trading above upward-sloping 9, 20, and 50 EMAs. The price is also trading above the 200 EMA, but the 200 EMA is still flat. Since there is no sign of weakness, the view is bullish.
(4) 30-minute TF:
The price structure has formed a higher-highs and lower-lows formation. The strong support zone is (55000 - 56000). Immediate resistance is at 57500. There is no sign of weakness. The price is trading above upward-sloping 9, 20, 50, and 200 EMAs. The view is bullish.
NOTE:
(i) All the analyses would fail in the case of a major gap up, gap down, or price structure anomaly. Thus, practice PRAGMATISM in the live session.
(ii) Trade only if there is a set-up. Remember, not trading is an extension of the trading activity.
(iii) Mark your points. Trade your points. Price is GOD. Anything can happen in the markets. Thus, trade what you see, not what you believe.
(iv) Always PRACTICE RISK MANAGEMENT. Always PROTECT YOUR CAPITAL. Be RESPONSIBLE.
(v) Be Strategic. Be Courageous. Be Patient. Be Wise.
(vi) Every day is a new day. Thus, do not carry the baggage of past successes or failures. Leave the gardens of winning and losing. Establish yourself in equanimity. Always think from a new perspective.
(vii) Let the joy of trading drive your effectiveness, not greed or fear. Believe in Possibilities.
Happy Trading! SENSEX Price Structure Analysis [For 15.06.2026: Monday]Probable Price Structure Analysis of BSE:SENSEX for the 15th of June, 2026. The day is Monday.
(1) Bullish Scenario:
The price is in a bullish zone. If the price stays above the level of 75000, then stay long. Even if there is a gap down or an intraday bearish move, stay long. Try to find only bullish setups. If the price stays above the level of 75000, then the probable bullish targets would be - 75250, 75500, 75750, and 76000. There will be strong resistance at the level of 76000. Next, if the price breaks out above the level of 76000, then the next probable bullish targets would be - 76250, 76500, 76750, and 77000. Again, there will be strong resistance at the level of 77000.
(2) Bearish Scenario:
There is no bearish setup observable in the charts. Level 74500 is strong support. If price breaks down below the level of 74500, then stay bearish. The probable bearish targets below the level of 74500 are - 74250 and 74000. Then level 74000 would offer good support. Next, if the price breaks down below the level of 74000, then the probable bearish targets would be - 73750 and 73500.
(3) No Trading Zone (NTZ): (75000 - 74500).
(4) Event:
There are no high-impact events or holidays in the week.
(6) Establish intraday bias with respect to the opening price. If the price sustains above the opening price, then don't think of shorting. Look for bullish trades only. On the contrary, if the price sustains below the opening price, then don't think of going long. Look for bearish trades in that case.
NOTE:
(i) All the analyses would fail in the case of a major gap up, gap down, or price structure anomaly. Thus, practice PRAGMATISM in the live session.
(ii) Trade only if there is a set-up. Remember, not trading is an extension of the trading activity.
(iii) Mark your points. Trade your points. Price is GOD. Anything can happen in the markets. Thus, trade what you see, not what you believe.
(iv) Always PRACTICE RISK MANAGEMENT. Always PROTECT YOUR CAPITAL. Be RESPONSIBLE.
(v) Be Strategic. Be Courageous. Be Patient. Be Wise.
(vi) Every day is a new day. Thus, do not carry the baggage of past successes or failures. Leave the gardens of winning and losing. Establish yourself in equanimity. Always think from a new perspective.
(vii) Let the joy of trading drive your effectiveness, not greed or fear. Believe in Possibilities.
Happy Trading! Education