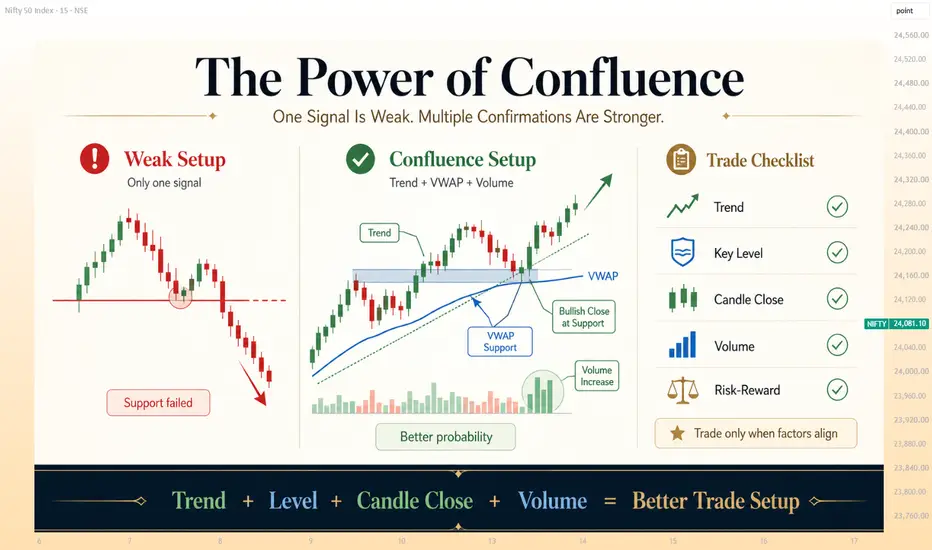
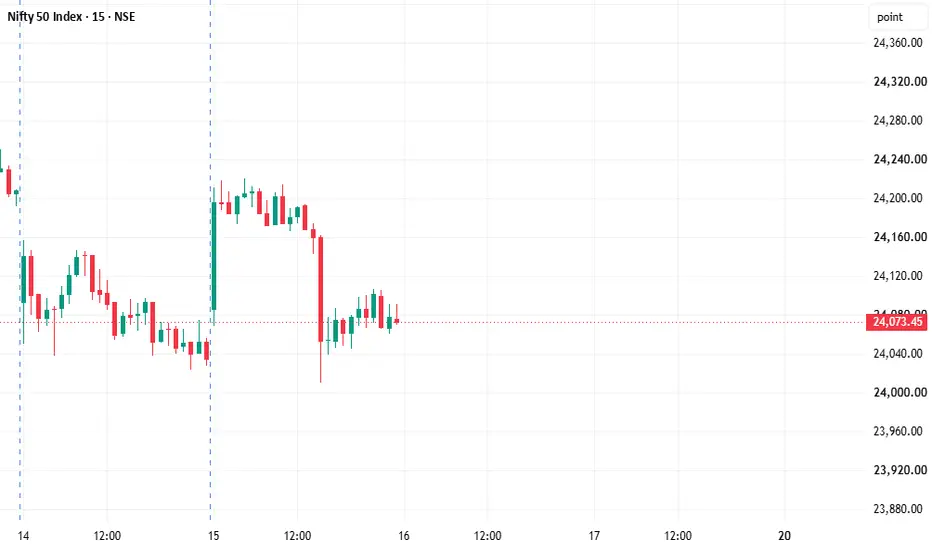
NIFTY 50 | Compression Before Expansion? | 15-Minute Trade PlanNIFTY continues to trade inside a tight consolidation range, forming a sequence of lower highs while repeatedly defending the 24,000–24,050 support zone. This type of price compression often precedes a sharp directional move, making the next breakout critical.
The broader market remains supported by domestic liquidity, but global sentiment is still driven by U.S. rate expectations, FII flows, earnings season, and geopolitical developments. A decisive move beyond the current range is likely to determine the next intraday trend.
Key Levels
🟢 Bullish Trigger: Sustained breakout above 24,082
🎯 Upside Targets: 24,199 → 24,250 → 24,293
🔴 Bearish Trigger: Sustained breakdown below 24,100
🎯 Downside Targets: 24,008 → 23,953 → 24,904
Chart Highlights
✔ Lower Highs indicate weakening buying momentum.
✔ Strong support around 24,000–24,050 remains intact.
✔ Range-bound structure suggests volatility expansion is approaching.
✔ Wait for confirmation—avoid trading inside the range.
"The market is building energy, not direction. Let price confirm the breakout before committing capital." NIFTY : 8-Day Consolidation within one candle range ??
NIFTY Daily Analysis: 13-Day Consolidation Suggests a High-Probability Breakdown Setup
The market has now spent nearly 13 trading sessions consolidating within the range of a single large bearish candle. This is one of the strongest signs that buyers and sellers are locked in a battle, with neither side able to establish dominance.
When a market repeatedly fails to break above the high or below the low of one impulsive candle for several weeks, it usually indicates that institutions are accumulating or distributing positions before the next directional move.
What the chart is telling us
The entire price action after the sharp sell-off has remained trapped inside the range of one dominant bearish candle.
Every rally has been rejected before reaching higher resistance.
Every dip has found buyers near support, creating a compression pattern.
Volatility has contracted significantly, suggesting that a larger expansion phase could be approaching.
Markets generally do not remain inside such a narrow range forever. The longer the consolidation, the stronger the eventual breakout or breakdown tends to be.
Key Resistance 24,533
This is the immediate resistance zone where sellers have repeatedly defended price.
A sustained move above this level would invalidate the current bearish expectation and could trigger fresh buying momentum.
Key Breakdown Level 23,910 (Daily Closing Basis)
This is the most important level on the chart.
I am not interested in intraday breaks or temporary spikes below support.
The bearish setup activates only if NIFTY gives a daily close below 23,910.
A confirmed daily close below this level would indicate that sellers have finally absorbed demand and the consolidation has resolved to the downside.
Potential Target
If the breakdown confirms, Target: 23,080
This represents approximately a 3% downside move, offering close to a 1:1 risk-reward based on the current structure.
The projected decline also aligns well with the measured move of a possible AB = CD harmonic completion, adding further confluence to the bearish scenario.
Why I Prefer Waiting for Confirmation
One of the biggest mistakes traders make is anticipating a breakout before the market confirms it.
Inside prolonged consolidations, false breakouts are common.
Instead of predicting the move, I prefer reacting only after the market confirms direction with a daily closing breakdown.
Patience often provides cleaner entries and better probability trades.
Trading Plan
Bullish Scenario
Daily close above 24,533 (sellers stop loss level)
Bearish view becomes invalid.
Buyers regain control.
Bearish Scenario (Preferred)
Daily close below 23,910 Look for short opportunities.
Downside target around 23,080.
Until one of these levels breaks, NIFTY remains in a neutral consolidation phase.
Final Thoughts
This is not a prediction but a probability-based trading setup.
The market has spent almost three weeks respecting the range of a single candle, which often precedes a significant directional move.
The key is to stay patient, let price confirm the breakout or breakdown, and trade only after confirmation rather than trying to guess the next move.
Levels to Watch
🔴 Resistance: 24,533
🔵 Breakdown Trigger: 23,910 (Daily Close)
🟢 Downside Target: 23,080
 Short
Short
NIFTY50 - Breakout Could Trigger the Next Rally upto 24400+Nifty is currently consolidating inside a rising support and falling resistance structure, indicating that the index is gradually building momentum for a potential breakout. Over the past few sessions, buyers have consistently defended the rising support trendline, while sellers have repeatedly rejected prices near the descending resistance. This tightening price action suggests that a decisive move may be approaching.
The chart also highlights multiple failed attempts by bears to push the index below support. Each pullback has resulted in a higher low, reflecting improving buying interest. As price compresses closer to the resistance trendline, the probability of a breakout increases if bullish momentum continues.
Bullish Outlook
A sustained move above the 24,160–24,200 resistance zone would confirm the breakout and could trigger a sharp upside rally. Based on the height of the current consolidation pattern, the projected move points toward 24,250 as the first target, followed by 24,400+ if buying momentum remains strong.
Technical Highlights
✅ Rising support continues to hold, indicating strong buyer participation.
✅ Multiple higher lows suggest accumulation rather than distribution.
✅ Price is compressing below resistance, often a precursor to an impulsive move.
✅ Pattern projection indicates a strong upside expansion after breakout confirmation.
Key Levels
Immediate Resistance: 24,160–24,200
Target 1: 24,250+
Target 2: 24,400+
Support Zone: 24,020–24,050
Nifty is approaching a crucial breakout zone. If bulls manage to push the index above the descending resistance with strong volume, the current consolidation could transform into a strong bullish impulse, opening the path toward 24,250 and eventually 24,400+ in the coming sessions. Long 
Stop Counting Rupees, Start Counting PercentagesOverview
Here's a mistake almost every new trader makes: they look at their profit and think only in rupee terms. "I made ₹500 today" or "I only made ₹1,000." But this way of thinking hides the real picture. Today, let's talk about why professional traders think differently — in percentages, not just rupees. We'll also touch on a related trap that catches a lot of beginners: option buying and the "hero zero" mindset.
The Problem With "Just ₹2,000"
Say you sell one hedged lot, and the capital required to hold that position is around ₹50,000. If you make a profit of ₹2,000, it's easy to say "that's just ₹2,000, nothing big." But look again — ₹2,000 on ₹50,000 capital is actually a 4% return. That's not small at all.
This is the core idea: the rupee number means nothing on its own. What matters is how much capital you used to make that money.
Let's Do the Math Together
Say you manage to make that same 4% return over 20 trading sessions in a month. That's:
• ₹2,000 per session × 20 sessions = ₹40,000
• On ₹50,000 capital, that's an 80% monthly return
Now, even if your returns are smaller — say just 2% per session — here's what happens:
• 2% of ₹50,000 = ₹1,000 per session
• ₹1,000 × 20 sessions = ₹20,000
• That's a 40% monthly return
(Note: this is before brokerage, taxes, and other trading costs, which will reduce the final number — but the concept still holds.)
Why This Shift in Thinking Matters
If you only look at the rupee amount, ₹500 or ₹1,000 a day can feel disappointing, especially when you compare it to a friend who made ₹5,000 in one trade. But that comparison is meaningless unless you know how much capital each person used.
Someone making ₹5,000 on ₹5,00,000 capital made 1%. Someone making ₹1,000 on ₹50,000 capital made 2%. The second trader actually performed better — even though the rupee number looks smaller.
The Other Trap: Option Buying and "Hero Zero"
It's worth remembering why options exist in the first place. They were introduced mainly as a hedging tool — a way for investors and institutions to protect their existing positions from unexpected price moves. That's the real purpose.
But somewhere along the way, many retail traders started treating options like a fast-track money-building machine instead — a way to turn small amounts into large profits quickly, rather than a tool to manage risk. This shift in purpose is a big part of why so many beginners end up in trouble.
Here's a pattern we see a lot with new traders. Someone enters the market, puts in ₹10,000, and buys one lot of options. If luck is on their side, they might see that ₹10,000 turn into ₹11,000 or ₹12,000 within minutes. Sometimes, on a lucky "hero zero" day, that money even doubles in a single session.
This feels incredible the first time it happens. But here's the problem — that one big win creates a dangerous belief: "this is easy, I can do this again." That belief leads to bigger and bigger bets, often without any real strategy behind them. Eventually, the same speed at which the money came in is the same speed at which it goes out — and often, all of it, in a single bad trade.
This isn't just a theory. SEBI's own study (Press Release No. 22/2024) found that 93% of individual F&O traders lost money between FY22 and FY24, with total losses crossing ₹1.81 lakh crore over that period. Only about 7% of individual traders were profitable. This is one of the clearest, most official confirmations that using options as a speculative shortcut, rather than the hedging tool they were designed to be, overwhelmingly does not work out for most people.
How to Start Thinking in Percentages
Here's a simple habit to build:
1. Know your capital. Always be clear on how much capital a trade actually requires — margin, hedge cost, whatever it is.
2. Calculate your return as a percentage, not just in rupees. Profit ÷ Capital used × 100.
3. Track this daily or per trade, and look at your average return over time — not just one big win or one bad day.
4. Multiply it out over a month to see the real picture of what consistent small returns can add up to.
A Common Beginner Mistake
New traders often chase the "big win" — a single trade that makes a large rupee amount — while ignoring small, consistent returns that compound over time. Worse, some let one lucky win convince them that gambling-style bets are a strategy. In reality, a trader making a steady 2-4% return per session, session after session, will almost always build wealth more safely than someone chasing one large, risky trade.
Beginner's Lesson
Professional traders don't get excited or upset over a single day's rupee number, and they don't chase the thrill of a lucky double either. They think in three things: percentage return, consistency, and risk management. These three, together, are what actually compound wealth over the long run — not any single big trade, and definitely not a gamble.
Conclusion
Next time you look at your profit for the day, don't just ask "how much did I make?" Ask "what percentage return was that on my capital?" And if you ever feel the pull of a "one big trade" mindset, remember what SEBI's own data shows: the vast majority of option buyers lose money over time. Consistency beats gambling, every single time.
For educational purposes only. Not financial advice. Trading involves risk — always manage your capital and risk carefully. Data referenced from SEBI Press Release No. 22/2024.
 Education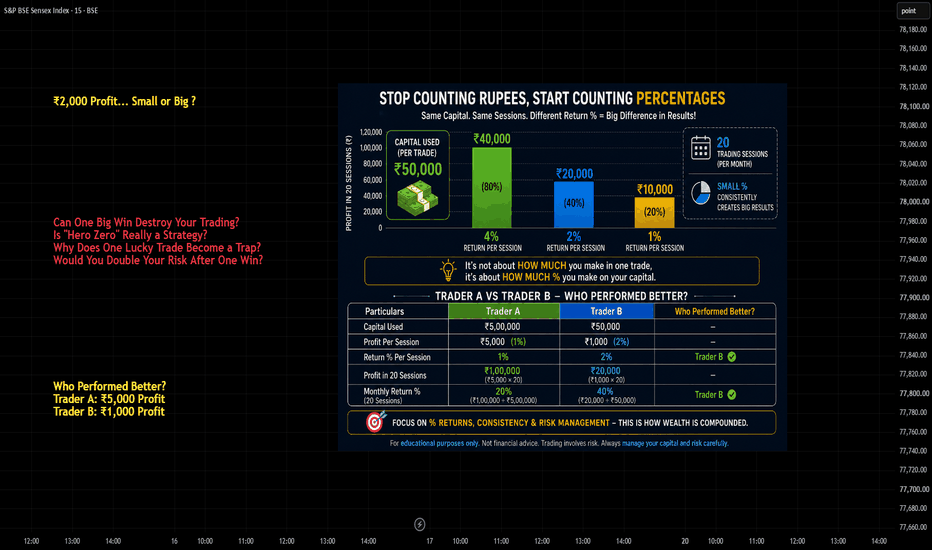
NIFTY – INTRADAY TRADING PLAN | 17-Jul-2026Reference Close: 24,081.10 | O: 24,071.15 | H: 24,090.15 | L: 24,050.00
Namaste Traders! 🙏 Below is a structured, educational trading plan built around key support/resistance zones for tomorrow's session. This plan covers all three opening scenarios — Gap Up, Flat, and Gap Down — considering a gap threshold of 100+ points. Please read the chart legend carefully before proceeding. ⬇️
🗺️ Chart Legend (Important!)
• 🟠 Orange Line/Zone (No Trade Zone) — Sideways/consolidation area. Avoid fresh positions here; market is undecided.
• 🟢 Green Line — Bullish structure / Long bias confirmed once broken with strength.
• 🔴 Red Line — Bearish structure / Short bias confirmed once broken with weakness.
• ➖ Dashed Lines (Green/Red) — "Maybe" zones — trend may or may not continue here. Treat as extended targets, not guaranteed moves. Trail SL and book partial profits.
🔑 Key Levels for 15-Jul-2026
• 🟠 No Trade Zone: 24,032 – 24,098
• 🟢 Last Intraday Resistance: 24,288 – 24,327
• 🔴 Last Intraday Support: 23,901 – 23,937
• 🟢 Major Extended Resistance: 24,509
• 🟢 Buyer's Support (Consolidation Zone): 23,681 – 23,747
🟢 SCENARIO 1: GAP UP OPENING (100+ points, i.e., open above ~24,181)
📘 Explanation: A gap up of 100+ points means the market opens well above the No Trade Zone (24,032–24,098), directly approaching or crossing the Last Intraday Resistance zone (24,288–24,327). This shows strong overnight bullish sentiment (positive global cues/news).
📌 Plan of Action:
• If Nifty opens above 24,181 and sustains above 24,288–24,327 on 15-min candle close basis → Bullish continuation confirmed (green zone breakout).
• 🎯 Enter long only on a retest & hold of 24,288–24,327 as support, not on first impulsive candle — avoid chasing.
• Target 1: 24,400 | Target 2: 24,509 (Major Resistance — dashed green zone, trend "may" extend further, trail SL here).
• Stop Loss: Below 24,288 (zone breakdown invalidates bullish setup).
• ⚠️ If price gaps up but immediately slips back into the No Trade Zone (24,032–24,098), treat it as a gap-fill trap — stay out until a clear direction emerges.
• For Options: Prefer Bull Call Spread or slightly OTM Calls with a defined SL; avoid deep ITM naked buying right at open due to high IV crush risk.
📌 📌 📌
🟠 SCENARIO 2: FLAT OPENING (Within ±100 points, inside/near No Trade Zone 24,032–24,098)
📘 Explanation: A flat opening means the gap is less than 100 points and price opens within or very close to the No Trade Zone. This is a battle zone between bulls and bears — low conviction, higher chances of whipsaws (as shown by the orange dashed zig-zag on chart).
📌 Plan of Action:
• 🚫 Avoid trading immediately at open — this is a "No Trade Zone." Let the first 15–30 minutes establish direction.
• If price breaks above 24,098 and sustains → shift bias to bullish, follow Gap Up scenario targets (24,288 → 24,327 → 24,509).
• If price breaks below 24,032 and sustains → shift bias to bearish, follow Gap Down scenario targets (23,937 → 23,901 → 23,747).
• 🎯 Best approach: Wait for a breakout + retest on either side of the No Trade Zone before committing capital.
• For Options: This is the ideal zone for Option Sellers (Iron Condor / Short Straddle with hedge) since range-bound moves favor time decay. Directional traders should sit on hands until breakout confirmation.
📌 📌 📌
🔴 SCENARIO 3: GAP DOWN OPENING (100+ points, i.e., open below ~23,981)
📘 Explanation: A gap down of 100+ points pushes the market below the No Trade Zone straight toward the Last Intraday Support zone (23,901–23,937). This indicates weak sentiment (negative global cues/news) and sellers are in control from the open.
📌 Plan of Action:
• If Nifty opens below 23,981 and sustains below 23,901–23,937 on 15-min candle close basis → Bearish continuation confirmed (red zone breakdown).
• 🎯 Enter short only on a pullback/retest of 23,901–23,937 turning into resistance — don't short blindly at open.
• Target 1: 23,800 | Target 2: 23,681–23,747 (Buyer's Support/Consolidation Zone — dashed red zone, trend "may" extend further, book partial profits and trail SL).
• Stop Loss: Above 23,937 (zone reclaim invalidates bearish setup).
• ⚠️ Watch for a sharp reversal (V-shape recovery) back into the No Trade Zone — if 24,032 is reclaimed intraday, exit shorts immediately.
• For Options: Prefer Bear Put Spread or slightly OTM Puts with strict SL; avoid over-leveraging on gap-down panic as sharp pullback rallies are common.
📌 📌 📌
⚙️ RISK MANAGEMENT TIPS FOR OPTIONS TRADING 🛡️
• 💰 Never risk more than 1–2% of total capital on a single options trade.
• 📉 Always use a hard Stop Loss — options can decay fast; don't rely on mental SL.
• ⏱️ Avoid buying options right at market open during high volatility — let IV settle for 10-15 minutes.
• 🎯 Book partial profits at Target 1, trail SL to cost for the remaining position at Target 2.
• 🚫 Avoid overtrading in the No Trade Zone — capital preservation is a win too.
• 📊 Always align option strikes with liquidity (tight bid-ask spread) to avoid slippage.
• 🧘 Avoid revenge trading after a SL hit — stick to the plan, not emotions.
• 📅 Be mindful of time decay (Theta) — avoid holding weekly options overnight without strong conviction.
📝 SUMMARY & CONCLUSION
Tomorrow's session hinges on how price reacts around the No Trade Zone (24,032–24,098). A Gap Up (100+) opens the door toward 24,288–24,327 and further to 24,509 (bullish path 🟢). A Gap Down (100+) opens the door toward 23,901–23,937 and further to 23,681–23,747 (bearish path 🔴). A Flat opening keeps the market range-bound until a decisive breakout occurs — patience is key here 🟠. Always wait for confirmation candles and respect stop losses. Trade the plan, not your emotions! 🎯
⚠️ Disclaimer: I am not a SEBI registered analyst. This post is for educational purposes only and should not be considered as investment/trading advice. Please consult your financial advisor and do your own research before making any trading/investment decisions. Trading in equities/options/derivatives is subject to market risk. 🙏 Short 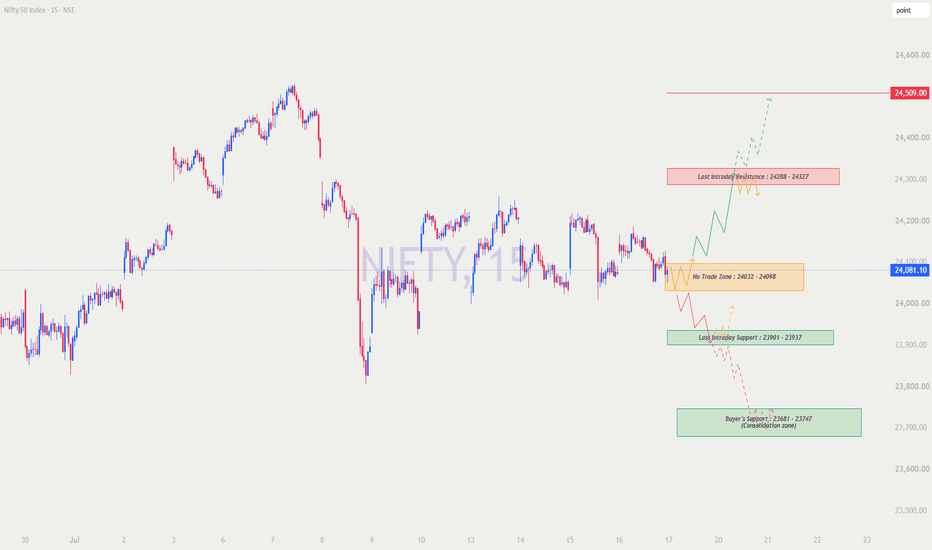
#NIFTY Intraday Support and Resistance Levels - 17/07/2026Nifty is expected to witness a flat opening with no significant change from yesterday's closing levels. The index is trading near the crucial 24050 support zone, making the initial one hour important for confirming the intraday trend. Traders should wait for a decisive breakout or breakdown before taking aggressive positions.
The immediate support is placed around 24050–24100. If Nifty holds above this zone and sustains buying momentum, traders can consider long positions with targets of 24150, 24200, and 24250. A sustained move above 24250 will further strengthen the bullish momentum and may trigger fresh upside buying.
On the downside, if Nifty fails to hold the psychological 24000 level, fresh selling pressure may emerge. Traders can consider short positions only below 24000, with downside targets of 23850, 23800, and 23750. As long as 24000 remains intact, avoid aggressive bearish positions since buyers may continue defending the support zone.
Overall, a flat opening is expected. The broader intraday bias remains positive while Nifty trades above 24050–24000. Traders should focus on buying near support with confirmation, while fresh short positions should only be considered after a confirmed breakdown below 24000. Maintain strict stop-losses and book profits gradually at the mentioned target levels. #BANKNIFTY Intraday PE & CE Levels(17/07/2026)Bank Nifty is expected to witness a flat opening with no major changes from yesterday's closing levels. The index continues to trade near the crucial 57550–57600 support zone, making this level important for today's intraday direction. Traders should avoid aggressive positions at the opening and wait for confirmation before initiating fresh trades.
The immediate support is placed at 57550–57600. If Bank Nifty sustains above this zone and attracts buying interest, traders can consider CE positions with targets of 57750, 57850, and 57950. A decisive breakout above 58050 will confirm stronger bullish momentum and may extend the rally towards 58250, 58350, and 58450.
On the downside, if Bank Nifty slips below 57950–57900 and faces rejection from higher levels, traders can consider PE positions with targets of 57750, 57650, and 57550. A sustained breakdown below 57450 will strengthen the bearish trend and may push the index towards 57250, 57150, and 57050.
Overall, a flat opening with no major changes from yesterday's levels is expected. As long as Bank Nifty holds above the 57550 support zone, buying on dips remains the preferred strategy. Fresh short positions should only be considered after a confirmed breakdown below 57450 or a rejection from the 57950–58000 resistance zone, with strict stop-losses and disciplined profit booking at each target level. Nifty 50 Trade Plan [17.06.2026: Friday]Probable Scenario Analysis and Trade Plan for the Nifty 50 Index NSE:NIFTY for the 17th of July, 2026. The day is Friday.
🟢 Bullish Scenario
There is no bullish setup observable in the present price action. Doubt every upmove. A strong resistance zone (SRZ) is formed at (24250 - 24150). It will be difficult for the price to break out above the SRZ. However, if the price sustains above 24250, then the probable bullish targets would be - 24300, 24350, and 24400.
🔴 Bearish Scenario
Presently, the price is in the bearish zone. However, in the past few days, the price action has formed a strong support zone (SSZ) at (24050 - 23950). An effective bearish trade is only possible if the price decisively breaks down below the SSZ. The probable bearish targets below the level of 23950 would be - 23900, 23850, 23800, and 23750.
🟡 No Trading Zone (NTZ): (24250 - 2950).
⏺ Range of Consolidation (ROC): (24250 - 24000).
Here, 24125 is the median of the ROC. The median works like an intraday sentiment evaluator. The price trading above the median would offer bullish sentiment, while the price trading below the median would trigger bearish sentiment within the ROC.
● Event
No high-impact event this week. No holidays this week. It is the last day of the week. Lastly, geopolitical issues are omnipresent.
● Intraday Bias
Establish intraday bias with respect to the opening price. If the price sustains above the opening price, then don't think of shorting. Look for bullish trades only. On the contrary, if the price sustains below the opening price, then don't think of going long. Look for bearish trades in that case.
● Disclaimer + End Note
- All the analyses would fail in the case of a major gap up, gap down, or price structure anomaly. Thus, practice PRAGMATISM in the live session.
- Trade only if there is a set-up. Remember, not trading is an extension of the trading activity.
- Mark your points. Trade your points. Price is GOD. Anything can happen in the markets. Thus, trade what you see, not what you believe.
- Always PRACTICE RISK MANAGEMENT. Always PROTECT YOUR CAPITAL. Be RESPONSIBLE.
- Be Strategic. Be Courageous. Be Patient. Be Wise.
- Every day is a new day. Thus, do not carry the baggage of past successes or failures. Leave the gardens of winning and losing. Establish yourself in equanimity. Always think from a new perspective.
- Let the joy of trading drive your effectiveness, not greed or fear. Believe in Possibilities.
Happy Trading! NIFTY DAILY / Short Range Level Analysis for 17th Jul 2026🔕 SGMN SplD BULLISH Above => 24153
🔕 SGMN SplD Bearish BELOW => 24011.
Mentioned analysis based on 2 consecutive candle close in 15 min Time Frame.
━━━━━🟥🟧🟨🟩🟦🟪⬛━━━━━
💥Level Interpretation / description:
✍🏻L#1: If the candle crossed & stays above the “Buy Gen”, it is treated / considered as Bullish bias. Cfm=> Confirmation.
L#2: Possibility / Probability of REVERSAL near 🔕RL/TF1 & 🔔RL/TF2
L#3: If the candle stays above “Sell Gen” but below “Buy Gen”, it is treated / considered as Sidewise. Aggressive Traders can take Long position near “Sell Gen” either retesting or crossed from Below & vice-versa i.e. can take Short position near “Buy Gen” either retesting or crossed downward from Above.
L#4: If the candle crossed & stays below the “Sell Gen”, it is treated / considered a Bearish bias.
L#5: Possibility / Probability of REVERSAL near 🔕RL/TF1 & 🔔RL/TF2
HZB (Buy side) & HZS (Sell side) => Hurdle Zone,
✍🏻 *** Specialty of “HZB#1, HZB#2 HZS#1 & HZS#2” is Sidewise (behaviour in Nature)
Rest Plotted and Mentioned on Chart
Color code Used:
Green, BLUE =. Positive bias.
Safron, RED =. Negative bias.
RED in Between Green means Trend Finder / Momentum Change
/ CYCLE Change and Vice Versa.
Notice One thing: HOW LEVELS are Working.
Use any Momentum Indicator / Oscillator or as you "USED to" to Take entry.
━━━━━🟥🟧🟨🟩🟦🟪⬛━━━━━
⚠️ DISCLAIMER:
The information, views, and ideas shared here are purely for educational and informational purposes only. They are not intended as investment advice or a recommendation to buy, sell, or hold any financial instruments. I am not a SEBI-registered financial adviser.
Trading and investing in the stock market involves risk, and you should do your own research and analysis. You are solely responsible for any decisions made based on this research.
"🔔As HARD EARNED MONEY IS YOUR's, So DECISION SHOULD HAVE TO BE YOUR's".
━━━━━🟥🟧🟨🟩🟦🟪⬛━━━━━
❇️ Follow notification about periodical View
💥 Do Comment for Stock WEEKLY Level Analysis.🚀
📊 Do you agree with this view?
✈️ HIT THE PLANE ICON if this technical observation resonates with you. It will Motivate me.
━━━━━🟥🟧🟨🟩🟦🟪⬛━━━━━
💡 If You LOOKING any CHART & want for Level and ANALYZE?
Share your desired stock names in the comments below! I will try to analyze the chart Levels, patterns and share my technical view (so far my Knowledge).
If Viewers think It can identify meaningful setups. Looking forward to hearing from all of you — let's keep this discussion going and help each other make better trading decisions.
___________🔕^^^⚫⚪^🙏🏼🙏🏼🙏🏼^⚪⚫^^^🔔___________ IFTY DAILY / Short Range Level Analysis for 17th Jul 2026 Education 
SENSEX | Weekly Expiry | 15 Min Chart AnalysisThe BSE SENSEX 15m chart indicates a cautious outlook, with price action suggesting a potential downtrend in the short term. The market is currently closed, so these observations are based on the last completed session (2026-07-15).
🟣 Bottom line
Cautious bias: Sensex is in a short-term downtrend, trading below key moving averages with neutral-negative momentum.
🟣 Structure & trend
* The price is currently below both the 15m SMA20 (76,833.7) and SMA50 (77,175.8), indicating a bearish short-term trend.
* Price action shows a pattern of lower highs and lower lows, confirming a downtrend structure on this timeframe.
* RSI14 is at 43.8, which is in the neutral-negative zone, supporting the cautious view.
🟣 Key levels
* Nearest support is observed around 76,787.9, followed by 76,623.4.
* Nearest resistance is at 76,976.4, with the next level at 77,190.4.
The recent 15m window range has been between 76,082.5 and 77,803.2.
🟣 What to watch
* A sustained move and close above the nearest resistance of 76,976.4 would be required to challenge the current downtrend structure.
* Conversely, a break and hold below the 76,787.9 support level could open further downside towards 76,623.4.
* Monitoring volume on any breakout or breakdown from these levels will be crucial for confirmation.
Disclaimer
This analysis is shared strictly for educational and informational purposes. It is not financial or investment advice. Always perform your own research, use proper risk management, and trade according to your own strategy.
🔔 Subscribe for daily market insights, swing trade setups, and institutional-style technical analysis.
❤️ Market Wisdom to Remember: ❤️
⭐ Trade what you see, not what you assume
⭐ Follow the trend — it's your only true friend
⭐ The chart tells the real story — trust it
⭐ Emotions & assumptions have no place in trading
⭐ Capital protection comes first — always
💡 Your support matters! Like, comment, and follow to stay updated and motivated.
Cheers & Trade Smart! 🚀

Education