NHCFOODS: Consolidating at Macro Support Aft Volatile CorrectionOverview :
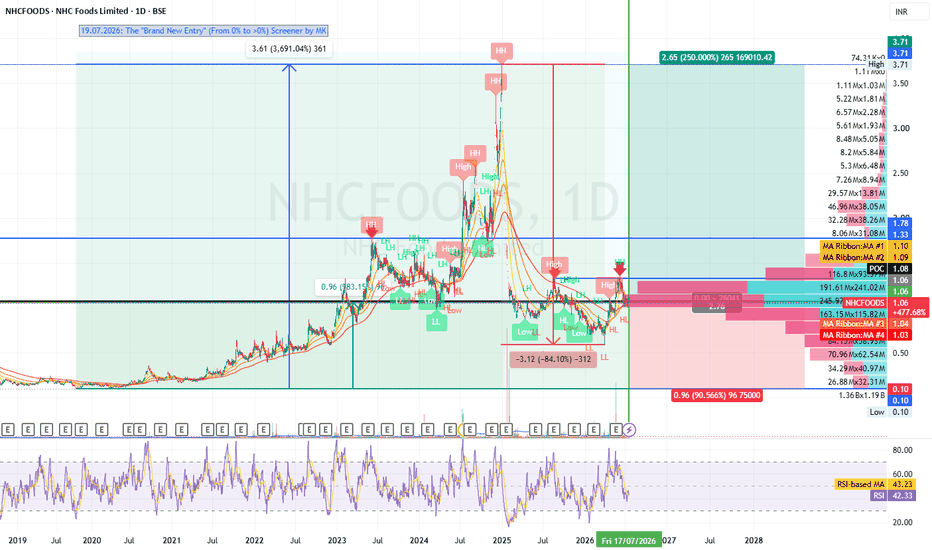
NHC Foods Limited (BSE: 517554) is currently navigating a period of consolidation on the daily (1D) timeframe. After peaking at a 52-week high of ₹1.35, the stock has experienced significant volatility and corrective pressure, now trading near the ₹1.06 level. The company, a nano-cap entity in the FMCG sector, has recently seen a notable expansion in its equity base following FCCB conversions, which continues to influence market sentiment.
Trend Direction (Moving Averages) :
MA Ribbon/EMA Analysis : The stock is currently trading in a tight range relative to its short-term moving averages. With the 5-day, 10-day, 20-day, and 50-day SMAs all clustered near the ₹1.10 level, the price is currently suppressed by this overhead resistance. However, it maintains a position slightly above its 200-day SMA (approx. ₹1.00), suggesting that the long-term bullish trend remains precariously intact.
Momentum Indicators :
RSI (Relative Strength Index) : The RSI(14) is currently in the 42–44 range. This indicates a neutral to slightly bearish momentum. It is neither overbought nor oversold, suggesting a lack of decisive trend-driving volume.
MACD : The MACD line remains below its signal line and the zero line, which is traditionally viewed as a bearish signal, reflecting the lack of upward momentum seen over the past month.
Fibonacci : The stock is testing levels that align with recent structural support. A breakdown below the ₹1.00 psychological floor would likely signal a retest of the 52-week low near ₹0.59.
Key Levels to Watch :
Resistance : The immediate hurdle is the ₹1.10–₹1.11 zone (the cluster of short-term moving averages and the recent high). A volume-backed breakout above ₹1.15 is required to shift the bias to bullish.
Support : The primary support zone sits at ₹1.00–₹1.05. If the price fails to hold the ₹1.00 level, the stock may enter a deeper retracement phase.
Directional Bias: NEUTRAL / CAUTIOUS
The stock is in a "wait-and-see" phase. Until NHCFOODS can decisively clear the ₹1.11 resistance with significant trading volume, the risk of sideways consolidation or a drift toward support remains higher than the probability of an impulsive breakout.
Disclaimer : This analysis is for educational purposes only and does not constitute financial advice. Nano-cap stocks like NHC Foods carry high volatility and liquidity risks; please manage your position sizing accordingly.
New India AssuranceModerately Bullish (Medium Term (7.5/10)
Latest Positives
* The company remains the **largest general insurer in India**, with improving market share and strong investment assets under management.
* Valuation is still relatively attractive compared to private peers, trading at a lower P/E than companies like ICICI Lombard, Star Health and Go Digit.
* The insurance sector continues to benefit from increasing insurance penetration and improving premium growth, supporting long-term prospects.
Best Entry
* Ideal accumulation: ₹168-175
* Aggressive buy: Around current levels if the stock holds ₹170 on a weekly closing basis.
* Add more only after a breakout above ₹190 with strong volume.
Stop Loss
* Positional: ₹158
* Conservative: Weekly close below ₹165
Targets
* Target 1: ₹190
* Target 2: ₹215
* Target 3 (6-12 months): ₹240-250
Among listed general insurers, NIACL currently stands out as one of the better value plays, though private insurers continue to command higher valuations because of stronger profitability metrics.
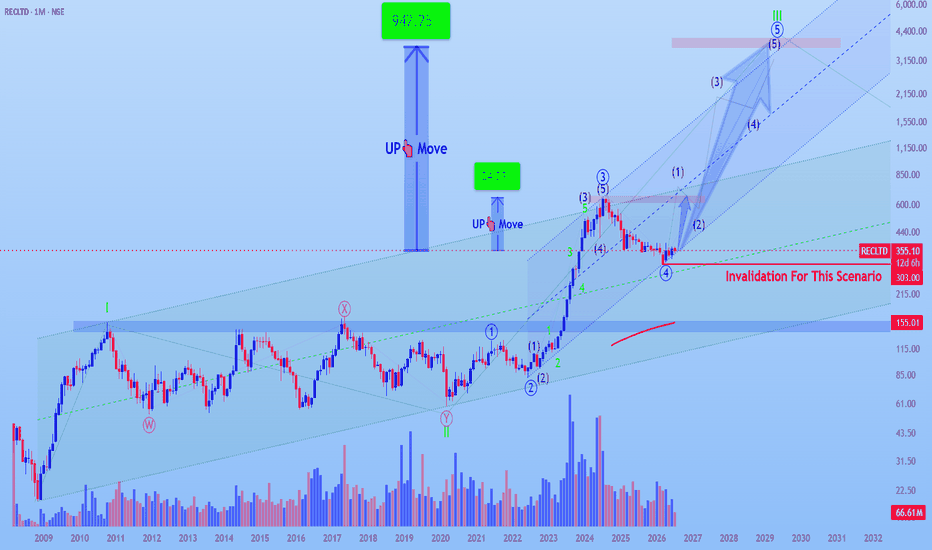
RECLTD: A Possible Elliott Wave Roadmap for Wave ⑤With Wave ④ appearing complete, RECLTD may be at the beginning of Wave ⑤ of the larger Wave III.
The chart presents one possible Elliott Wave roadmap for how Wave ⑤ could unfold.
=> Proposed Structure
(1): Initial impulsive advance with a projected move of approximately 84.23%.
(2): Corrective pullback.
(3): If the Elliott Wave structure develops as expected, this wave could become the strongest and longest segment.
(4): Consolidation.
(5): Final push to complete Wave ⑤, which would also complete the larger Wave III, with a projected advance of approximately 942.25%.
📊 Technical Structure
✅ Long-term ascending channel remains intact.
✅ The projected roadmap anticipates the development of Wave (1), (2), (3), (4), and (5) to complete ⑤, which in turn completes Wave III.
These projections are illustrative, not guaranteed price targets, and are meant to visualize one potential path if the bullish Elliott Wave count continues to unfold.
❌ Invalidation
The current Elliott Wave count remains valid as long as price holds above ₹303.00.
A decisive break below this level would invalidate this bullish scenario.
*******************************************************************************************
Warning ⚠
This analysis is shared for educational purposes and reflects one possible Elliott Wave interpretation. It is not financial advice.
*******************************************************************************************
#RECLTD #ElliottWave #Wave3 #ImpulseWave #TechnicalAnalysis #WaveAnalysis #TradingView #PriceAction #StockMarket #SwingTrading #PositionalTrading #MarketStructure #NSE #NikhilKanal #ElliottWave #LeadingDiagonal #Zigzag #DoubleZigzag #TripleZigzag #CorrectiveWaves #WaveAnalysis #TechnicalAnalysis #TradingEducation #PriceAction #TradingView #MarketStructure #StockMarket #NikhilKanal #ElliottWave #TradingEducation #MotiveWave #ImpulseWave #LeadingDiagonal #EndingDiagonal #WaveAnalysis #TechnicalAnalysis #PriceAction #TradingView #StockMarket #MarketStructure #TradingPsychology #NikhilKanal #ElliottWave #TradingEducation #LeadingDiagonal #EndingDiagonal #Triangle #WaveAnalysis #TechnicalAnalysis #PriceAction #TradingView #MarketStructure #NikhilKanal #ElliottWave
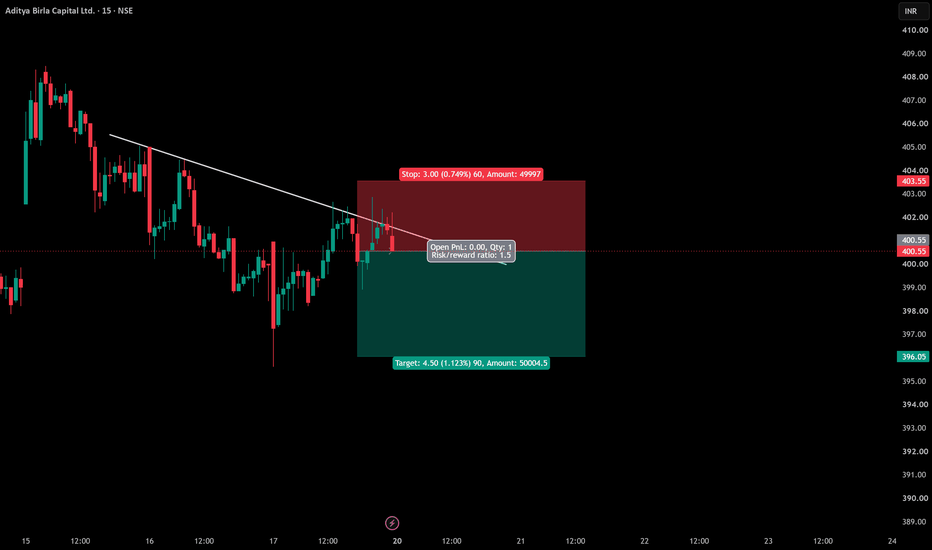
BUY TODAY SELL TOMORROW for 5%DON’T HAVE TIME TO MANAGE YOUR TRADES?
- Take BTST trades at 3:25 pm every day
- Try to exit by taking 4-7% profit of each trade
- SL can also be maintained as closing below the low of the breakout candle
Now, why do I prefer BTST over swing trades? The primary reason is that I have observed that 90% of the stocks give most of the movement in just 1-2 days and the rest of the time they either consolidate or fall
Trendline breakout in ECLERX
BUY TODAY SELL TOMORROW for 5%
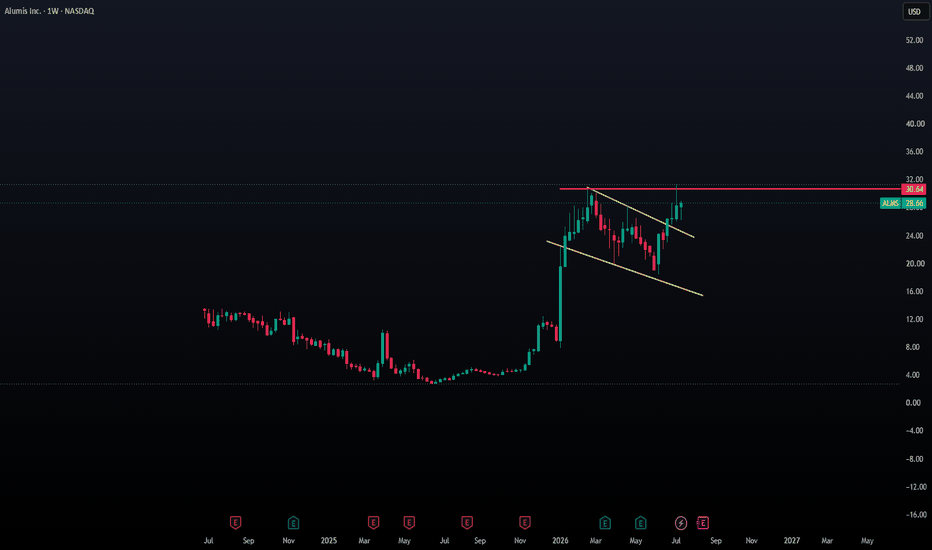
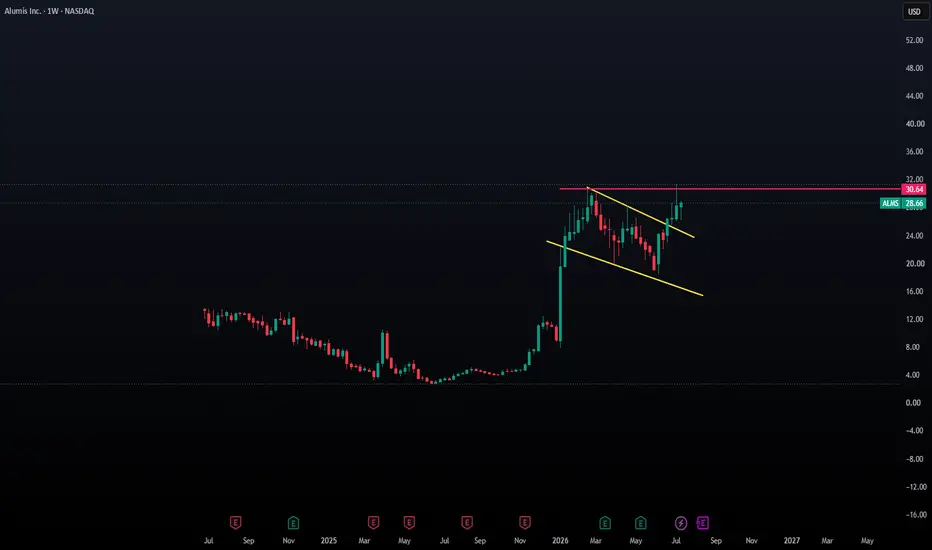
ALMS — Weekly bull flag (pole-and-flag) breakoutALMS shot up from about 13 to 28 (the pole), then drifted sideways-down in a small channel (the flag). Price has now pushed above that flag and is testing its all-time high near 30.64. This is a classic flag breakout — often a sign the uptrend continues.
Plan — buy in two parts:
Buy 1 (50%): now, around 28.65
Buy 2 (other 50%): only after a weekly close above the all-time high, around 30.65
Stop loss: below 25.60 (if it drops back into the flag, I'm out)
Why two parts: the first buy gets me in on the breakout. The second buy waits for the all-time high to actually break on a weekly close, so you don't get faked out at resistance.
Get out of trade if it closes back below 25.60 on the weekly.
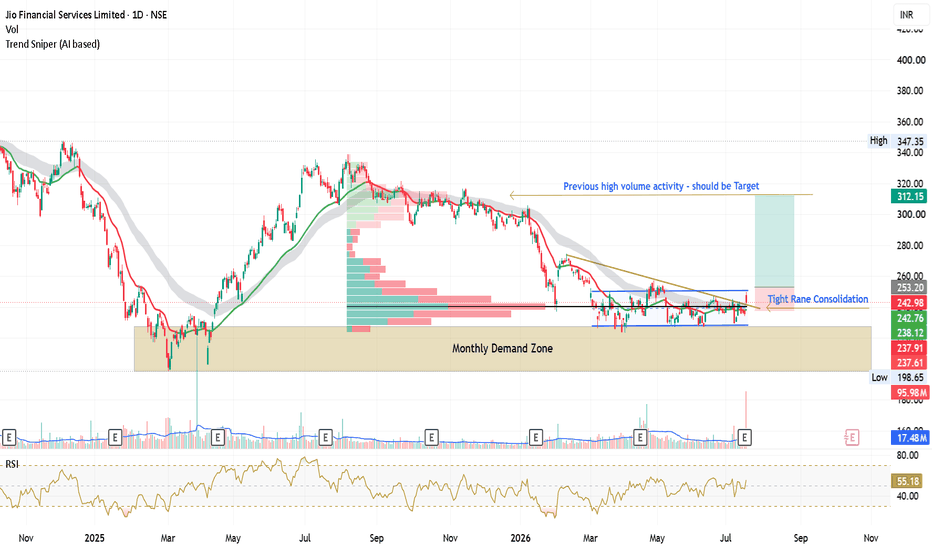
JIOFIN: Tight Consolidation Near Monthly DemandNSE:JIOFIN
Jio Financial Services has been consolidating for several months after a healthy correction from its previous swing high. Rather than showing aggressive distribution, the decline has been accompanied by relatively lower selling pressure, suggesting a phase of absorption near an important higher-timeframe demand zone.
Price is currently trading inside a well-defined consolidation while respecting the Monthly Demand Zone, with a descending trendline acting as dynamic resistance. Such prolonged contraction often precedes a significant expansion in volatility, making this an interesting chart to monitor.
Key observations:
• Price continues to hold the Monthly Demand Zone.
• Multiple tests of support indicate buyers are actively defending lower levels.
• A tight consolidation has developed after an extended correction.
• The descending trendline remains the primary resistance to overcome.
• RSI has recovered above the neutral zone, reflecting improving momentum.
• Previous high-volume activity around ₹310–315 may become a potential magnet if a confirmed breakout develops.
What to watch:
✓ A convincing daily close above the consolidation range with increased volume would indicate improving bullish strength.
✓ Failure to sustain above resistance could extend the current range-bound structure or lead to another test of the higher-timeframe demand zone.
This analysis is intended to demonstrate how higher-timeframe demand, volume behavior, trendlines and consolidation structures can be combined to build a logical trading framework. Always wait for price confirmation instead of anticipating breakouts.
This publication is for educational purposes only and should not be considered investment or trading advice. Please conduct your own research and manage risk appropriately.
ZF Commercial Vehicle cmp 2410.30 Weekly ChartZF Commercial Vehicle cmp 2410.30 Weekly Chart
- Support Zone 2100 to 2375 Price Band
- Stable Resistance Zone 2500 to 2800 Price Band
- Symmetrical Triangle Pattern seen in formation mode
- Price seen shouldering on the Rising Support Trendline
- Volumes spiking heavily by decent sync of avg traded qty
- Breakout attempted from both Resistance Zone and the Trendline
- Cup & Handle plus Rounding Bottoms and/or very considerate VCP
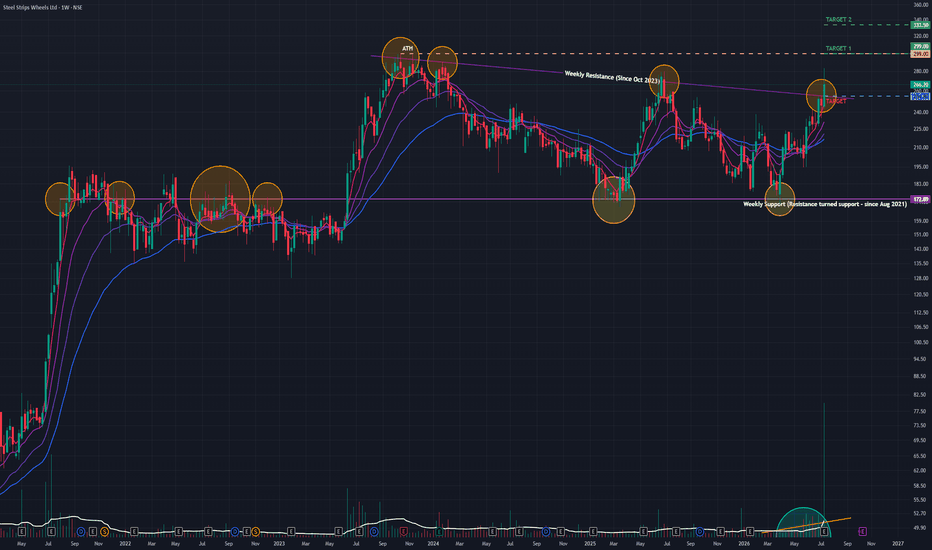
SSWL (W): Aggressive Bullish (Earnings-Ignited Structural BO)Timeframe: Weekly | Scale: Logarithmic
Steel Strips Wheels has shattered a multi-month angular resistance on the back of massive climax volume. The alignment of all major momentum indicators across multiple timeframes suggests the stock has entered a powerful markup phase.
🚀 1. The Fundamental Catalyst (The "Why")
The technical breakout was explicitly triggered by institutional accumulation following the Q1 FY27 results and investor presentation on July 15. The underlying operational stability and steady demand in the automotive wheel segment provided the necessary "rocket fuel" for smart money to break the stock out of its long-term consolidation.
📈 2. The Chart Structure (The Resistance Breakout)
> The Angular Breakout: The stock definitively cleared the descending trendline that had been suppressing the price since October 2023. Closing the week with a strong, full-bodied bullish candle indicates that buyers maintained control through to the Friday close.
> The Re-test Zone: Major breakouts often feature a "throwback." The breakout point at the ₹254 level is now the critical battleground for bulls to defend.
📊 3. Volume & Indicators
> Volume Ignition: The 27.25 Million weekly volume is a definitive "Institutional Stamp." It proves that the breakout is not a retail-driven false move but a sustained rotation of capital.
Momentum Harmonization:
> EMAs: The Positive Crossover (PCO) of short-term EMAs across the Daily, Weekly, and Monthly timeframes confirms that the short, medium, and macro trends are perfectly aligned.
> Oscillators: Rising MACD and RSI across all three timeframes confirm that upward momentum is expanding and has not yet hit exhaustion.
🎯 4. Future Scenarios & Key Levels
The stock is now navigating toward historical supply zones.
🐂 Bullish Targets (The Markup):
- Target 1: ₹299. With the current momentum, this is a highly probable near-term target as the stock seeks out its next major liquidity pool.
- Target 2: ₹335.
🛡️ Support (The "Must Hold"):
- Immediate Support: ₹254. The Polarity Principle dictates that this former angular resistance must now act as a rock-solid floor.
- Invalidation: A weekly close back below ₹240 would severely damage the chart structure and suggest a "Bull Trap."
Conclusion
This is a Grade-A Breakout Setup that beautifully combines price action, volume, and momentum.
Strategy: Watch out for the stock's movement next week is the perfect approach. Chasing the stock immediately after an 8% surge carries minor pullback risk.
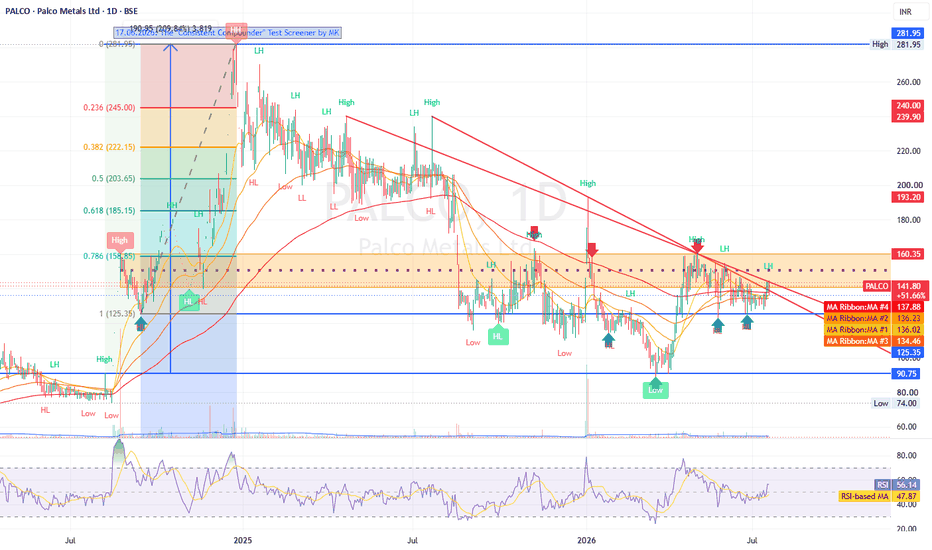
$PALCO: Consolidation-within-a-downtredOverview :
Palco Metals (PALCO) is currently exhibiting a "consolidation-within-a-downtrend" phase on the daily (1D) timeframe. After peaking at ₹239.90, the stock has undergone a significant correction. The price is currently trading near ₹141.80, struggling to break out of a long-term descending trendline that has dictated its primary bearish structure.
Trend Direction (Moving Averages):
20/50/200 EMA Ribbon : The stock is currently trading in a congested zone relative to its moving averages. While it has recently flirted with the 200-day SMA/EMA levels (approx. ₹130–₹138), the alignment of short-term moving averages suggests a lack of sustained bullish momentum. The price needs a decisive close above the 50-day EMA to shift the immediate bias to "Bullish."
Momentum Indicators:
RSI (Relative Strength Index) : The RSI is currently hovering around the 56.14 level. This is a neutral-to-slightly-bullish territory, indicating that the selling pressure has eased, but buyers lack the conviction to drive a sharp impulsive move.
MACD : The MACD is showing signs of potential convergence, but without a strong bullish crossover, the indicator remains cautious.
Support & Resistance :
Resistance : The primary hurdle is the descending trendline and the supply zone near ₹160. A breakthrough here is critical to invalidate the multi-month bearish structure.
Support : Immediate support sits at the ₹125 - ₹130 zone, which aligns with recent structural lows and the 200-day moving average. A breakdown below this level could trigger further downside toward the ₹100 psychological support.
Directional Bias : NEUTRAL / CAUTIOUSLY BULLISH
The bias is currently neutral. The stock is attempting to stabilize after a prolonged correction. We are waiting for a confirmed breakout above the descending trendline to turn "Bullish."
Watch Level : Monitor the ₹145 - ₹150 zone for a breakout trigger. If the price fails to hold the ₹130 support, the bias reverts to "Bearish."
Disclaimer : This analysis is for educational purposes only and does not constitute financial advice. Please manage your risk and position sizing accordingly.
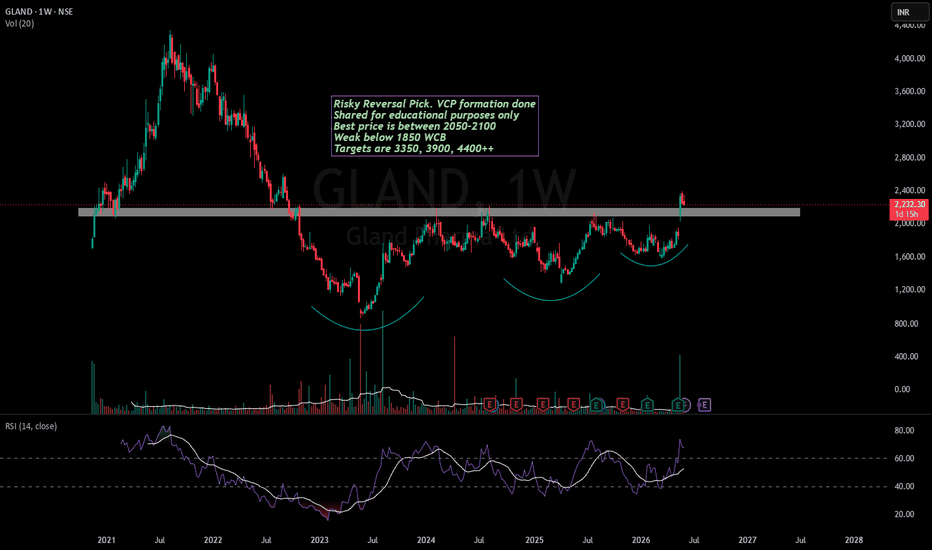
Gland Pharma - Has the race to the ATH started?Gland Pharma has given a good strong weekly breakout of a supply zone and currently consolidating above the breakout zone.
As you can see, the stock has clearly formed a beautiful VCP pattern.
Key levels to watch are mentioned on the chart.
A weekly closing above 2600 will be a strong confirmation of strength of buyers.
I had previously posted ideas (check similar ideas links) of Divis Lab & Laurus Labs. They had similar pattern visible on chart and they later went on to make a new ATH .
So, can Gland Pharma repeat the same ?
Only time can tell if it stays in your watchlist!
This idea is not a recommendation but has been strictly shared for educational purposes.
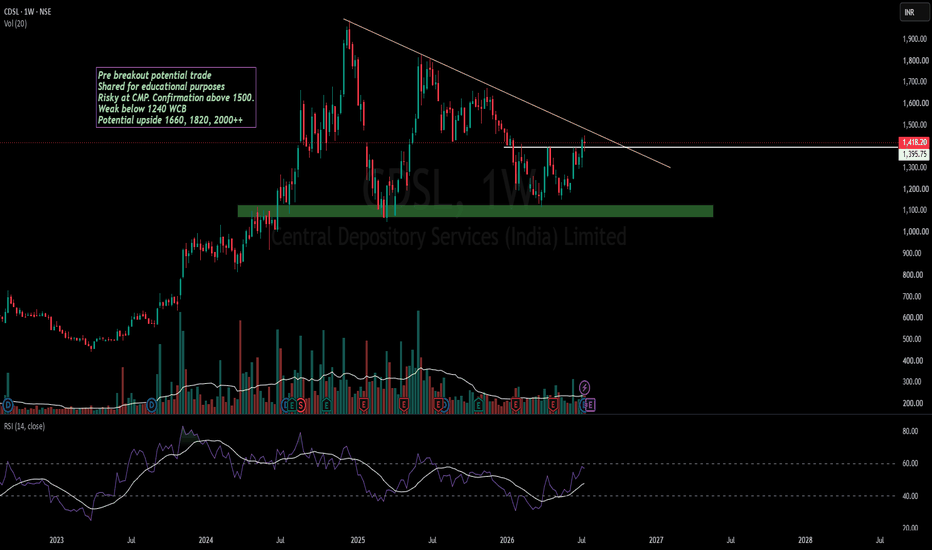
Is it the time for CDSL consolidation breakout?CDSL has been consolidating in a descending triangle pattern since last 1.5 years.
Stock is looking ripe for a breakout now as volumes have started to rise.
This stock is driven mostly by the how the money flow happens in capital markets. If the inflow in Nifty starts in next few months, we might see a new ATH in this stock as well.
Let's see whether the breakout sustains or fails. Only time can tell.
Stock is expensive at current valuation which should also be considered.
This idea is not a recommendation but has been shared for educational purposes only.
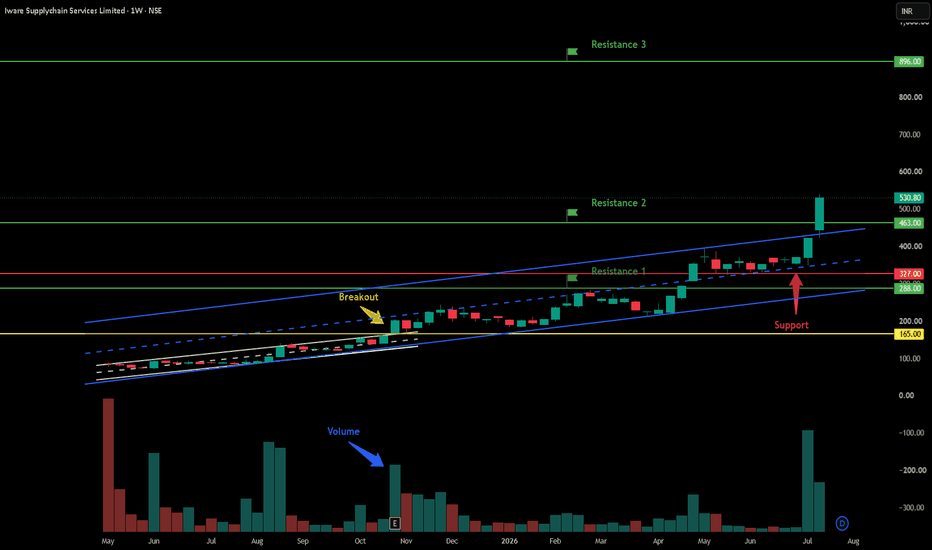
Iware Supplychain Services Ltd - Breakout Setup, Move is ON...#IWARE trading above Resistance of 463
Next Resistance is at 896
Support is at 327
Here are previous charts:
Chart is self explanatory. Levels of breakout, possible up-moves (where stock may find resistances) and support (close below which, setup will be invalidated) are clearly defined.
Disclaimer: This is for demonstration and educational purpose only. This is not buying or selling recommendations. I am not SEBI registered. Please consult your financial advisor before taking any trade.
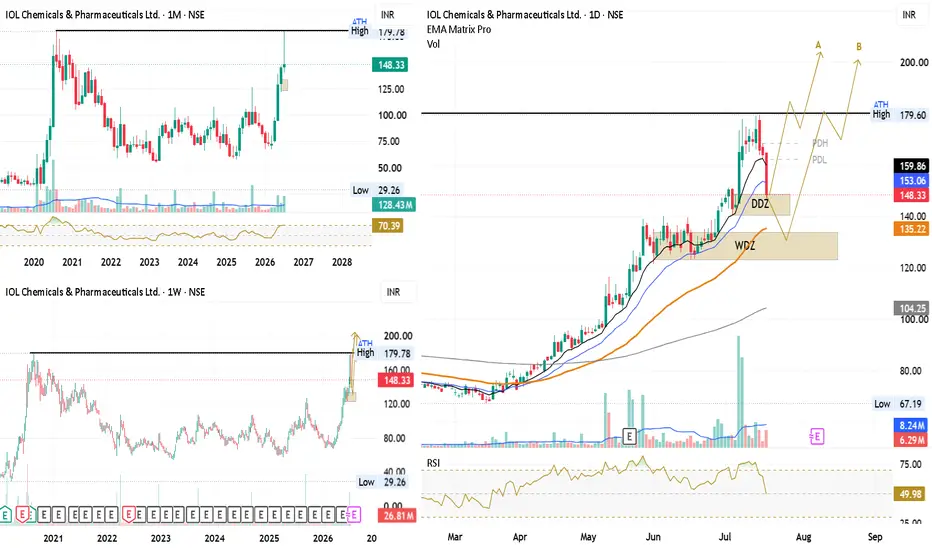
IOLCP : Multi Timeframe Analysis NSE:IOLCP
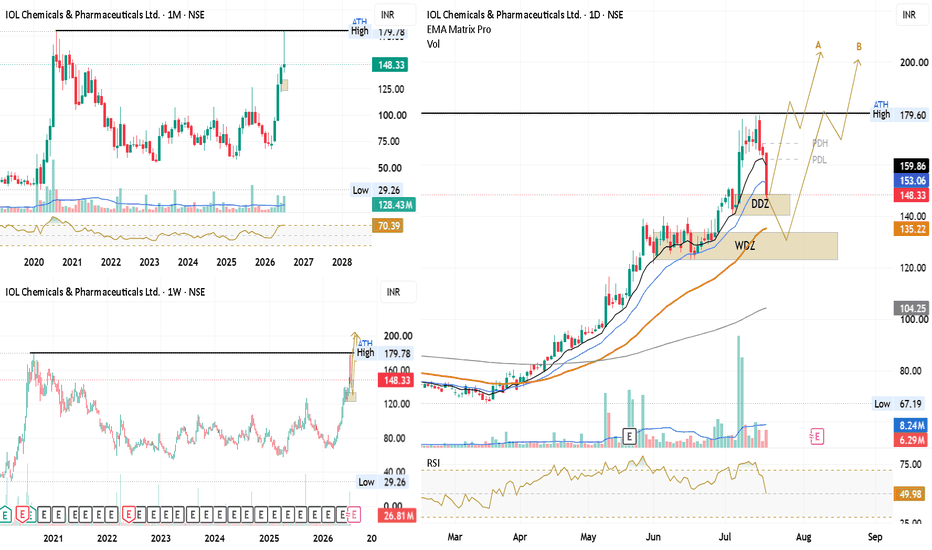
After a strong bullish rally following a long-term base breakout, price faced rejection near its all-time high, where historical supply emerged and triggered a healthy pullback. Notably, the decline has occurred without aggressive selling volume, suggesting profit booking rather than broad-based distribution.
The focus now shifts to the identified Daily Demand Zone ( DDZ ), followed by the Weekly Demand Zone ( WDZ ) if the correction extends. My preferred approach is to wait for price to pause, stabilize, and confirm a bullish reaction from either demand zone before considering any long opportunity.
A sustained recovery from these demand zones could pave the way for another attempt at the all-time high and potentially a new price discovery phase. The broader Pharma sector is also showing supportive price action, which adds strength to the overall bullish outlook.
Trade Plan:
→ ✅ Consider long opportunities only after bullish confirmation from DDZ or WDZ.
→ ✅ Patience over prediction — let price confirm strength first.
→ ❌ This bullish view becomes invalid if price records a daily close below the Weekly Demand Zone.
This analysis is shared for educational purposes only and should not be considered investment advice. Please conduct your own research and manage risk appropriately.
Websol Energy System Ltd – Bullish Pennant/Flag Breakout WatchNSE:WEBELSOLAR | Chart: Daily | CMP: ₹104.29
Setup:
WEBSOL had a strong impulsive rally from the ~₹50 zone in March 2026 to ~₹130 in April — a sharp "flagpole" move on rising volume. Since then, the stock has been consolidating in a tightening descending/symmetrical wedge pattern for nearly 3 months, with lower highs and a flattening base near ₹95–100.
This structure resembles a classic bullish flag/pennant continuation pattern.
Key levels:
Flagpole base: ₹50
Flagpole high: ₹130
Consolidation support: ₹95–100
Trendline resistance (upper boundary of flag): ~₹110–115
Breakout trigger: Close above ~₹110 with volume expansion
Projected targets (if breakout confirms):
Using the measured-move method (flagpole height added from breakout point):
Target 1: ₹150–160
Target 2: ₹185–200
Invalidation:
A daily close below ₹95 would invalidate the bullish structure and suggest continuation of the range/consolidation rather than a breakout.
Volume note:
Volume has been relatively muted during the consolidation phase (typical for flags), but a genuine breakout should ideally come with a noticeable volume spike above the recent average — without that, treat any upside move with caution as it could be a false breakout.
Disclaimer:
This is purely a technical pattern observation for educational purposes, not investment advice. Flags/pennants don't always resolve in the expected direction — always confirm with volume, price action, and your own risk management before acting.
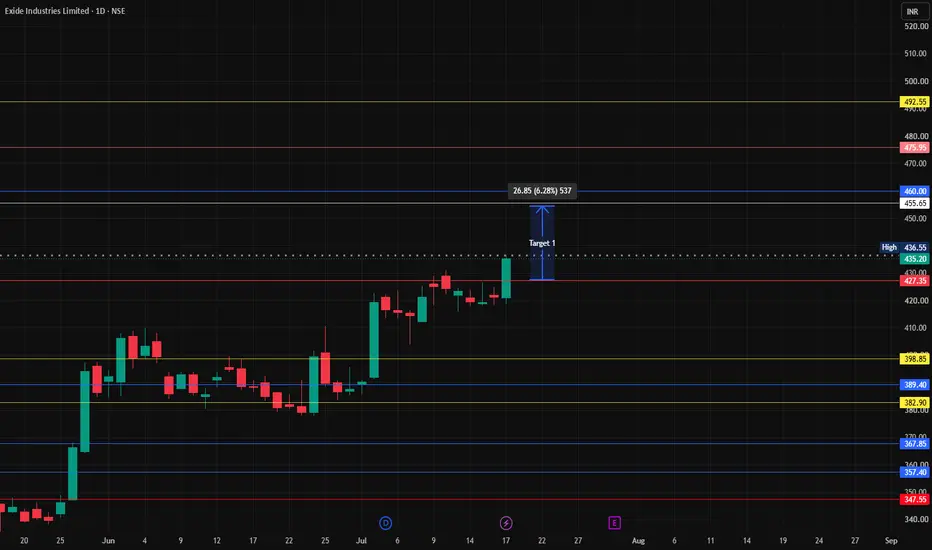
EXIDE INDUSTRIES – TECHNICAL SETUP (1D)
Strong Breakout with Momentum – Bullish Continuation Likely
The stock has given a clean breakout above the ₹430 resistance zone. Strong bullish candle with momentum → indicates buyer dominance. Structure forming higher highs & higher lows (uptrend intact)
Buy on Dip Strategy
Entry: ₹430 – ₹435 (retest zone)
SL: ₹415
Target 1: ₹460
Target 2: ₹475+
Potential Upside: ~6–12% move
₹3000 Cr EV battery investment + strong auto demand driving growth. Company shifting from lead-acid to lithium-ion space. Long-term story looks strong, but watch margin pressure.”
The Bengaluru plant is expected to begin generating revenue in the third quarter of the current fiscal year, so we expect it to drive growth next year.
Disclaimer:
This is for educational purposes only. Not a buy/sell recommendation. Do your own analysis before investing. I am not responsible for any profit/loss.
CRISIL LTD – TECHNICAL ANALYSIS (1D)
Breakout from Descending Channel – Bullish Setup Active
Price has broken out of a falling channel/wedge pattern
Strong bullish candle indicates momentum shift from bearish → bullish. Structure now forming a higher low near the support trendline
✅ Current Price: ~₹4245
🟢 Immediate Resistance / Target 1: ₹4450 zone
🚀 Major Resistance / Target 2: ₹4870 (previous swing high)
🛑 Stop Loss: ₹4050 (below recent support 4033)
TECHNICAL INSIGHTS
Breakout backed by trendline support confluence
Price sustaining above moving average (trend strength)
Possible retest of breakout zone before continuation
“CRISIL showing bullish breakout from falling channel. Momentum building with upside targets ₹4450 / ₹4870. Buy on dips looks favorable. Keep SL below ₹4050.” (4033)
**Disclaimer:
This is for educational purposes only. Not a buy/sell recommendation. Do your own analysis before investing. I am not responsible for any profit/loss.
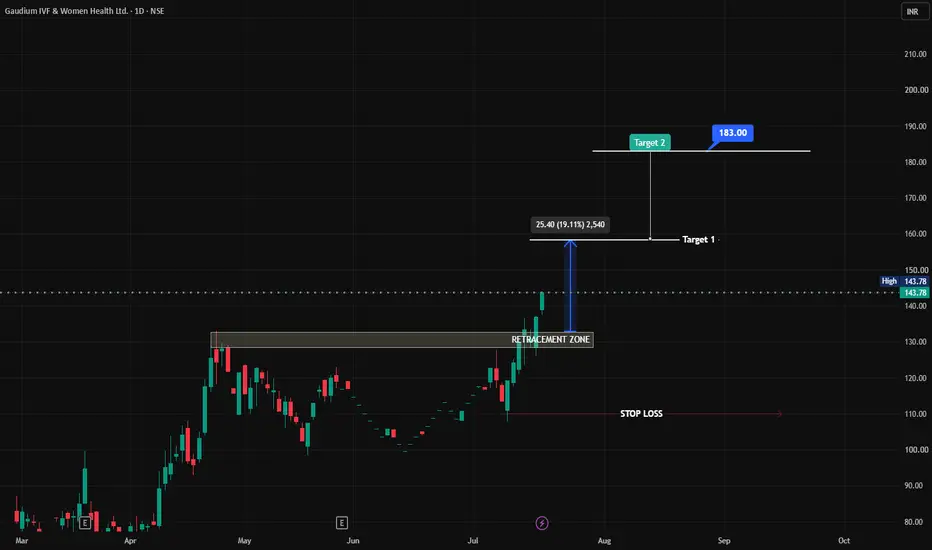
GAUDIUM IVF – TECHNICAL + FUNDAMENTAL BREAKOUT
*** Strong Bullish Momentum Confirmed (Chart + Data Match)
Stock recently made a fresh breakout near the ₹140 zone
Trading near 52-week high (₹133–₹137 zone earlier)
Clear Higher High – Higher Low structure → Strong uptrend continuation
🟢 Demand Zone: ₹128 – ₹132
🟡 Retracement Zone: Perfect bounce area
🔴 Premium Zone: Above ₹140 (current price area)
Institutions likely active near the demand zone
About the Company
Gaudium IVF and Women Health Limited is one of India's leading IVF (In-Vitro Fertilization) chains, founded in March 2015 by Dr. Manika Khanna and Dr. Peeyush Khanna in Delhi. It is a healthcare services company focused on fertility treatment, women's health, and assisted reproductive technology (ART).
The company operates through a Hub-and-Spoke model — 7 Hubs (full-service IVF centers) and 28 Spokes (strategic alliances with infertility experts) across 9 states in India, totaling 30+ locations.
It was successfully listed on NSE & BSE on February 27, 2026, at an issue price of ₹79/share.
CEO & Founder — Dr. Manika Khanna
Detail Information
Designation Chairperson & Managing Director (CMD)
Education MBBS (Gold Medallist), MD in Obstetrics & Gynecology — Maharaja Sayajirao University of Baroda
Specialization Advanced Gynecological Endoscopic Surgery — Kiel, Germany
Experience 16+ years in IVF treatment
Awards Delhi Ratna Award (2008), Women Excellence Award (2016), Oxford Academy UK — Medical Science Global Women's Health (2021), BusinessWorld Healthcare Personality of the Year — Women (2017)
Dr. Manika Khanna is the primary driving force behind Gaudium IVF. She is not just the clinical head but also the strategic and business leader of the company. She was also the selling shareholder in the IPO's Offer for Sale, divesting ~94.93 lakh shares worth ₹75 crore
Business Model
Gaudium IVF operates a diversified, patient-centric revenue model:
Revenue Stream Contribution
IVF Treatment 64%
Pharmacy 31%
Hospital Services 4%
The pharmacy segment grew from just 0.50% in FY23 to 28.85% in FY25 — a massive margin-enhancing shift.
Patient Journey: Lead generation → Consultation → Stimulation → OPU (Ovum Pick-Up) → Embryo Transfer → Post-care. Approximately 70% of the package amount is collected by the OPU stage, ensuring strong cash flow visibility.
Key Differentiators:
• GAAT (Gaudium Advanced Analysis and Treatment) — proprietary genome-based personalization system
• 58.74% IVF success rate (as of Sept 2025) vs. industry average
• Focus on complex/high-risk IVF cases (patients with 10–15 failed cycles)
• ₹7.39 crore invested in R&D as of March 2025
• Average Revenue per Patient: ₹3.55 lakh
• IVF in India costs ₹3–4 lakh vs. ₹18 lakh in the US — strong medical tourism advantage
Shareholding Pattern (Latest: FY27 Q1)
Category Holding %
Promoters 71.29%
FII (Foreign Institutional) 3.02%
DII (Domestic Institutional) 2.22%
Public 16.78%
Others 6.69%
>> Promoter holding is strong at 71.29% — zero pledging reported
Growth Strategy & Expansion Plans Year Expansion Plan FY27 - 3 new hubs launching (2 in Delhi/NCR, 1 in Nagpur) FY28 8 new centres planned FY29 1 additional centre
360° Customer Acquisition Strategy:
1. Digital Marketing (50%) — performance marketing, Tier II/III city targeting
2. Word of Mouth (30%) — strong patient & doctor networks
3. PR (10%) — media, celebrity partnerships
4. Brand Building (10%) — ATL/BTL advertising
Key Growth Drivers:
1. 13% national infertility rate — 27.5 million couples affected
2. India's Total Fertility Rate fell to 1.9 (below the replacement level of 2.1)
3. Technological advances — AI embryo selection, time-lapse incubators, genetic testing (PGT)
4. Expansion into Tier 2 & Tier 3 cities
5. Medical tourism — India's IVF costs are 80% cheaper than the US
6. ART (Regulation) Act providing regulatory clarity
Debt/Equity 0.52 (manageable)
Sector Tailwind Strong — 13%+ CAGR IVF market
Expansion Aggressive — 12 new centres by FY29
“Strong breakout stock with solid fundamentals like 25% ROE & expansion plans. Brokers positive but valuation expensive. Best strategy: Buy on dips, not at highs. Momentum intact with upside potential.”
Kfintech - Buy
Kfintech completed its intermediary degree impulse wave on 30 Dec 2024 and has been undergoing correction for the last 1.5 years.
The corrective structure is a zigzag (5-3-5) structure, numbered ABC.
Wave A of the zigzag which is a 5-wave sequence got completed on 19 Feb 2025
Wave B of the zigzag, a counter trend structure got completed on 25 Jun 2025
Wave C has been progress since the last one year.
Wave C is also a 5-wave sequence. It is highly likely that wave 5 (of Wave C) got completed at 61.8% of Wave 3 on 18 May 2026 (as given in the chart).
Wave C made an equal low to Wave A and together achieved 61.8% retracement of the impulse wave.
Further, it is highly liked that the stock has completed its lower degree impulse and correction as well yesterday. One may consider going long on the stock with a stop loss of 825. Target will be indicated in comments as the wave progresses.
Kalyan JewellersViews expressed are based on Elliott Wave Principle.
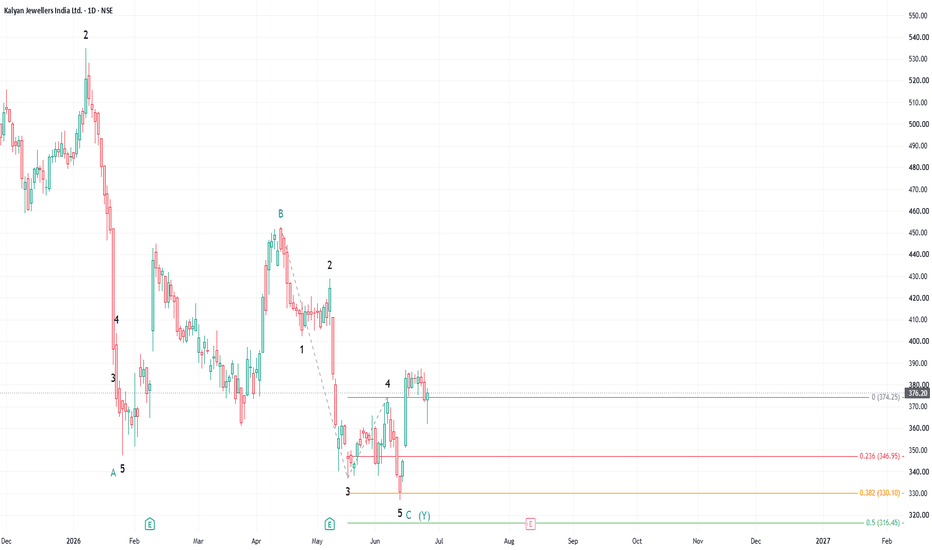
Kalyan Jewellers has been undergoing correction since 2 Jan 2025 after completing a 5-wave impulse sequence of "Intermediary Degree", thus completing its first "Primary Degree" wave as per Elliott Wave Principle.
The stock has been undergoing correction in the form of double zigzag ("WXY") pattern. In the first zigzag as well as the second, Wave A happened to be large and Wave C happened to be small.
What is a WYX / Double zigzag pattern?
Zigzag is one of the three primary corrective structures with a 5-3-5 sequence, labelled as Wave A, Wave B and Wave C, wherein Wave A and Wave C are actionary waves and Wave B is the counter wave. A double zigzag consists of two zigzags, labelled as Wave W and Wave Y, separated by an intervening counter wave, labelled as Wave Y. This pattern result in deeper correction.
Why buy now?
Wave 5 of Wave C of Wave Y (second zigzag) seem to have completed at 38.2% of the length of Wave 1-3 on 11 June 2026 as given in the annexed chart. Incidentally the stock has also retraced 61.8% of the entire upmove. A new impulse has possibly commenced after completion of the correction.
Buy with a stop loss of 320.