RF Long — RF pulls back to vwap support and buyers are stepping Neutral 4h pullback with vwap support and wide 2.87 R reward sets up a long; strong earnings, dividend increase and fresh analyst upgrades provide clear fundamental backing for continuation.
📍 Entry: 30.83
🛑 Stop: 30.26
🎯 Target: 32.47
⚖️ R:R: 2.88
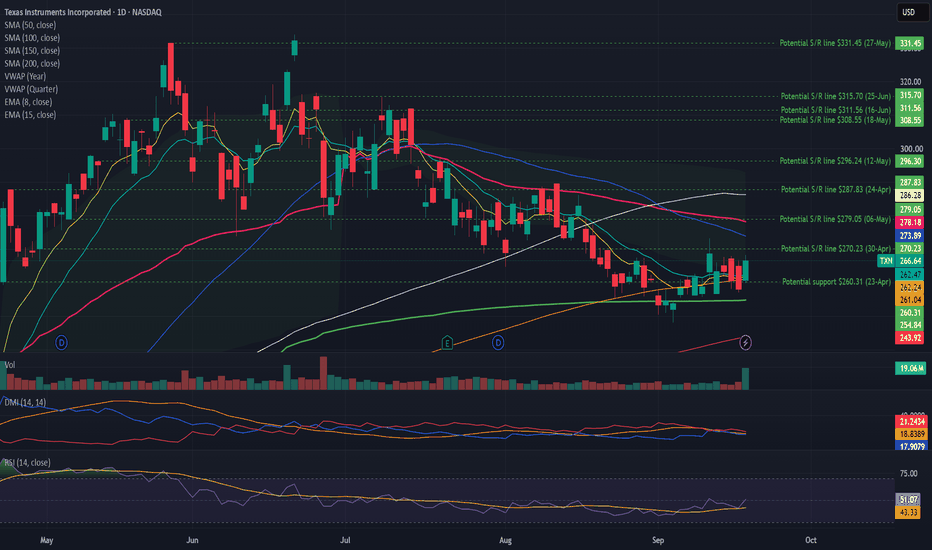
TEAM — 60 Seconds Read: Relaunch, but extreme volatility1️⃣ What do we see?
TEAM has produced a strong upside expansion day and closed near its high. Price is above EMA8, SMA20, SMA50 and SMA100, while RS is rising with price. Short-term momentum is accelerating, but SMA20 remains below SMA50, SMA100 remains below SMA150, and volatility is extreme.
2️⃣ Thesis
TEAM is attempting a legitimate momentum relaunch, but it remains a transition setup until price establishes acceptance above the $96–100 zone.
The opportunity is real. The structure is not finished.
3️⃣ What validates the thesis?
Price holds above SMA150 near $96.80
Multiple closes establish acceptance above $97–100
RS remains above its moving average
EMA8 near $92 holds on pullbacks
Volatility stops expanding or begins to contract
SMA20 continues accelerating toward SMA50
Price progresses toward $108–112
4️⃣ What invalidates the thesis?
Price rejects the $96–100 area and loses $92
A close below approximately $89–90
RS falls below its moving average
Downside volatility expands after the breakout attempt
Price returns to the prior July range
Short-term momentum rolls over before structural repair completes
BBY - 60 Seconds Read: A fully confirmed daily uptrend1️⃣ What do we see?
BBY is in a fully confirmed daily uptrend. Price is above every major moving average, the SMA stack is bullish, RS is rising with price, and the stock is pressing near a new 52-week high. The June breakout was accepted, and July produced another expansion leg.
2️⃣ Thesis
BBY remains a valid momentum-continuation candidate, but current extension makes staged engagement superior to chasing full size.
The trend is strong enough to own. The entry is extended enough to manage carefully.
3️⃣ What validates the thesis?
Price holds above EMA8 near $83.60
Pullbacks remain controlled above $82.50–84
RS stays above its moving average
Price accepts above approximately $87
Volatility remains normal or expands with upside progress
SMA20 momentum remains positive
4️⃣ What invalidates the thesis?
Price decisively loses $79.80–81
RS breaks below its moving average
A 52-week-high breakout fails while downside volatility expands
Price stops progressing as volatility rises
SMA20 momentum turns negative alongside structural damage
TEDS Swing Trading Analysis | DLF Sell SetupMany traders believe the job is done once a signal appears. In reality, a signal is only the starting point of disciplined trade planning.
The TEDS (Trend Exhaustion Detection System) is built to help traders move from observation → confirmation → execution, instead of reacting emotionally to market movements.
Chart Observation
🔹 Following a sustained bullish move, the framework first entered a Short Queue, encouraging patience while monitoring for a potential trend exhaustion.
🔹 Once the required confirmation conditions aligned, TEDS generated a Sell Signal and established a predefined Entry Zone.
🔹 Before planning the trade, the framework also identified the Stop Loss Area and the first Target Level (T-1), allowing traders to evaluate the complete risk-to-reward structure before execution.
The purpose of a trading framework is not to predict every market reversal.
Its purpose is to help traders answer the right questions before placing an order:
• Has the setup been fully confirmed?
• Is the entry based on predefined rules rather than market noise?
• Is the downside risk clearly defined?
• Do I have a complete trading plan before execution?
The market rewards consistency more than excitement. A disciplined process repeated over hundreds of trades is more valuable than chasing individual opportunities.
Trade with a Framework. Not with Emotions.
Disclaimer: This chart is shared for educational purposes only to explain a structured trading framework and market behaviour. It is not investment advice or a recommendation to buy or sell any security. Please conduct your own analysis and apply appropriate risk management before making any trading decisions.
ICHR - Incomplete Edge. When to review?The edge is real but incomplete. It is an early preparation edge, not a confirmed execution edge. Structure, RS, volatility and acceptance jointly support continued monitoring; momentum and participation must repair before the setup deserves commitment.
🔻 Deterioration Alerts
Reassess conditions if price closes decisively below approximately $159–160.
Review regime quality if RS falls below its moving average.
Current classification may no longer apply if downside volatility expands while price remains below SMA20.
Purpose:
Early warning
Drawdown prevention
Capital protection
🔺 Improvement / Repair Alerts
Reassess conditions if price reclaims and holds above EMA8 at $168.40.
Review regime quality if price resolves the July range above approximately $174–176 with improving participation.
Reassess conditions if RS resumes upward expansion while price holds above SMA20.
Purpose:
Restore optionality
Qualify the stock for renewed consideration
🔁 Reassessment Qualification Alerts
Current classification may no longer apply if volatility exits the low regime.
Reassess conditions if price resolves the full $159–181 range.
Review regime quality if an attempted breakout above the July range immediately fails.
Purpose:
Trigger a full TradeSentinel reassessment
Not execution
Palantir: Growth Acceleration and a Possible New Impulsive PhaseAfter the May 4 earnings report, Palantir delivered exceptionally strong results, with revenue reaching approximately $1.63 billion, representing 85% year-over-year growth. The most significant driver of performance was the U.S. business, which grew 104% overall, with U.S. commercial revenue accelerating sharply by 133% and government revenue increasing by 84%, highlighting strong momentum across both segments of the business. Profitability remained at very high levels for a rapidly growing software company, with an adjusted operating margin of around 60% and substantial net income supported by strong operating leverage. The company also reported continued expansion in deal activity and backlog, including growth in large contracts and remaining deal value, which contributed to an upward revision of full-year 2026 guidance to approximately $7.65 billion in expected revenue.
From a technical analysis perspective, the price structure appears to have completed a minor Elliott Wave cycle, although with the usual flexibility required when applying Elliott Wave Theory to single equities rather than indices, for which the framework was originally designed. Within this context, the recent consolidation and subsequent price action could be interpreted as the potential start of a new minor impulsive wave, suggesting that momentum may be entering a fresh phase following the completion of the prior structure.
Heading into the next quarterly release, these figures set an extremely high benchmark. The market is no longer pricing Palantir as a typical growth software company but as a key beneficiary of the artificial intelligence adoption cycle. As a result, even strong performance may be viewed as insufficient unless it is accompanied by further acceleration, particularly in U.S. commercial growth and additional upward revisions to guidance, which remain the primary focus for investors.
This is not a financial advice.
AMD $500 Breakout Context: Elliott Wave Extension and Structure As highlighted in the previous study, I was expecting the development of a primary degree Wave 3, which over the past weeks has turned out to be significantly more extended than initially projected.
The move has in fact surpassed the target area identified between the Fibonacci extension levels of 1.619 and 2, which represented the expected equilibrium zone for a standard impulsive extension.
In the context of an extremely strong bull run like the current one, such extensions are not unusual and can occur when directional pressure remains sustained well beyond the typical cycle structure.
What is currently observable is the development of a 5-wave impulsive structure of minor degree, consistent with the continuation of the ongoing trend. It will be crucial to monitor price reaction in the coming sessions, especially after reaching the psychological level of $500.
It is also important to remember that Elliott Wave analysis should always be interpreted with flexibility, as it was originally designed for equity indices and tends to perform better on broad and highly liquid structures, while individual stocks may exhibit more pronounced extensions or irregularities.
At the moment, the study appears to maintain a reasonable degree of adherence to the current market context and price dynamics, but it will remain subject to review in the coming weeks for potential updates and count adjustments.
This is not a financial advice.
ServiceTitan, Inc. (TTAN): A Titan in the MakingServiceTitan, Inc. (TTAN): A Titan in the Making: Digitizing the Skilled-Trades Economy
We believe ServiceTitan shares offer an attractive investment opportunity, with a target price of $105 per share.
Ticker: TTAN
Share price as of the analysis date: $80.5
Target price: $105.0
Upside potential: 30.4%
Stop-loss: $64
ServiceTitan is a rapidly growing SaaS leader that is transforming the skilled-trades industry through a scalable, cloud-native, and deeply integrated platform. Its solution brings together key capabilities- including CRM, field service management, ERP, human capital management, and financial technology- allowing contractors to automate their operations, improve visibility, and increase efficiency.
The platform replaces fragmented software tools used across the residential and commercial services industries with a single, end-to-end operating system.
Key Investment Theses
Expanding Market Opportunity
ServiceTitan operates in the large and fragmented skilled-trades market, which is estimated to exceed $1.5 trillion. The company aims to capture the equivalent of approximately 2% of this market through increased adoption of its platform.
As of 2025, ServiceTitan’s serviceable addressable market, or SAM, is estimated at approximately $13 billion, while its total addressable market, or TAM, exceeds $30 billion. Key growth drivers include accelerating digital adoption, industry consolidation, and expansion into new verticals such as landscaping, roofing, and pest control.
ServiceTitan continues to expand its market presence by growing its customer base and increasing gross transaction volume, or GTV, per customer. Its successful M&A strategy, combined with continued investment in research and development, go-to-market capabilities, and customer success, supports the ongoing expansion of its addressable market.
The Gold Standard for the Skilled Trades
ServiceTitan has established itself as the leading vertical SaaS platform purpose-built for the skilled-trades industry. Deep partnerships with major consolidators such as Wrench Group, together with AI-powered analytics provided through Titan Intelligence, position the company as a core technology platform for scaled service operators.
ServiceTitan is deeply embedded in its customers’ workflows, supporting strong retention as well as attractive upselling and cross-selling opportunities.
Significant Long-Term Margin Expansion Potential
ServiceTitan’s non-GAAP operating margin has already reached 9.8% and is expected to improve by several percentage points annually. Management is targeting a long-term operating margin of more than 25%, supported by greater scale, a favorable shift in the revenue mix, and improving customer-acquisition economics.
The company has also achieved sustainable positive free cash flow and maintains a net cash position. This financial flexibility should, among other benefits, support faster expansion into new verticals through ServiceTitan’s proven bolt-on acquisition strategy.
Valuation and Recommendation:
We initiate coverage of TTAN with a Buy rating and a price target of $105 per share , implying upside potential of approximately 30.4% from the share price used in this analysis. We recommend setting a stop-loss at $64 per share.
PLTR: Two Accumulation Zones, Three Years ApartThis chart shows two signals from the same structure tool, three years apart. Reading them together is a lesson in what accumulation zones are - and what they aren't.
The old zone: May 2023, around $8
Structura Accumulate marked a zone when PLTR was rebuilding structure near $8 - deep in the post-2022 reset, when attention on the name was minimal. What followed is one of the strongest advances of this cycle.
Here's the honest part: that zone did not predict the advance. It identified a structural condition - price rebuilding around a long-anchored reference after a major decline. The magnitude of what came after belongs to the market, not the tool. Zones can fail. This one didn't - and using a single spectacular example as proof would be exactly the kind of thinking structure analysis exists to replace.
The new zone: 17 bars ago
A fresh Accumulate signal fired about three and a half weeks back - the first on this chart in a long while. The tool's silence between the two zones matters as much as the signals: through the entire advance, no new zone. Accumulation is a rebuilding behavior; it appears where structure is being built, not where trends are extending.
How to treat a fresh zone - the protocol
A new zone is not a trigger. It is an area of interest with a binary question attached: acceptance or rejection.
Watch how price behaves around the zone over the following weeks - stabilization and reclaim, or failure and continuation lower.
Acceptance means structure is holding: the market is treating the area as a base.
Rejection is information too - it tells you the rebuilding attempt failed, and you learned it without predicting anything.
Either way, you stay objective. The zone defines where to pay attention; the market's reaction supplies the verdict.
The takeaway
Two zones in three years on one of the market's most-watched names - that selectivity is the feature. A structure tool speaks rarely, at structurally meaningful places, and stays silent everywhere else. What it never does is promise that the next zone rhymes with the last one.
Structura Accumulate is free and public - full framework in our profile.
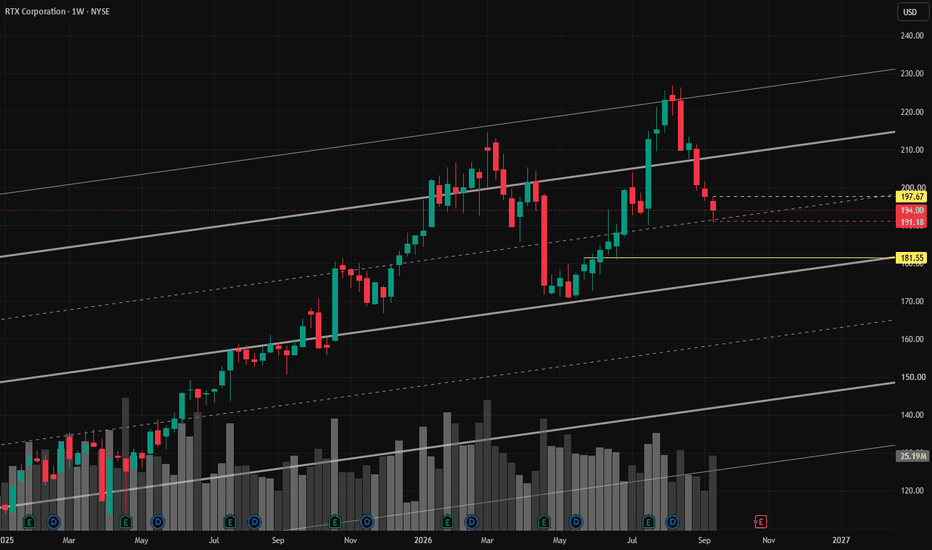
$TSLA — Weekly Elliott Wave StructureFrom the April ’25 lows, I’ve mapped out one possible eight-wave Elliott Wave structure: a five-wave impulse higher, followed by an A-B-C correction, with wave C potentially still in progress.
The impulsive move topped around $495 in December, completing the fifth wave before price entered the current corrective phase. Since then, Tesla has continued printing lower highs and remains inside a descending channel.
I’ve kept the main channels, consolidation patterns, moving averages and key levels on the chart. Green lines show the important bullish structures, while red lines highlight those that have already broken.
The Fibonacci retracement is measured across the entire five-wave advance. The April low reached the 50%–61.8% retracement zone, which still leaves the broader structure constructive from a Fibonacci perspective.
The main support levels now sit around:
• $355 — 50% retracement and 50-week MA area
• $337 — previous corrective low
• $322 — 61.8% retracement
For the bullish structure to begin rebuilding, price needs to reclaim the shorter-term moving averages and break above the current descending channel. The first major resistance sits around $449, followed by the December high near $495.
With earnings due, it may take a clear beat or miss to push price decisively out of this correction. Until then, the wider structure remains bullish, but the shorter-term trend is still corrective.
NFA. DYOR.
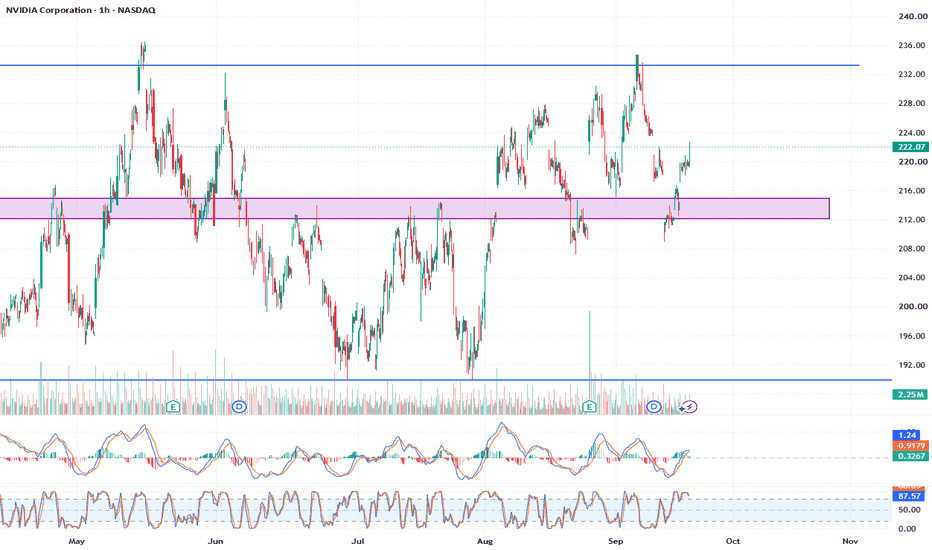
NVDA Defended 202.20 A Second Time.NVDA Defended 202.20 A Second Time.
The base held again. NVDA came back to 202.20 for the second test flagged yesterday and defended it, bouncing to 205.95 and reclaiming 204.82 for the second time in three sessions. The daily has turned constructive - a long thesis with top-quartile conviction and an entry forming - though the old daily bear print is still standing and the daily is reading panic. Two successful defenses of the same level is what a floor looks like. The level that decides the recovery is still 207.59. Neutral.
Resistance: 207.59 - the lost breakout level, still the decider
Key resistance: 213.43-213.81 - the prior high
Current price: 205.95
Support: 204.82 - reclaimed again
Key support: 202.20 - the twice-defended base
Structural floor: 199.89 - first shelf below
Two paths from here:
The second defense leads to a real reclaim of 207.59. A base that holds twice, with the daily turning long and conviction top-quartile, is a genuine floor. Take 207.59 and the entire drop resolves as a two-week shakeout with 213 back in view.
It stalls under 207.59 for a third time. NVDA has already failed at that level twice. A third rejection with a bear print still standing overhead makes 202.20 a third test - and third tests of a level usually break it.
Two defenses of 202.20 have made it a real floor. But the recovery does not exist until 207.59 goes, and that level has rejected twice already.
Built with SYNTHESIS v3.3 | SOM / ACE / IMP / SYNTHESIS
Study, not financial advice.
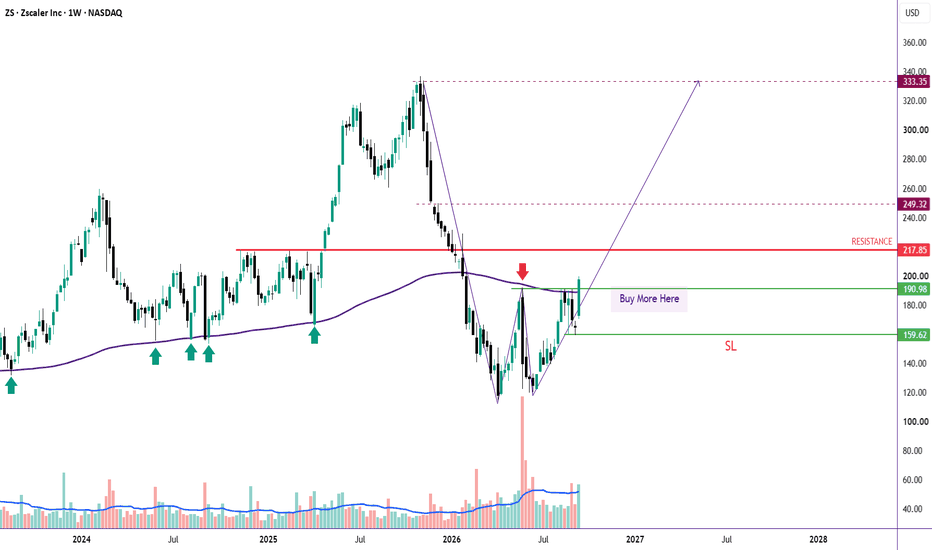
Position Trade 2: FLGTLet's try again, this setup looks better than my previous one: FLGT did a breakout yesterday after staying in a bottom for almost 3 months. The indicated platform looks like a buy zone where the institutions were accumulating, we see a pretty flat A/D (with a few anomalies) and above average volume between 05-01 and 05-08 with price staying in range. ChiOsc and MFI both crossed above 0 recently. This all looks pretty good. Institutional holdings are about 68% according to Nasdaq, this is ok but above 70-80% would be better.
Setup as follows:
Entry: Pop out of the box after bottom completion
Order Stop 17.65, Limit 18.03, GTC
SL: ~Consolidation low, 15.36
TP: ~January Low 25.5
Status: Pending
We only want to enter if yesterday's spike was an anomaly that's why we use a stop limit order to avoid being trapped. Be cautious: Analyst ratings of this stocks are not that good (Piper Sandler downgraded to $15) and the company is still in loss, but revenue is growing since the post covid decline, the company seems to be recovering. Sector is healthcare which is currently gaining strength.
Eaton: From Auto Parts Maker to AI Power Kingmaker?Eaton (ETN) is executing one of the more striking corporate transformations in industrials, pivoting from a legacy vehicle-parts supplier into a linchpin of global AI infrastructure. The centerpiece is the $9.5 billion Boyd Thermal acquisition, completed March 12, 2026, which closes Eaton's gap in liquid cooling and hands it end-to-end control of the "grid-to-chip" stack, from high-voltage power distribution down to the cold plates cooling AI servers. Priced at a 22.5x EBITDA multiple, the deal alone is projected to add $1.7 billion in 2026 sales.
The macro backdrop is doing much of the heavy lifting. AI data centers could consume up to 17% of total U.S. electricity by 2030, and slow-moving public utilities are pushing hyperscalers toward behind-the-meter power solutions, a shift Eaton is positioned to capture. The numbers already reflect it: electrical backlog surged 48% year-over-year to a record $19.6 billion, on top of record FY2025 revenue of $27.4 billion. That growth isn't free, though; net interest expense nearly tripled year-over-year and acquisition charges pulled GAAP EPS down to $2.22 from $2.45, underscoring near-term margin compression even as the top line accelerates.
Portfolio reshaping continues on multiple fronts: the Mobility Group is being spun off and combined with Dana Incorporated in a $5.1 billion Reverse Morris Trust transaction expected to close by Q1 2027, a new additive-manufacturing center just opened in Wimborne, UK, and a FranklinWH partnership extends Eaton's "Home as a Grid" strategy into residential energy storage.
Markets have taken notice. ETN shares are up 17% year-to-date, trading near $401 at a 39.1x P/E, with Citigroup, Morgan Stanley, and RBC lifting price targets as high as $500 and bullish options activity spiking 648% in a single session. The open question for investors: can execution keep pace with a valuation that's already pricing in near-flawless delivery on that $19.6 billion backlog?
GAMON-Breakout bullish ProjectionGAMON has recently broke out of the consolidation box,there is also a bullish divergence backing the bullish stance,as per bullish cup and handle projection,the target is around 30.With a stop loss of 18.45 the target area of 30 presents a nice and healthy 35-40% up side.
$186A , ASTROSCALE HOLDINGS , IdeaNormally not posting a full setup here.
ENTRY : CMP
TP1 : **
TP2 : **
TP3 : **
TP4 : **
SL : If you wish
** FULL SETUP AVAILABLE**
My SL is never a SELL, just an alarm to stop adding money and wait for better dca
Follow, Boost, Join, Thank You !
⚠️ Financial Disclaimer:
This post is not financial advice. I am not your financial advisor, your life coach, or your legally responsible adult.
Always do your own research and never trade based solely on internet comedy
HFCL (HFCL Ltd.) — Technical Structure Analysis📈 HFCL (HFCL Ltd.) — Technical Structure Analysis
Chart Visual & Pattern Layout: ChartsSpecialist (via TradingView)
🔍 Technical Observations
Accumulation Breakout: The chart highlights an initial breakout from a prolonged horizontal base consolidation zone, which initiated a sharp upward trend phase.
Double Top / Overhead Resistance: Dual horizontal red lines near the top mark a key supply region where price action has encountered repeated rejections after reaching peak swing levels.
Swing Dynamics & Trend Progression: White trend lines trace the multi-leg impulse advance, showing higher highs and higher lows before transitioning into wider consolidation near the resistance zone.
📚 Technical Analysis Concepts Demonstrated
Base Breakout & Expansion: Studying how long-term range contraction often precedes strong price expansion.
Double Top Pattern: Identifying classic reversal/resistance patterns formed when buyers fail to break above a prior swing high.
Market Waves & Cycles: Visualizing impulse moves and corrective retracements within a primary uptrend.
📌 SEBI Compliant Educational Disclaimer
Regulatory Disclaimer & Disclosures:
Educational Purpose Only: This post analyzes chart patterns and technical concepts strictly for learning and educational purposes.
No Recommendation: This content does NOT contain target levels, stop-loss triggers, entry calls, or buy/sell/hold recommendations.
SEBI Registration Status: ChartsSpecialist and the publisher are NOT SEBI-registered Research Analysts or Investment Advisors.
Risk Warning: Securities trading involves market risk. Past patterns do not guarantee future price movements. Please consult a qualified SEBI-registered financial advisor before taking any market positions.
#ChartsSpecialist #HFCL #TechnicalAnalysis #ChartReading #StockMarketEducation #SEBICompliant #PriceAction #TradingView #FinancialLiteracy #NSE #DoubleTop #Breakout
IFCI (IFCI Ltd.) — Technical Structure Analysis📈 IFCI (IFCI Ltd.) — Technical Structure Analysis
Chart Visual & Pattern Layout: ChartsSpecialist (via TradingView)
🔍 Technical Observations
Major Support Zone Testing: The chart highlights price action approaching a key horizontal support region marked by prior swing demand ("Near Major Support").
Corrective Phase / Retracement: Following a peak after strong upward expansion, the stock has undergone a multi-week pullback, bringing price action down to test this established structural demand base.
Price Consolidation at Demand: Candle activity near the highlighted box reflects price deceleration and compression as it attempts to find stabilization near historical buyer interest.
📚 Technical Analysis Concepts Demonstrated
Support & Demand Zone Analysis: Observing how markets retest historic price levels where buying pressure previously emerged.
Pullback & Retracement Dynamics: Studying structural pullbacks within broader market cycles.
Volume & Price Action Interaction: Tracking price behavior and consolidation patterns near critical support areas.
📌 SEBI Compliant Educational Disclaimer & Attribution
Regulatory Disclaimer & Disclosures:
Educational Purpose Only: This post analyzes chart patterns and technical concepts strictly for learning and educational purposes.
No Recommendation: This content does NOT contain target levels, stop-loss triggers, entry calls, or buy/sell/hold recommendations.
SEBI Registration Status: ChartsSpecialist and the publisher are NOT SEBI-registered Research Analysts or Investment Advisors.
Risk Warning: Securities trading involves market risk. Past patterns do not guarantee future price movements. Please consult a qualified SEBI-registered financial advisor before taking any market positions.
#ChartsSpecialist #IFCI #TechnicalAnalysis #ChartReading #StockMarketEducation #SEBICompliant #PriceAction #TradingView #FinancialLiteracy #NSE #SupportAndResistance