Long
Long
Whirlpool Corporation (WHR) Is AwakeningKEY TAKEAWAYS
• Price Target: US$74 per share
• Potential Upside: approximately 137%
• Thesis: The combination of technical structure, a favorable economic cycle for the sector, recovering fundamentals, and positive analyst outlooks creates a compelling setup for further analysis.
WHIRLPOOL CORPORATION
Whirlpool Corporation is a leading U.S. multinational and the #1 home appliance company in North America and Latin America. The company designs, manufactures, and markets home appliances and related household products. It also ranks among the Top 3 globally , competing at the highest level with major international players such as Haier, Midea, LG Electronics, and Samsung Electronics.
Founded on November 11, 1911, Whirlpool has been listed on the New York Stock Exchange (NYSE) since 1955 and has maintained a position of industrial leadership and resilience for more than a century.
Whirlpool Corporation also maintains strategic relationships with some of the largest home improvement and department store chains across North and Latin America, including Home Depot, Lowe's, Sears, and major regional retailers.
Unlike competitors that rely heavily on importing their products from Asia, Whirlpool manufactures a significant portion of its volume directly in North America. This helps reduce international freight costs and improves response times. Its scale also allows the company to spread production costs over a large volume while continuing to invest in research and development.
TECHNICAL ANALYSIS
The first thing that caught my attention was the presence of elevated institutional volume on the price chart.
In Figure 1, you can see how historically elevated trading volumes have preceded significant price increases in Whirlpool. A leading company with a long history of consistent returns is unlikely to go unnoticed by major institutions and large investors.
Figure 1
When multiple technical tools also reveal an alignment of technical and psychological price zones, the analysis becomes more robust and encourages us to take a deeper look at the company's fundamentals.
Figure 2
EARNINGS REPORT JUST AROUND THE CORNER
The next earnings report is only 27 days away , and the current analyst outlook is positive.
One factor worth considering is that the large home appliance business tends to concentrate a significant portion of its sales and replacement activity during the second half of the year. In addition, the company has announced cost-reduction initiatives aimed at recovering approximately $150 million in operating margins .
After two consecutive quarters in negative territory, partly related to adjustments and accumulated inventories at retailers, analysts are modeling that even a modest stabilization in retail demand could bring earnings back into positive territory.
During the second quarter of 2026 , net earnings available to common shareholders increased to $75 million ($1.15 per share) , compared with $65 million ($1.17 per share) during the same period in 2025.
The company also recognized a $139 million gain related to the sale of its remaining 25% stake in Beko Europe, the termination of the agreement concerning its Russian business, and the release of accumulated indemnification provisions.
Furthermore, Whirlpool raised approximately $1.081 billion net in February 2026 through a combined issuance of common stock ($524 million) and mandatory convertible preferred stock ($557 million).
Another important factor is the IEEPA tariff recovery process. This is the legal mechanism through which U.S. importers seek refunds for tariffs collected under the International Emergency Economic Powers Act. Whirlpool secured approximately $50 million in tariff recoveries through this process.
Other factors worth keeping in mind include the decline in interest expense, from $86 million to $63 million during the quarter, while selling, general and administrative expenses (SG&A) decreased by 6.7% to $371 million .
Whirlpool Corporation also has a share repurchase program authorized by its Board of Directors. As of June 30, 2026, approximately $2.5 billion remained authorized and available under this program.
LITIGATION
For a multinational company of Whirlpool's size, many legal cases are typically resolved through economic settlements, often involving compensation funds for consumers or shareholders, without necessarily compromising the company's overall operational stability.
However, there is a significant tax dispute related to the BEFIEX program in Brazil , which represents one of the more relevant legal and tax contingencies on Whirlpool Corporation's balance sheet.
The BEFIEX program was a Brazilian government tax-incentive program — Benefícios Fiscais a Exportação — designed to support exporting companies by compensating or exempting certain federal taxes.
The dispute arose when Whirlpool used tax credits derived from this program to offset tax liabilities. Brazilian tax authorities subsequently challenged the validity and scope of a significant portion of these offsets.
The accumulated administrative and judicial proceedings amount to approximately $538 million . In its regulatory filings with the SEC, Whirlpool classifies this tax contingency as a possible but not probable loss and continues to actively defend its legal position.
If final judicial decisions in Brazil ultimately go against Whirlpool, the company could be required to make capital outlays or negotiate tax settlements, potentially affecting liquidity.
My view is that this issue is unlikely to materially affect Whirlpool in the medium term. Brazil is known for having one of the world's most complex and prolonged tax and litigation environments, meaning that disputes of this nature can take years — and sometimes decades — to reach a definitive resolution.
CONCLUSION
My analysis of Whirlpool Corporation does not rely on a single indicator or isolated phenomenon.
Instead, it is the combination of multiple factors that makes the company particularly interesting to me: the technical structure, sector dynamics, improving fundamentals, cost-reduction initiatives, potential tariff recoveries, capital structure developments, and the current analyst outlook.
The upcoming earnings report will be especially important because it should provide further evidence as to whether the recovery that the market is beginning to anticipate is actually supported by Whirlpool's operating numbers.
Price Target: US$74
Potential Upside: ~137%
As always, this is my personal analysis and not financial advice. Investors should conduct their own research and consider their individual risk tolerance before making any investment decision.
 Long
Long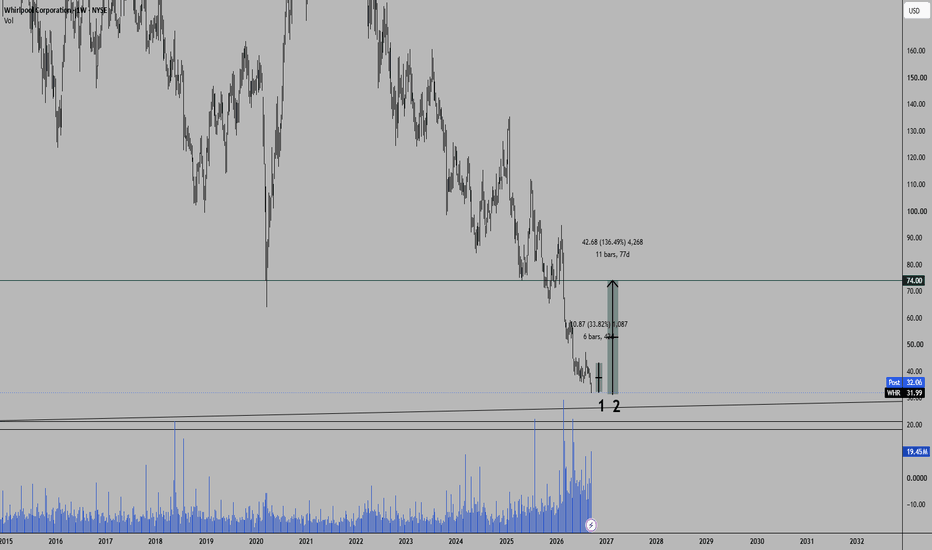
 Long
Long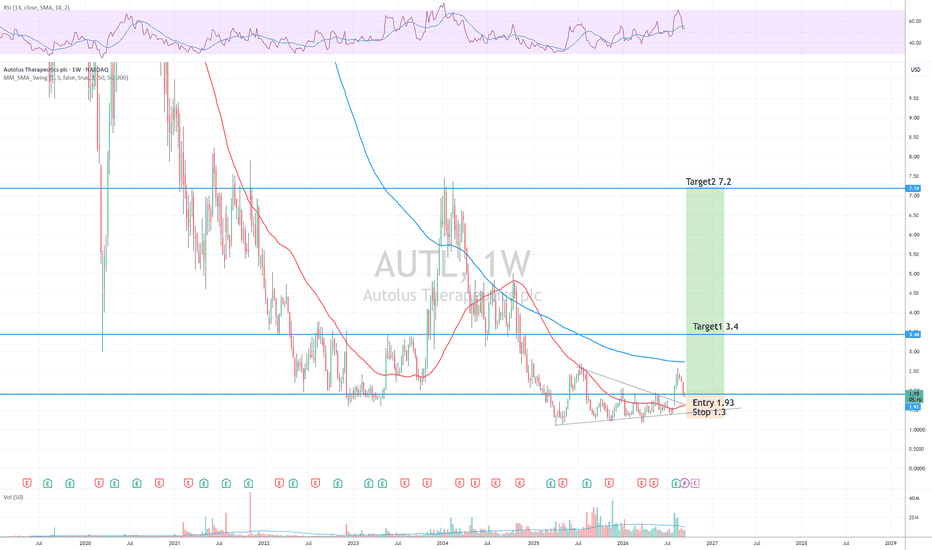
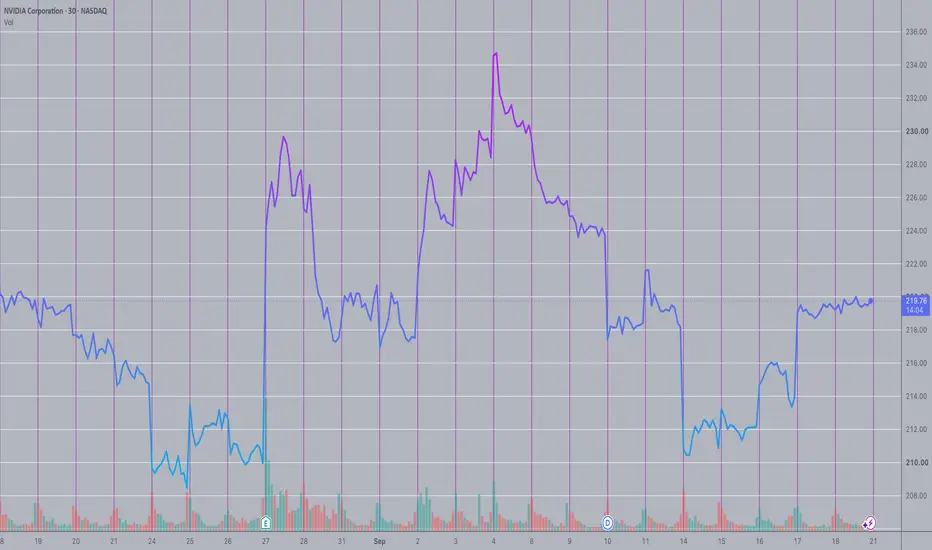
NVDA's September Drop: The 7-8% Rule in Real TimeNVIDIA printed an intraday high of $234.55 on September 4. Ten days later, on September 14, it traded down near $210 -- a peak-to-trough decline of just over 10%. It has since recovered back above $219.
I don't use this space to call tops or bottoms. I use it to talk about the mechanical rules that keep a portfolio intact when the story around a stock gets loud in either direction.
The rule here is William O'Neil's: sell if a position falls 7-8% below where you bought it. No exceptions, no waiting for the fundamentals to "catch up." Applied here, an 8% stop off the September 4 high sits around $215.80 -- a level the stock cleared on the way down well before the eventual low near $210.
The rule doesn't claim to catch the exact bottom, and it won't feel good in a case like this one, where the stock bounced back within days. That's fine. The rule isn't graded trade by trade -- it's graded over hundreds of trades, where the handful of names that don't bounce are the ones that would otherwise do real damage to an account. Capping the downside mechanically is what lets you stay in the game long enough for the winners to matter.
I apply the same logic outside of equities too -- real estate, the private fund, even the vehicle fleet at Glencore: know the number that gets you out before you're in the position, not after.
Educational breakdown of a risk-management framework, not a recommendation to buy, sell, or hold NVDA. Not investment advice. Do your own research before trading any security.  Long
Long
 Long
Long
 Long
Long
SNDK Is Back Near $1,800 — This Level Could Decide the Next Move
SNDK has moved hard, but I’m more interested in what happens next. Price is back around $1,739, right below the $1,800 area that has repeatedly acted as resistance on the 4H chart.
The bigger structure still looks constructive to me. SNDK has been making higher lows inside a rising channel, and the current move is bringing price back toward the top of the recent range.
The setup I’m watching is simple: I want a clean 4H close above $1,800, followed by a hold or retest of that level. If buyers can turn $1,800 into support, I’ll be watching $2,300–$2,400 as the next major area, close to the upper side of the broader channel.
There is also a reason to pay attention to SNDK right now. The stock is scheduled to join the S&P 100 on September 21, while memory and AI data-center demand remain important themes around the company.
Today also comes with extra market noise. The BOJ raised its policy rate to 1.25%, while U.S. markets are dealing with quarterly derivatives expiration. That can make price action less clean, so I’d rather wait for SNDK to confirm its direction than force an entry.
The downside is just as clear. My main support zone is $1,450–$1,500. If price loses that area and breaks down from the rising channel, the breakout thesis is no longer valid for me.
This is also where Bitget becomes useful for this type of setup. SNDKUSDT is available as a stock perp on Bitget with 24/7 trading, so if the setup changes after the U.S. session closes, I can still monitor and manage the position instead of waiting for the next market open.
I also like the flexibility of being able to trade the stock perp long or short with USDT rather than needing a traditional brokerage account. Bitget says its stock perps are designed for 24/7 trading and support both directions, although liquidity can vary outside regular U.S. market hours.
So my map is straightforward:
Above $1,800: breakout confirmation → watch $2,300–$2,400.
Rejection below $1,800: no chase → wait for another setup.
Below $1,450–$1,500: rising structure is weakened → reassess.
I’m not trying to predict the next candle. I’m watching $1,800 to see whether SNDK can finally turn resistance into support.
Not financial advice.  Long
Long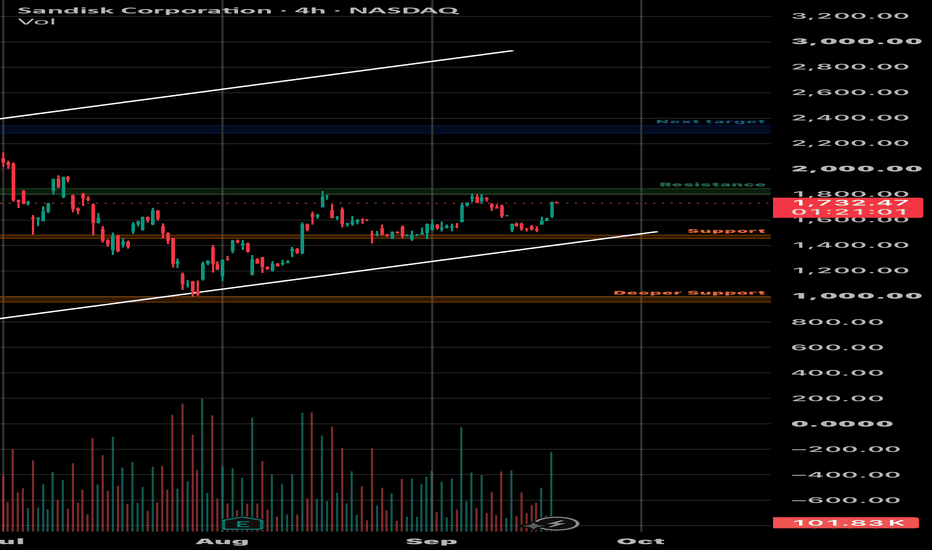
NTSK: Can Momentum Carry Price to New All-Time Highs?NASDAQ:NTSK appears to have completed a bullish Cup & Handle formation on the daily chart.
The cup developed over several months as price recovered from its early year lows and climbed back toward prior resistance. Rather than rejecting at resistance, the stock entered a controlled consolidation phase, forming the handle portion of the pattern. That handle took the shape of a tightening triangle, highlighting a period of accumulation before the breakout.
This chart matters because Cup & Handle patterns often signal trend continuation and can mark the beginning of a larger expansion phase. The rounded cup reflects a gradual shift from seller control to buyer control, while the handle represents the final shakeout before a potential move higher.
The recent breakout above the handle suggests buyers have regained momentum and may be positioning for a test of higher levels. Volume increased during the breakout, adding confidence to the bullish thesis. Price is also holding above the former resistance area near 16.5-17.0, which now becomes the primary support zone.
From a technical perspective, the next major level on the chart is the all-time high near 28. A breakout above that level would place NTSK in price discovery, where overhead resistance becomes limited. Based on the measured move of the Cup & Handle pattern, the longer-term target projects toward the 36 area.
Not financial advice. Trade your plan and manage risk.
************IF YOU LOVE PATTERN-BASED TRADING AND WANT TO SPOT KEY REVERSAL ZONES AND ROTATION EARLY, GIVE DOMINANTFORCE.IO A TRY WITH A FREE 7-DAY TRIAL.**************  Long
Long
 Long
Long
 Long
Long
 Short
Short
Hormuz Risk + $100 Oil + Temporary Block-Sale PressureFANG has recently pulled back toward the $193–194 area, but I see the weakness as potentially offering an attractive setup rather than signaling deterioration in Diamondback’s underlying business.
There are three main parts to the thesis: elevated crude prices, continuing Strait of Hormuz disruption, and company-specific selling pressure that appears largely unrelated to operating fundamentals.
1. Strait of Hormuz risk remains significant
Shipping through the Strait of Hormuz remains heavily disrupted. Recent vessel traffic has been substantially below normal levels, while Middle East shipping and infrastructure continue to face elevated geopolitical risk.
Saudi Arabia is attempting to redirect some exports through alternative routes and ship-to-ship transfers, which has helped reduce the extreme oil-risk premium. However, Saudi pipeline infrastructure has also suffered damage, and full normalization remains uncertain.
The result is an environment where crude does not necessarily need to spike toward extreme levels for U.S. producers to benefit.
WTI has recently remained around the $100/barrel region, which is an extremely favorable pricing environment for a low-cost Permian producer such as Diamondback.
My thesis does not require a complete Hormuz closure.
A prolonged environment of restricted supply, expensive shipping and crude remaining materially above historical averages would already be highly supportive for FANG's cash generation.
2. The recent FANG selloff had a major company-specific technical cause
One reason the chart currently looks weak is a very large secondary share sale.
Diamondback's largest shareholder sold approximately 9.1 million shares, worth roughly $1.9 billion.
That created a substantial amount of supply in the market and contributed to one of FANG's largest single-day declines in more than a year.
Importantly, this was not Diamondback issuing a profit warning or announcing deterioration in its Permian assets.
That distinction matters.
If the market absorbs this large block of stock while crude remains around $95–100+, I think the current weakness has the potential to turn into an attractive mean-reversion/recovery setup.
3. Fundamentals remain strong
Current TradingView fundamentals:
TTM revenue: approximately $17.1B
Revenue growth: approximately +21% YoY
EBITDA: approximately $11.2B
EBITDA growth: approximately +18%
Free cash flow: approximately $6.5B
FCF growth: approximately +56% YoY
Debt/equity: approximately 0.33
Consensus next-year EPS is approximately $20.76.
At around $194, that implies roughly:
9.3× next-year earnings
if estimates are achieved.
For a major Permian producer in a $100 oil environment, I find that valuation interesting.
Technical picture
The technical setup is not yet bullish on the shorter timeframes, which is why I see this as a potential entry zone rather than confirmation that the reversal has already begun.
Daily
Price: ~$193.7
RSI: 42
ADX: 14
EMA10: $200.4
EMA20: $201.1
EMA50: $199.0
EMA100: $194.5
EMA200: $185.1
FANG is currently trading below its short- and medium-term moving averages and almost directly around the 100-day EMA.
Daily momentum remains weak and MACD is still bearish.
However, the stock is approaching an important higher-timeframe support area rather than trading into resistance.
4H
RSI: ~38
EMA10: $199.3
EMA20: $201.0
EMA50: $201.1
EMA100: $199.1
EMA200: $194.4
VWMA: ~$197.4
The 4H chart is oversold relative to the recent range and is currently testing approximately the 4H EMA200 around $194.
This makes $191–194 an important decision zone.
Levels I'm watching
Support
$191–194 — current support / 4H EMA200 region
$185–187 — major support / daily EMA200 region
$178–182 — deeper correction area
Resistance
$197–200 — first recovery zone
$201–203 — major moving-average cluster
$210–213 — previous structure / stronger resistance
Bullish scenario
The setup becomes much more convincing if FANG can absorb the recent block-sale pressure and reclaim:
$198–200
A move back above the $201–203 moving-average cluster would be stronger confirmation that the correction is ending.
From there I would watch:
$210–213
followed by a potential continuation toward the previous highs if crude remains elevated.
Bearish / invalidation scenario
The biggest risk is a rapid normalization in the Middle East.
If Hormuz shipping returns toward normal, damaged infrastructure is restored and crude falls materially below the current $100 region, part of the geopolitical premium supporting energy equities could disappear quickly.
Technically, a decisive loss of:
$185
would also weaken this setup substantially because that would put FANG below its daily 200 EMA.
Below that, $178–182 becomes the next major area I'd watch.
Thesis
I view the current weakness in FANG as a combination of:
large shareholder selling + short-term crude volatility
rather than evidence that Diamondback's underlying business has deteriorated.
With crude still around $100, Hormuz disruption unresolved, strong free cash flow and FANG trading close to important higher-timeframe support, I think the current $190s area is worth watching for a medium-term bullish reversal.
I would prefer either:
$191–194 holding and forming a reversal
or
a confirmed reclaim of $198–200
rather than chasing before buyers show that the recent supply has been absorbed.
Bias: Bullish medium term
Key support: $191–194 / $185–187
Confirmation: $198–200 then $201–203
Upside area: $210–213+
Main risk: Middle East de-escalation and a substantial decline in crude prices.  Long
Long
 Short
Short
 Long
Long
 Short
Short
ONON | Brand Momentum Meets Major Support and Bullish Divergence
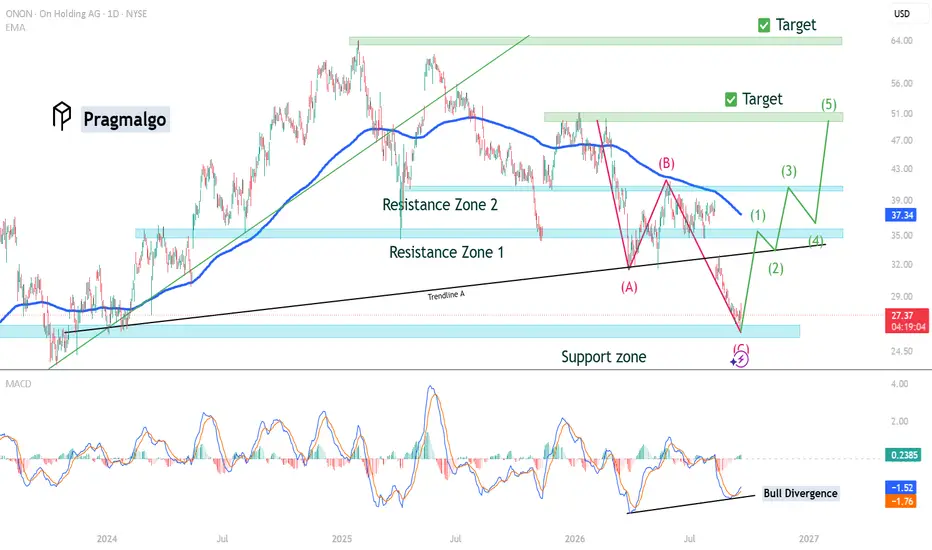
# ONON (NYSE: ONON) 1D: Brand Momentum Meets Major Support and Bullish Divergence
Kylian Mbappé officially parted ways with Nike to sign a landmark partnership as the new global face of On Holding. Locking in an athlete of this stature marks an aggressive commercial push, injecting strong brand visibility and institutional interest into the company right as valuation trades back toward baseline levels.
Price action is currently reacting off the Support Zone around $25.50 , with the daily candle printing around $27.41 . Momentum is shifting. Down on the indicator panel, the MACD is printing a distinct, sustained bullish divergence , where price formed lower lows while momentum carved higher lows. This setup provides solid short-term backing for an upward push.
Overhead conditions remain crowded. To sustain a broader recovery toward structural targets, price must cut through four clear supply hurdles: the broken Trendline A , the descending 200 EMA hovering at $37.34 , and two primary overhead blocks at Resistance Zone 1 (~ $35.00 ) and Resistance Zone 2 (~ $40.00 ).
The operating thesis focuses on building long exposure, defining risk strictly below the most recent swing low at support.
Initial expansion targets a mean reversion into the 200 EMA alongside a backtest of Trendline A , mapping out wave (1). A decisive break of this zone places price right at the doorstep of Resistance Zone 1 . Expect friction there. A corrective pullback—wave (2)—back toward Trendline A would offer a clean continuation structure. As this unfolds, the sloping 200 EMA should gradually flatten and slip beneath price action, transitioning into dynamic support where buyers can establish solid footing. From that launchpad, the next leg higher can drive straight into Resistance Zone 2 , eventually clearing path toward the primary Target at $51.00 and the extended swing objective at $64.00 .  Long
Long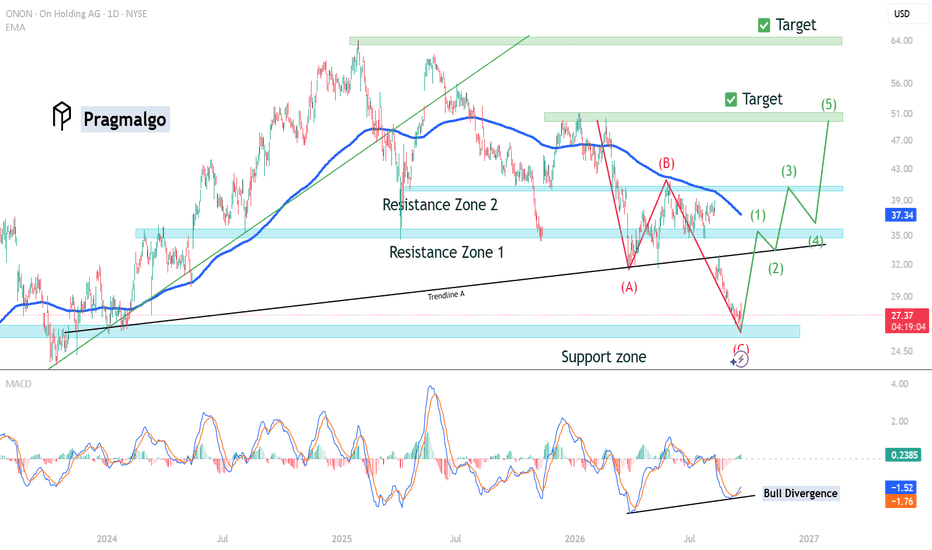
 Long
Long
NVDA Post-FOMC Setup
NASDAQ:NVDA Post-FOMC Setup
I’m short-term leaning long here, but only as a light trial after confirmation.
I’m watching for a 1H pullback toward 219.80 instead of chasing the move higher.
My levels:
Entry: 219.80
Invalidation: 218.92
T1: 222.47
The setup gives around 3:1 R, but I’m not calling it fully confirmed yet. Lower timeframes are still mixed, so I want price to prove the setup first.
Why NVDA?
After FOMC, I checked Stocks, CFDs, and Crypto, and NVDA is giving me one of the cleaner structures to work with.
On the 15M, price is still choppy around the 219.35–220.23 volume and average cluster. RSI is at 44.35 and MACD is slightly bearish, so I’m not rushing the entry.
The 1H is a little more interesting. Price is repairing above the rising 60 and 120-period averages, although the 20-period is turning down.
The 4H bottom structure remains confirmed above 216.99, while the daily is still more in a turning phase than a clean trend.
Confirmation I want:
→ Hold the 219.80 area
→ Reclaim 222.47 with momentum
→ Keep the 1H structure intact
If price breaks below 218.92, the long idea is invalid.
A break below 219.30 would also weaken the 1H structure, but I wouldn’t automatically flip short. I’d rather wait for a fresh bearish setup.
The bigger risk here is the post-FOMC volatility. Higher yields can pressure high-duration tech, and expiration-related flows can create false breakouts and sharp reversals.
Positioning is mixed too. 24H open interest dropped 6.98%, while 7D OI increased 12.98%. Funding is 0.0288 versus a 7D average of 0.012607, so I’m definitely not treating the current move as a guaranteed continuation.
For me, the trade needs to come from price action, not the headline.
I’ll be adding any trade taken from this setup to my KCGI TradingView journal.
I like watching NASDAQ:NVDA on Bitget because I can keep Stocks, CFDs, and Crypto on one platform, with 24/7 TradFi Perps for the trade management.
No chase. If the level confirms, I trade it. If not, I wait.  Long
Long