• Products
  • Community
  • Markets
  • Brokers
  • More
Get started
  • Markets
  • /World stocks
  • /Ideas
$AAPL — Sometimes Even the Best Companies Aren't Safe🍎 NASDAQ:AAPL — Sometimes Even the Best Companies Aren't Safe It doesn't matter how good a company is. When markets get into trouble, investors often sell their best holdings to cover their worst ones. And Apple may be setting up for exactly that scenario. 1. Rising Wedge — A Technical Top? NASDAQ:AAPL has been climbing within a narrowing rising wedge on the daily chart, with price now approaching the upper boundary near $350. Rising wedges are typically bearish formations, particul
NASDAQ:AAPLShort
by quickshiftinn
Updated
1
MRVL: $5.1M in Dec Puts as a 3-Day Slide Tags the 200-DayMRVL is down about 26% in three sessions, from a 251.65 close on Oct 28 to the 200-day SMA, and the biggest new options print is in puts. OPTIONS FLOW (Nov 2, GTA Wire, 10:20 AM ET) - Dec 18 $145 puts: 12,925 contracts vs 1,345 OI (9.6x), about $5.1M - Dec 17 2027 $120 puts: 1,500 vs 265 OI, about $1.9M - Nov 6 $180 puts: 2,180 vs 1,695 OI, about $1.2M - Apr 16 2027 $290 calls: 1,384 vs 89 OI, about $1.1M - Nov 6 $190 calls: 1,696 vs 188 OI, about $797K TECHNICALS (Daily) - Price near 184-186,
NASDAQ:MRVLShort
by GTA-TERMINAL
Updated
SLS: 94% Call Flow as Price Sits on the 200-Day After a 30% DropSLS fell from 12.17 to 8.55 in four sessions, and 94% of today's options premium is in calls as price sits on the 200-day. OPTIONS FLOW (Nov 3, GTA Wire, 10:33 AM ET) - $420K premium: $394K calls, $26K puts (94% calls / 6% puts) - Put/call volume ratio 0.17 DARK POOLS (off-exchange share) Oct 27: 48.9% | Oct 28: 50.1% | Oct 29: 48.7% | Oct 30: 48.3% | Nov 2: 46.8% TECHNICALS (Daily) - Price near 8.90: below the 20-day (11.03), 100-day (11.87) and 50-day (11.91), just above the 200-day (8.62)
NASDAQ:SLSLong
by GTA-TERMINAL
EQH: Clear Beginner-Friendly Setup Along the 50 SMA💡 Swing setup idea 50 SMA Strategy 🔎 Analysis summary: Small ATR stock — a clear trade for beginners. We can see the stock continuing to rise along the 50-day moving average and reaching resistance. We can also see a closing of a big cup and buyers volume stepping in. This alignment of trend, pattern and volume makes the breakout area key to watch. The upside potential is projected by the depth of the cup from the breakout point. 👀 Levels to watch: Entry trigger: Break above $56.00 Targe
NYSE:EQHLong
by Kochva_
Shopify gaps -13% but buyers defend the open near 136Shopify opened at 136.4 today after its earnings report, a gap of about 13% below yesterday's close of 156.2. The low so far is 135.7, and price has since recovered to around 141.5, still roughly 9% lower on the day. What the daily chart shows: • An open gap from 143.5 to 153.3. Nothing has traded in that zone today, so it is the first area to watch on any rebound. • Today's move cut straight through the 50-day MA (~152.8). • The 200-day MA (~129.8) sits just below today's low, and the Septembe
NASDAQ:SHOP
by Forexupgo
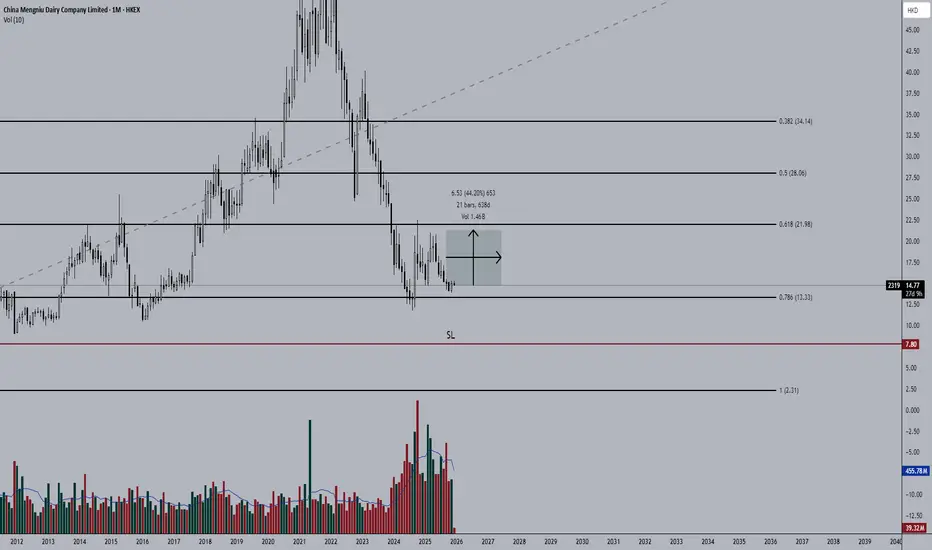
MengniuSuch a deep pullback into a key zone, especially on a higher timeframe, strongly suggests a very probable price increase ahead. I estimate around 40% upside. The scale of Yili and Mengniu (the duopoly) gives them superior access to capital markets at significantly lower financing costs. Moreover, their purchasing volume allows them to negotiate preferential prices for key inputs, such as livestock feed. This lower cost structure means the duopoly’s breakeven threshold is much lower than that of
HKEX:2319Long
by OldWave96
Updated
Palantir: buyers showed up, but the chart hasn’t called a trucePalantir is down 4.34% on the day, yet the daily candle tells a more nuanced story: after trading as low as $165.25, buyers pushed the price back to $170.60, above the $168.18 open. A small intraday comeback—though the bulls haven’t exactly won the war. For now, this looks like a rebound attempt, not a confirmed reversal. The next daily candles will matter: can buyers defend the intraday recovery and build on it, or will sellers take control again? With PLTR, volatility is never far away. The
NASDAQ:PLTRShort
by DL_INVEST
$BETA: Ready to Take Flight?BETA is an aerospace and defense company that designs, manufactures, and sells high-performance electric aircraft, advanced electric propulsion systems, components, and charging systems to leading operators worldwide. Its ALIA aircraft family includes a conventional fixed-wing electric aircraft (the “ALIA CTOL”) and an electric vertical takeoff and landing aircraft (the “ALIA VTOL”). In Today’s News: BETA Technologies, Inc. concluded five days of flight operations in Utah, demonstrating how e
NYSE:BETALong
by Brent_Calver
Updated
5
Once Upon a Farm (OFRM)Once Upon a Farm (OFRM): Retail Expansion and Operating Leverage Support Growth Once Upon a Farm (NYSE: OFRM) produces organic baby and children’s foods, including refrigerated purées and snacks. Latest completed close: $9.44 12-month price target: $24.50 Potential upside: ~159.5% Rating: Buy The investment case centers on expanding retail placement, a broader product lineup, and improving profitability. Baby food has become an increasingly important part of the business, accounting for
NYSE:OFRMLong
by FreedomHolding
AAPL ▼ SHORT · Memory cost hangover 325.5 / 329 → 320 / 318▸ WHY: beat on numbers but the new CEO called memory costs "unprecedented" and said Mac/iPad stay supply constrained through the December quarter. -4% premarket, I don't trust a bounce here ▸ LEVELS: 338.3 Monday close · 321 premarket low · 334 Oct 30 low ▸ PLAN A: short 325.5 premarket, adding 329 if it pops into the open ▸ PLAN B: if it loses 321 premarket low with volume, 320 comes fast 🎯 T1 320 · T2 318 ✕ STOP 331 ⚠ RISKS: election day, JOLTS at 10:00. intraday only, flat by the close N
NASDAQ:AAPLShort
by Momentum_trade
Updated
PLTR ▼ SHORT · Beat & raise, still sold 164 / 168 → 160 / 157▸ WHY: beat and raised again, Q4 guide way above street, and it's still -8% premarket. market is selling the valuation, not the numbers. I'd rather fade bounces than catch this ▸ LEVELS: 178.3 Monday close · 162 premarket low · 168 bounce zone ▸ PLAN A: short 164 premarket, adding 168 if it squeezes after the open ▸ PLAN B: under 162 premarket low, 160 then 157 🎯 T1 160 · T2 157 ✕ STOP 171 ⚠ RISKS: election day, JOLTS at 10:00, high beta both ways. intraday only, flat by the close Not finan
NASDAQ:PLTRShort
by Momentum_trade
Updated
NBIS | Put Option Trade IdeaNBIS | Put Option Trade Idea NBIS broke decisively below the $153 level and closed beneath it. This was a strong swing level, and we now expect it to act as Supply. Price has also broken below its higher timeframe ascending trendline and closed beneath it. If price retests the $153 Supply Level and faces a strong rejection, we can look for a Put options opportunity on the daily timeframe. Trigger: Price must retest the $153 Supply Level and show a strong bearish rejection. Target 1: $133 Ta
NASDAQ:NBISShort
by UA_CAPITAL
AMD 4H : OB at 440.6 Is the Only Level That Matters TonightAMD’s 4H structure is clearly bearish. The weak high at 658.6 was followed by a change of character near 600 and then a bearish break of structure around 503. Price is roughly 28% below that high and, in pre-market, sits near 474 under the supply zone at 481-492 (which also contains the 0.786 retracement at 488.57) and just above the demand zone at 440.6-460. That demand aligns with the prior higher low and is the only meaningful support on this timeframe. Why now Earnings are due after the
NASDAQ:AMDLong
by CryptoBourse_
TSLA | Rally Into The Flip Zone, Liquidity BelowTesla's trend is down. The move that carried price back to $401.90 did not change that — it delivered price to the zone where the sellers are. ━━━━━━━━━━━━━━━━━━━━ THE STRUCTURE ━━━━━━━━━━━━━━━━━━━━ The larger trend has been bearish since February, with a series of BOS to the downside. A temporary bullish phase formed through April and May, and it ended the way these phases end: with a CHoCH that broke the uptrend's structure, followed by a sharp decline through July. What has happe
NASDAQ:TSLA
by BigBeluga
4
AMD Minimum correction to $390. Possible even lower.Advanced Micro Devices (AMD) has been trading within a 10-year Channel Up and in the past 30 days it has been correcting aggressively after almost making a Higher High at the top of the pattern. This is fast approaching the 1W MA50 (blue trend-line), which is the market's first long-term Support. The historic price action within this Channel Up has shown that the market corrects from -41.76% to -66.70% when such pull-back patterns occur. In act, the 1W RSI has printed a similar Lower Highs Bear
NASDAQ:AMDShort
by TradingShot
1
AMZN – Key Support Bounce & Potential Bullish Breakout🔹 AMZN (Amazon) is showing a prolonged bearish market structure, with a descending trendline defining the broader downside pressure since August. Recent price action has tested the key support zone around 225–232, where buyers have stepped in and triggered a noticeable recovery toward 245.61. This rebound suggests a possible shift in short-term momentum, although price still faces resistance around 250–260. The broader structure remains cautious until buyers establish a stronger breakout above t
NASDAQ:AMZNLong
by XAUApex
Updated
8
Symmetrical Triangle Breakdown Bearish Liquidity Target in Focus🔹 The chart shows a clear symmetrical consolidation pattern developing between descending resistance and rising support, with price previously respecting both trendlines. However, the recent bearish breakdown below ascending support suggests a potential shift in market structure from consolidation to bearish momentum. Price is currently trading around 838, while the previous resistance zone near 1,060–1,100 remains an important supply area. The breakdown indicates increasing selling pressure, br
NASDAQ:MUShort
by XAUApex
Updated
1
NFLX Breakdown: Bearish Trend Targets $50 Liquidity Zone🔹 NFLX (Netflix) is showing a clear bearish market structure following a breakdown from the previous rising channel. Price has continued forming lower highs and lower lows, indicating persistent selling pressure. The descending trendline remains an important dynamic resistance, while the 70–72 region represents a key horizontal resistance zone. Currently trading near 62.37, NFLX appears to be consolidating near recent lows, suggesting that sellers remain in control of the broader price action. T
NASDAQ:NFLXShort
by XAUApex
Updated
3
AAPL Dropped $14 on Earnings: CALLS or PUTS? AAPL Dropped $14 on Earnings: CALLS or PUTS? (Tue 11/3) Apple reported earnings last night, and the market didn't like what it heard. AAPL is down about 4% before the bell, around $324, after closing Monday at $338.32. The big worry was Apple's profit-margin outlook for next quarter. Here's the twist: the rest of tech is green this morning. QQQ is up a little and chip stocks are up about 2%. So this one is Apple's own problem, not the whole market. It's also Election Day, which can make price
NASDAQ:AAPL
by tmac1914
3
AAPL Holds Rising Trendline – Is 375 the Next Liquidity Target?🔹 AAPL continues to maintain a broader bullish market structure, supported by a rising trendline that has provided multiple reactions since June. Price recently faced rejection near the 350 resistance area and has started a short-term pullback toward the ascending trendline around 339.06. Previous reactions from this dynamic support suggest that buyers have been defending the upward structure. Meanwhile, the 322–325 region represents an important horizontal support zone, while the 375–376 area r
NASDAQ:AAPLLong
by XAUApex
Updated
1
BAJAJ-AUTO (1D) – Crossed above EMA 200; 3 candles insideBAJAJ-AUTO on the daily chart: what ScanSutra's scanners found. What the chart shows Crossed above EMA 200 (Average, 1D 3 Nov). Crossed above EMA 200 on the 3 Nov 2026 candle (the last closed one). Other averages against that close: EMA 21 0.89% below; EMA 20 1.00% below; EMA 200 1.38% below; EMA 50 1.78% above; EMA 100 1.87% above. 3 candles inside (Inside bars, 1D 3 Nov). 3 candles inside it (within 0.1 ATR); judged on the 3 Nov 2026 candle. Trendlines at the low: 4 (best: rising, 2
NSE:BAJAJ_AUTO
by dgupta88
CEREBRAS SYSTEMS INC (CBRS:US)CEREBRAS SYSTEMS INC (CBRS:US) Cerebras possesses a unique and promising technology, with explosive revenue growth (over 70% year-over-year). Currently, however, the company is still burning through a significant amount of cash (negative free cash flow) and lacks net profit; furthermore, it is navigating a period of intense market pressure and high volatility following its recent IPO. It is an extremely interesting candidate to watch. The right moment for a larger purchase will arrive when
NASDAQ:CBRSLong
by SimeonNikolaev-invest
Greenlight Re ($GLRE): buying back stock below book valueGreenlight Capital Re, of Grand Cayman, provides multiline property and casualty insurance and reinsurance through licensed reinsurers in the Cayman Islands and Ireland and its Lloyd's syndicate. Much of its capital is invested in Solasglas Investments, a related-party fund, and its Innovations unit backs technology companies in insurance. On 2 November the company reported its third quarter. Net income was $3.2M, or $0.10 a diluted share, against a $4.4M loss a year earlier. The combined ratio
NASDAQ:GLRE
by LALC_Capital
PLTR: Short Term Pullback, Before BreakoutPalantir Technologies Inc. (PLTR) trades around $198.78, up about 2.40% to 3.0% on the day nearing its all time high. Goldman Sachs Upgraded PLTR from Neutral to Buy, citing strong positioning in sovereign AI and forecasting another phase of outperformance extending into 2027 with 18% projected upside. Technical View: PLTR is on bullish momentum move. The stock continues to ascend effortlessly after breaking above its previous resistance level at $144, in concern to the chart framework. Price i
NASDAQ:PLTRShort
by Blaisefxacademy
Updated
123456789101112131415161718192021222324252627282930313233343536373839404142
…999

Made by humans

Select market data provided by ICE Data Services. Select reference data provided by FactSet. Copyright © 2026 FactSet Research Systems Inc.Copyright © 2026, American Bankers Association. CUSIP Database provided by FactSet Research Systems Inc. All rights reserved. SEC filings and other documents provided by Quartr.© 2026 TradingView, Inc.

SOC 2 CompliantGDPR Compliant
More than a product
  • Supercharts
Screeners
  • Stocks
  • ETFs
  • Bonds
  • Crypto coins
  • CEX pairs
  • DEX pairs
  • Pine
Heatmaps
  • Stocks
  • ETFs
  • Crypto coins
Calendars
  • Economic
  • Earnings
  • Dividends
  • IPOs
More products
  • News Flow
  • Portfolios
  • Fundamental Graphs
  • Yield Curves
  • Options
  • Macro Maps
  • Pine Script®
  • MCP Server
Apps
  • Mobile
  • Desktop
Community
  • Social network
  • Wall of Love
  • Refer a friend
  • Creator program
  • House Rules
  • Moderators
Ideas
  • Trading
  • Education
  • Editors' picks
Pine Script
  • Indicators & strategies
  • Wizards
  • Freelancers
  • Marketplace
Tools & subscriptions
  • Features
  • Pricing
  • Market data
  • Gift plans
Trading
  • Overview
  • Brokers
  • Brokers comparison
  • The Leap
Special offers
  • CME Group futures
  • Eurex futures
  • US stocks bundle
About company
  • Who we are
  • Space mission
  • Blog
  • Help Center
  • Careers
  • Media kit
Merch
  • Tarot cards for traders
  • The C63 TradeTime
Policies & security
  • Terms of Use
  • Disclaimer
  • Privacy Policy
  • Cookies Policy
  • Accessibility Statement
  • Trust Center
  • Security tips
  • Bug Bounty program
  • Status page
Business solutions
  • Widgets
  • Charting libraries
  • Lightweight Charts™
  • Advanced Charts
  • Trading Platform
Growth opportunities
  • Advertising
  • Brokerage integration
  • Partner program
  • Education program
Community
  • Social network
  • Wall of Love
  • Refer a friend
  • Creator program
  • House Rules
  • Moderators
Ideas
  • Trading
  • Education
  • Editors' picks
Pine Script
  • Indicators & strategies
  • Wizards
  • Freelancers
  • Marketplace
Business solutions
  • Widgets
  • Charting libraries
  • Lightweight Charts™
  • Advanced Charts
  • Trading Platform
Growth opportunities
  • Advertising
  • Brokerage integration
  • Partner program
  • Education program
Look FirstLook First