I stand with bearish market for ADOBE📉 ADBE Bearish Structure — Deep Explanation
The major structure remains bearish:
ADBE first experienced a strong decline from the $350+ area toward ~$195, creating a clear impulsive bearish leg. After reaching the ~$195 region, price bounced strongly toward the $285–290 area.
However, this upward movement has not yet proven that the larger bearish trend has reversed.
Instead, it can be viewed as a retracement / corrective rally following the initial selloff.
The important observation is the reaction around $285–290.
Price rallied aggressively, but then encountered selling pressure and failed to establish a sustained breakout above the previous major resistance area. This creates the possibility that the rally was forming a lower high within the broader bearish structure.
🔻 Why the bearish scenario remains valid
A downtrend does not necessarily move straight down.
A typical bearish market structure can look like:
Lower High → Lower Low → Retracement → Lower High → Lower Low
Therefore, the recent upward movement should not automatically be interpreted as a trend reversal.
The move from approximately $195 → $290 may simply represent a retracement designed to:
recover part of the previous decline,
test resistance,
attract buyers,
create liquidity above short-term highs,
and potentially provide the next area for sellers to enter.
If price continues to reject the $285–306 resistance zone, the bearish thesis remains intact.
🎯 Your marked setup
Your chart is essentially expressing this scenario:
Previous decline:
$350+ → ~$195
Retracement:
~$195 → ~$290
Potential rejection:
~$290 → current ~$252
Bearish continuation:
$252 → $220 → $200 → potentially ~$184
The $306.30 level you've marked is particularly important because a strong move above that region would significantly weaken the idea that ~$290 was a lower high.
Your projected $183.87 target is therefore not saying price must reach $184. It represents the next major bearish objective if the market confirms continuation and breaks the lower support zones.
🔥 The important distinction
Bullish movement ≠ bullish trend reversal.
A market can rise substantially while still remaining bearish on the higher timeframe.
For ADBE, the question is not:
"Did price go up?"
It clearly did.
The more important question is:
"Did price break the bearish structure and establish a new higher high?"
Until that happens, the recovery can reasonably be classified as a retracement within the larger bearish structure.
Confirmation to watch
For the bearish scenario to strengthen:
1. Rejection around $285–306
↓
2. Failure to reclaim the previous high
↓
3. Price breaks below ~$240–230
↓
4. Break below ~$200 / previous swing low
↓
5. Potential continuation toward ~$184
If price instead breaks and holds above ~$306, the bearish thesis becomes considerably weaker and the idea of the ~$290 lower high would need to be reassessed.
The recent upward movement from ~$195 toward ~$290 should not automatically be interpreted as a bullish trend reversal. On the higher timeframe, it can be viewed as a retracement following the previous major bearish impulse from the ~$350+ region.
Price rallied into the ~$285–290 resistance area but failed to establish a sustained breakout and subsequently rejected lower. This creates the possibility that the rally was a corrective retracement forming a lower high within the broader bearish structure.
A bearish trend does not need to move straight down. The market can retrace upward before continuing lower. Therefore, the current recovery may simply be a retracement/liquidity-building phase before another bearish leg.
Bearish thesis remains valid while price fails to reclaim the ~$306 resistance/invalidation area.
If sellers regain control and price breaks the lower support zones, the market could continue toward previous lows and potentially the ~$184 area.
Key idea: Retracement ≠ reversal. A sustained break above ~$306 would weaken this bearish thesis; rejection and continuation lower would strengthen it.
Personal technical view only — not financial advice.  Short
Short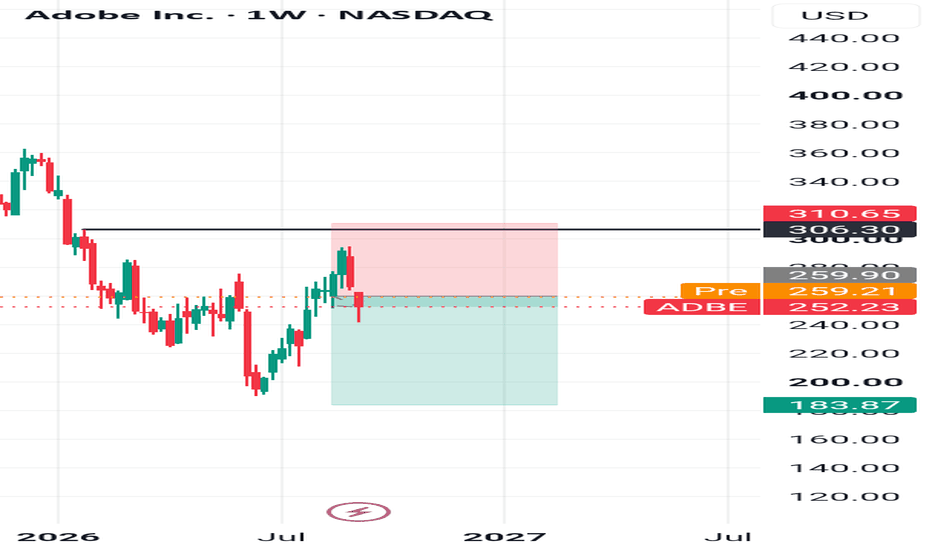
Short 
 Long
Long
 Short
Short

VELO | Flip Zone Holds, Two Pools AboveBy analyzing the #VELO (Velo3D, Inc.) chart on the 2H timeframe, we can see a market that spent June and July grinding lower inside a clean descending channel, broke out of it, and is now pressing back into the first area that decides whether the breakout was real.
2H Timeframe
The June to late July leg was one-directional: four consecutive BOS lower, every swing low taken out, price contained inside the descending channel the entire way down. The turn came in late July with a CHoCH at $10.49 — the first upside break of structure in the whole move — followed by a BOS at $15.00 that confirmed it and carried price to $17.62 .
What followed was the correction, not a new downtrend. From $17.62 price has drifted lower under a descending trendline since mid-August, printing lower highs into the same zone it originally broke out of. That zone is the Flip Zone at $9.65 – $10.49 — old resistance, now the first demand being retested. Price sits at $9.99 , inside it.
Above, the liquidity is stacked: the MSS level at $12.21 sits directly beneath the descending trendline, and the resting liquidity at $17.62 is the origin high that has never been revisited.
The Bias
Bullish while the Flip Zone holds, neutral the moment it does not.
Scenario A — the base case.
Price reacts out of the Flip Zone ($9.65 – $10.49) , reclaims the descending trendline , and the confirmation is a 2H close above $12.21 . That close breaks the MSS level and the trendline in the same move, which is the structural green light. Target is the resting liquidity at $17.62 .
Scenario B — the deeper sweep.
Price wicks beneath the Flip Zone to take the liquidity under $9.65 , then closes back inside. Same destination, better entry — but it still requires the $12.21 close to confirm. Nothing changes about the objective, only the price at which the position gets built.
Invalidation. A 2H close below $9.65 with no reclaim. At that point the Flip Zone has failed as demand and the entire breakout structure from late July is back in question.
And the rule that governs all of it: a break is a candle close, not a wick. The $12.21 level is exactly where a wick through the trendline will look like a breakout and close back beneath it — the MSS level and the descending trendline intersecting in the same area is where stops cluster, and clustered stops are what wicks are built from.
Fundamental Backdrop
The operating numbers have turned. Q2 2026 revenue came in at $20.7M, up 52.3% year over year , with gross margin at 21.5% — up from 7.5% in Q1 2025 . Management raised full-year guidance to $65M – $75M and is guiding gross margin above 30% in H2 2026 alongside positive EBITDA. Debt was cut roughly 70% to about $9M after a $15M debt-to-equity conversion, and the new 289,000 sq ft Livermore Production Campus is built to triple capacity. Inclusion in the Russell 3000 in June added a passive bid.
The other side is real. The company is still unprofitable — net loss of $51.59M on trailing revenue of $57.56M — and cash fell to $16.6M as of March 31, 2026 from $39.0M at year-end, against planned capex of $40M – $50M . That is a funding gap that likely gets closed with dilution, and the stock is up over 400% on market cap, meaning a great deal of the turnaround is already priced.
Which is why the structure matters more than the story here. The fundamentals justify why buyers defend the Flip Zone. They do not justify buying before $12.21 closes.
This analysis will be updated as the market evolves.
Best Regards, BigBeluga 🐳 Mercedes-Benz — Bullish SetupMercedes-Benz is currently presenting a positive market outlook, with the recent price behavior indicating that the buy side is gaining importance. The stock is developing within a constructive environment where upward progress remains the preferred scenario.
The latest market movement suggests that buyers are showing increasing confidence, allowing price to maintain a favorable position and potentially continue advancing. While short-term fluctuations are always possible, the broader analytical view remains focused on the potential for further appreciation.
This trade idea is based on the developing relationship between market direction and price behavior rather than relying solely on one specific level. The aim is to remain positioned with the prevailing positive structure and allow the market to reveal the next phase of its upward movement.
Mercedes-Benz operates within an industry where investor sentiment can be influenced by vehicle demand, luxury-car sales, global economic conditions, supply-chain developments, electric-vehicle competition, currency movements, and broader European market performance. These factors may affect volatility, but the current technical picture continues to support a buy-side perspective.
The projected scenario can be viewed as:
Current positive formation → sustained buying interest → continued market progress → potential higher valuations.
📍 Market Bias: Bullish
📈 Trade Direction: Buy
🚀 Market Outlook: Positive
⚡ Focus: Upward continuation
🎯 Approach: Following the developing bullish structure
The key focus remains on the strength of the broader market picture. As long as the positive conditions continue to develop, Mercedes-Benz has the potential to extend its movement toward higher territory.
A defined outlook, a disciplined approach, and a market structure that continues to keep the buying side in focus. 📈🔥  Long
Long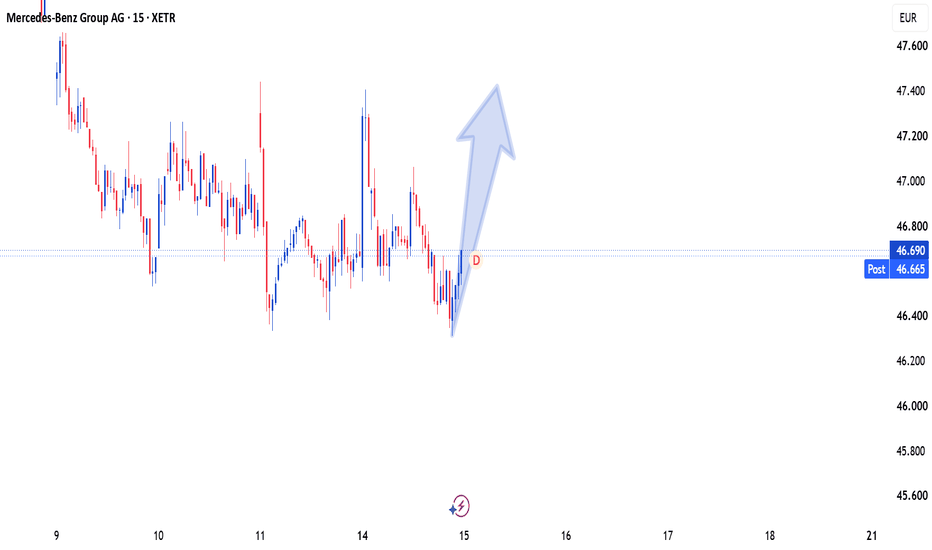
NVDA Has Printed Its Third Double TopNVDA Has Printed Its Third Double Top
NVDA has made three double tops (yellow) in three years. The first two ended the same way. Price lost the blue activation line, and a drop followed.
Now we have the third one. And this is BIGGER.
A double top is simple. Buyers push price up to a level, they fail, they rest, and they try again at the same level. They fail again. Two attempts, same wall.
That tells you the buyers are getting tired.
One pattern on one stock does not make a market top. Agreed. On its own, this chart means little. So let me show you more.
The divergence
In my last ideas I showed the divergence in the SPCFD:SPX and in Emerging Markets. Price made new highs, but the internals did not follow. Fewer stocks are carrying the index. That is the same tiredness, seen from above.
Where the money goes
When risk gets tired, money does not disappear. It moves.
Today bonds pay a real return, something we had forgotten for years. A calm 4% or 5% looks very good next to a stock that just failed twice at the same price. And bonds have a second gift. If a crisis comes and central banks cut rates, bond prices go up. Money leaves risk and goes to quality.
That is the normal cycle, and it can last a long time.
For a long time, we all forgot about bonds and fixed income, but at zero rates it was useless. Now, with real rates positive and the markets overheated, bonds are becoming the place to be for the smart guys.
The chart
The blue line is the low between the two tops. It is not a target. It is the level where the pattern becomes real. Above it, this is just two failed attempts. Below it, the last two times, the drop was hard. Below that, the dotted line near $155 is the first zone with real volume and the previous tops.
And you?
Serious correction, or just one more pause before the rally continues?
 Short
Short
 Long
Long
Tesla May Face ResistanceTesla bounced in August, but some traders may think the EV giant faces resistance.
The first pattern on today’s chart is the weekly low of $368.60 on June 26. TSLA held that level before its July 22 earnings report, but fell through it after the numbers hit. The stock has returned to stall at the same price zone, which could mean that old support is becoming new resistance.
Second, the 50-day simple moving average (SMA) is below the 200-day SMA. That may suggest a longer-term downtrend has begun.
Third, the falling 50-day SMA may be consistent with intermediate-term weakness.
Fourth, stochastics are dipping from an overbought condition.
Next, traders may eye the price zone between TSLA’s 52-week low of $297.38 and its 2025 low of $214.25 for potential probing.
Finally, TSLA is a highly active underlier in the options market. (Its average daily volume of 2.7 million contracts ranks second in the S&P 500 behind Nvidia, according to TradeStation data.) That could help traders take positions with calls and puts.
TradeStation has, for decades, advanced the trading industry, providing access to stocks, options and futures. If you're born to trade, we could be for you. Learn more here about TradingView’s Broker of the Year!
Past performance, whether actual or indicated by historical tests of strategies, is no guarantee of future performance or success. There is a possibility that you may sustain a loss equal to or greater than your entire investment regardless of which asset class you trade (equities, options or futures); therefore, you should not invest or risk money that you cannot afford to lose. Online trading is not suitable for all investors. View the document titled Characteristics and Risks of Standardized Options at www.TradeStation.com . Before trading any asset class, customers must read the relevant risk disclosure statements on www.TradeStation.com . System access and trade placement and execution may be delayed or fail due to market volatility and volume, quote delays, system and software errors, Internet traffic, outages and other factors.
Securities and futures trading is offered to self-directed customers by TradeStation Securities, Inc., a broker-dealer registered with the Securities and Exchange Commission and a futures commission merchant licensed with the Commodity Futures Trading Commission). TradeStation Securities is a member of the Financial Industry Regulatory Authority, the National Futures Association, and a number of exchanges.
Options trading is not suitable for all investors. Your TradeStation Securities’ account application to trade options will be considered and approved or disapproved based on all relevant factors, including your trading experience. See www.TradeStation.com . Visit www.TradeStation.com for full details on the costs and fees associated with options.
Margin trading involves risks, and it is important that you fully understand those risks before trading on margin. The Margin Disclosure Statement outlines many of those risks, including that you can lose more funds than you deposit in your margin account; your brokerage firm can force the sale of securities in your account; your brokerage firm can sell your securities without contacting you; and you are not entitled to an extension of time on a margin call. Review the Margin Disclosure Statement at www.TradeStation.com .
TradeStation Securities, Inc. and TradeStation Technologies, Inc. are each wholly owned subsidiaries of TradeStation Group, Inc., both operating, and providing products and services, under the TradeStation brand and trademark. When applying for, or purchasing, accounts, subscriptions, products and services, it is important that you know which company you will be dealing with. Visit www.TradeStation.com for further important information explaining what this means. Three-Wave Decline Into Accumulation — Major Bottom Developing?Good Afternoon,
Hope all is well. Here is my TA on RPD!
What I’m Seeing
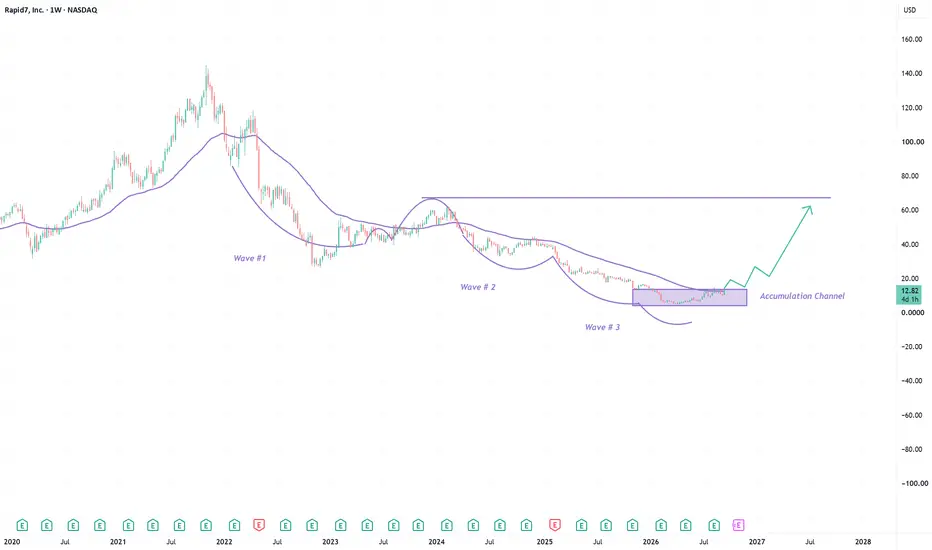
Looking at Rapid7 on the weekly chart, this is one of the cleaner potential bottoming structures you've posted recently.
The long-term trend is still bearish. RPD collapsed from roughly $140 at its 2021 peak to single digits in 2026, so I don't want to mistake one strong week for a completed reversal.
But the character of the decline has changed.
I've essentially got three major waves lower:
Wave #1 → stabilization → Wave #2 → stabilization → Wave #3 → accumulation
Each successive wave has brought price lower, but the third decline appears to have lost much of the momentum seen earlier in the bear market.
Now price has spent months building a base around approximately $5–$13, and this week's move to roughly $12.80 (+24%) is beginning to test the upper boundary.
To me, this could be the transition from:
markdown → capitulation → accumulation → early expansion.
The accumulation thesis is interesting. The reversal itself still needs confirmation.
The Three-Wave Structure
The larger structure is what catches my attention first.
Wave #1 took RPD from the $100+ area toward roughly $30.
Wave #2 eventually pushed the stock from around $60 into the $20s.
Wave #3 then took price into the single digits.
What matters to me isn't whether these are textbook Elliott waves. I'm using them primarily to visualize the progressive exhaustion of the downtrend.
The first decline was violent.
The second produced another major markdown.
The third pushed price to its lowest level, but eventually produced a much tighter and more controlled structure near the lows.
That's usually where I start looking for evidence that sellers are losing control.
The Accumulation Channel
The most important area on this chart is the rectangle you've marked from roughly $5–$13.
Rapid7 spent much of 2026 inside this range.
Instead of continuing immediately toward zero, price began moving sideways.
That's important because after a multi-year downtrend, time itself can become part of the bottoming process.
Weak holders exit.
Selling pressure gets absorbed.
Volatility compresses.
Eventually, price reaches a point where additional bad news struggles to create substantially lower prices.
That's the behavior I'm interested in here.
I wouldn't automatically call this institutional accumulation just from the chart, but it is a credible accumulation candidate.
This Week's +24% Move Matters
The current weekly candle is significant.
RPD opened around $10.62 and has traded as high as approximately $12.85, putting price directly against the top of the accumulation range.
This is exactly where I want to see buyers become aggressive.
But I'm not interested in simply chasing a 24% weekly candle.
The important question is:
Can Rapid7 leave the range and stay out of it?
That's the difference between a temporary squeeze and an actual change in market structure.
The First Breakout Area: $13–$15
Approximately $13–$15 is my first important confirmation zone.
RPD has spent months trading underneath this area, and the declining weekly trend/average is also converging nearby.
That creates confluence.
If price can break through this region with expanding participation, I'd consider that the first legitimate evidence that the accumulation phase is ending.
But the pullback afterward would be even more important.
My ideal sequence is:
$5–$13 accumulation → $13–$15 breakout → pullback → former resistance holds → higher low → expansion.
That's what would make me considerably more bullish.
The Weekly Trend Needs to Flip
The declining weekly trend line/average has controlled RPD throughout essentially this entire bear market.
Price has repeatedly rallied into it and failed.
So I don't want to ignore it simply because the stock has had one strong week.
A sustained move above that declining trend would tell me something fundamental about market structure has changed:
sellers are no longer able to defend the trend.
If RPD breaks above it and then successfully uses it as support, I'd start treating the move as an emerging new trend rather than just another bear-market rally.
What I Would Watch Above the Breakout
If $13–$15 breaks, I wouldn't immediately jump to the $60 target you've drawn.
There's a lot of trapped supply between here and there.
I'd think about it in stages.
My rough technical roadmap would be:
$13–$15 → $18–$20 → $25–$30 → $38–$42 → eventually $55–$65.
That final $60–$65 region is particularly important because it represents the major 2023–24 recovery high and a substantial previous supply area.
So I agree with the direction of your projected path, but I'd treat ~$60 as a long-term recovery objective conditional on an actual trend reversal, rather than an immediate price target.
Why $25–$30 Is Especially Important
If RPD eventually reaches the mid/high-$20s, I think that becomes a major test.
That's approximately where the previous breakdown accelerated and where the stock could encounter a large amount of overhead supply.
Getting there would already represent roughly a doubling from today's price.
If price reaches that region and then creates a higher low instead of collapsing back toward the accumulation range, I'd have much stronger evidence that this is a genuine new cycle.
Fundamentals — The Stock Is Bottoming Before the Business Has Returned to Growth
This is where Rapid7 becomes particularly interesting.
The fundamentals are not strong yet.
Q2 2026 revenue was approximately $210.9 million, down 1.5% year over year, while ARR declined 2% to $824 million. Management expects Q3 ARR of roughly $812 million, another 3% year-over-year decline, and full-year revenue of $837–$841 million, down approximately 2–3%.
So I can't build the bullish argument around current revenue growth.
There isn't any.
The market is potentially beginning to price something else:
stabilization and a future turnaround.
The Fundamental Deterioration Has Been Slowing
There's an interesting progression in the numbers.
Rapid7 ended 2025 with $840 million of ARR. That declined to $832 million in Q1 and then $824 million in Q2.
That's still contraction, so I'm not trying to make it sound bullish.
But this gives me a very clear fundamental indicator to watch alongside your technical accumulation channel.
If ARR starts stabilizing around these levels and eventually turns positive while the stock breaks out, the technical and fundamental theses would begin confirming each other.
That's what I'd want to see.
Profitability and Cash Flow Change the Risk Profile
This is probably the strongest part of the fundamental argument.
Rapid7 isn't an unprofitable cybersecurity company burning through its remaining cash while revenue collapses.
In Q2, it produced $3 million of GAAP operating income, $28.9 million of non-GAAP operating income and approximately $31.9 million of free cash flow.
The company also had approximately $702.6 million in cash, cash equivalents and government securities at quarter-end.
Management expects around $130 million of free cash flow for full-year 2026.
That matters enormously to me.
A company going through a revenue reset has much more time to repair itself when it's generating cash rather than consuming it.
Management Is Restructuring the Business
There's also been a major change in leadership and strategy.
Wael Mohamed became CEO in June, while longtime CEO Corey Thomas moved into the Executive Chairman role. Mohamed previously held senior leadership positions at Forescout and Trend Micro and was brought in with an explicit focus on operational execution.
Then in Q2, Rapid7 announced a restructuring affecting approximately 12% of its workforce.
Management is concentrating investment around two primary areas:
Detection & Response + Exposure Management, connected through its AI platform.
Fundamentally, that's important.
Rapid7 is essentially acknowledging that trying to do everything wasn't producing adequate growth.
The new strategy is about focus.
Now I need to see whether that focus actually improves execution.
AI Could Be a Catalyst — But I Want Revenue Proof
Rapid7 has also been aggressively repositioning itself around AI-powered security operations.
The company acquired Kenzo Security in March, bringing agentic AI technology into its security platform. Kenzo's technology is designed to automate security investigations and increase the percentage of alerts security teams can actually investigate.
Rapid7 has also expanded its Command Platform and launched Cyber GRC, connecting governance, risk and compliance workflows with live security-operations data.
The opportunity is real.
Cyber threats aren't disappearing. Rapid7's own recent research found a sharp increase in newly exploited vulnerabilities and much faster weaponization of vulnerabilities.
But I don't want to buy the stock simply because management says "AI."
I want to see:
product improvement → customer wins → ARR stabilization → ARR growth → operating leverage.
That's the fundamental sequence that would validate the story.
Customer Retention Is Important
Rapid7 still serves more than 11,500 customers, with approximately $70,000 of ARR per customer.
That existing customer base gives management something valuable to work with.
They don't need to rebuild the company from zero.
If the new leadership team can increase adoption across Detection & Response, Exposure Management, GRC and AI-driven security operations within that installed base, the revenue trajectory could improve without requiring an entirely new customer ecosystem.
That's why I see this more as a turnaround than a distressed-company survival trade.
Why This Setup Interests Me
The technical and fundamental pictures are beginning to line up in an interesting way.
Fundamentally:
Revenue contracting → ARR declining → restructuring → new CEO → strategic focus → strong cash position → positive free cash flow.
Technically:
Wave #1 down → Wave #2 down → Wave #3 down → selling exhaustion → prolonged base → breakout attempt.
That combination is exactly what I look for in a turnaround setup.
The business doesn't have to be perfect at the bottom.
In fact, it usually isn't.
The question is whether the rate of deterioration is beginning to improve before the market recognizes it.
My Bullish Scenario
My preferred sequence from here would be:
$5–$13 accumulation → $13–$15 breakout → controlled retest → higher low → $18–$20 → $25–$30.
If RPD can establish itself above $25–$30, then I think the larger recovery thesis becomes substantially more credible.
From there, $38–$42 would be another important supply zone.
Only after clearing those areas would I start taking the chart's larger $55–$65 objective seriously.
The important thing is that each rally creates a higher floor.
My Bearish Scenario
My invalidation is straightforward.
If this breakout attempt fails and RPD falls back into the accumulation range, I become more cautious.
If it subsequently loses roughly $7–$8, I'd assume the base needs more time.
A decisive breakdown beneath approximately $5–$6, especially with expanding volume and worsening fundamentals, would largely invalidate my current accumulation thesis.
That would tell me the market hasn't finished repricing the company.
My Bias
I'm cautiously bullish on Rapid7 here, but I view it as an early-stage turnaround setup rather than a confirmed long-term uptrend.
What I like is the combination of:
A three-wave multi-year decline
A prolonged base at depressed prices
Price beginning to challenge the top of that base
A declining weekly trend that's now within reach
Positive free cash flow despite declining revenue
More than $700 million of cash and government securities
New leadership and a more focused operating strategy
A large existing cybersecurity customer base
What I don't have yet is the most important confirmation: growth.
So for me, $5–$10 represents the established base, $13–$15 is the breakout test, $18–$20 is the first meaningful expansion zone, and $25–$30 is where I'd start believing the larger reversal has real strength.
If the chart breaks out while ARR simultaneously begins stabilizing, that's where this setup becomes much more compelling.
Until then, I'm treating the current +24% weekly move as the beginning of a possible change in character—not proof that the entire bear market is over.
Trade Safely
Enjoy  Long
Long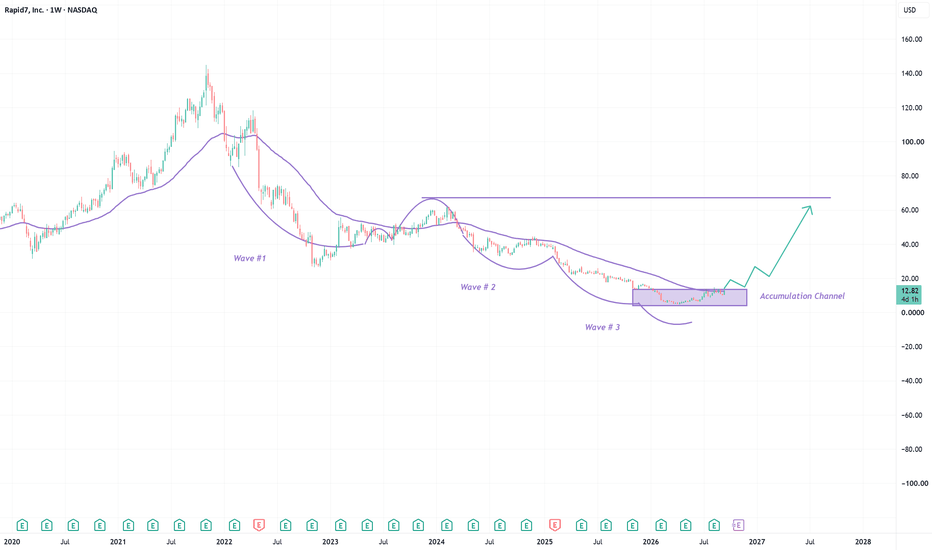
 Long
Long
 Short
Short
Deutsche Bank Aktiengesellschaft — Buy-Side Opportunity Deutsche Bank Aktiengesellschaft is currently presenting a promising bullish picture, with recent market behavior suggesting that the balance is gradually shifting in favor of buyers. The stock is showing encouraging signs of upward potential, and the broader outlook supports the possibility of further appreciation.
The current formation indicates that buying interest is becoming increasingly important within the market. Price has been holding its ground while the underlying structure continues to create opportunities for an upward extension. If this positive behavior remains in place, the stock could develop a stronger advance through the next phase of trading.
This setup is focused on the developing market environment rather than relying on a single price level. The objective is to follow the broader direction and remain aligned with the conditions supporting the buy-side scenario.
From a technical perspective, the current price action is beginning to favor higher valuations. Buyers appear to be gaining greater influence, while selling pressure has not shown enough strength to establish a meaningful shift toward the downside. This creates a constructive environment for the bullish thesis to continue developing.
Deutsche Bank's movement can also be affected by European banking-sector performance, interest-rate expectations, economic data from the Eurozone, credit-market developments, currency fluctuations, and wider investor sentiment. These factors may create volatility, but the present technical outlook remains focused on potential upside.
Projected scenario:
Current market formation → growing buyer participation → sustained upward development → further appreciation.
📍 Market Bias: Bullish
📈 Trade Direction: Buy
⚡ Market Condition: Constructive
🚀 Outlook: Potential for further upside
🎯 Focus: Buy-side continuation
The market is gradually creating a stronger case for the buyers, and Deutsche Bank Aktiengesellschaft remains positioned within a structure that could support further progress toward higher levels.  Long
Long
MU: 50-Day EMA Under Pressure After Trendline RejectionMicron’s daily chart is showing renewed weakness after its recent attempt to break above the descending resistance line. Price has slipped back beneath that trendline and is now trading below the 50-day EMA, putting the recent recovery under pressure.
The EMA remains gently upward-sloping but has flattened compared with the earlier advance. This suggests fading momentum and a consolidation phase. With the current daily candle still open, a confirmed breakdown requires a daily close below the average.
Bullish scenario: A recovery above the 50-day EMA, followed by a sustained breakout above descending resistance, would improve the structure. Clearing the recent September swing high would strengthen that signal and bring the major June high—the orange horizontal resistance—back into focus.
Bearish scenario: A daily close below the EMA followed by a failed reclaim would support further weakness. The August consolidation lows would become the first area to watch, followed by the deeper late-July trough if selling accelerates.
My view: Cautious in the short term. The recent breakout attempt appears to be failing, and the 50-day EMA is the immediate reference for buyers. A convincing reclaim would help restore momentum; continued rejection beneath it would favour a deeper pullback.
Based on the displayed daily chart on September 14, 2026, during the session. Educational analysis only.
Personally, I remain cautious on the stock. I believe prudence is warranted, especially in light of the latest developments over the weekend involving Claude and ChatGPT.
Disclaimer: This publication is for informational and educational purposes only and does not constitute financial or investment advice. The views expressed are my personal opinion. Please conduct your own research and consider your own risk tolerance before making any investment decision.
Laurent - Private Investor
✅ DL INVEST | Community Leader
SNDK: Trend Breakout, Bearish PersistsSanDisk Corporation (SNDK) is trading around $1,574 dropping 3.81%. The decline was triggered by a broader, sector-wide chip and memory stock sell off following weekend remarks from top AI executives. The primary driver for today's market drop was a weekend call from prominent artificial intelligence leaders.
Technical Insight:
SNDK is positioned in upside direction, trending partially on highs and lows for a couple of weeks now. Stock recently broke below the trend support line at $1,635, in respect to the structure. Price is making a retest, as we anticipate short continuation between $1,610-$1,660.
Key Point:
A confirmed pullback around this zone, activates another sell position down $1,352.84, as next potential bearish.
Thanks for reading.
 Short
Short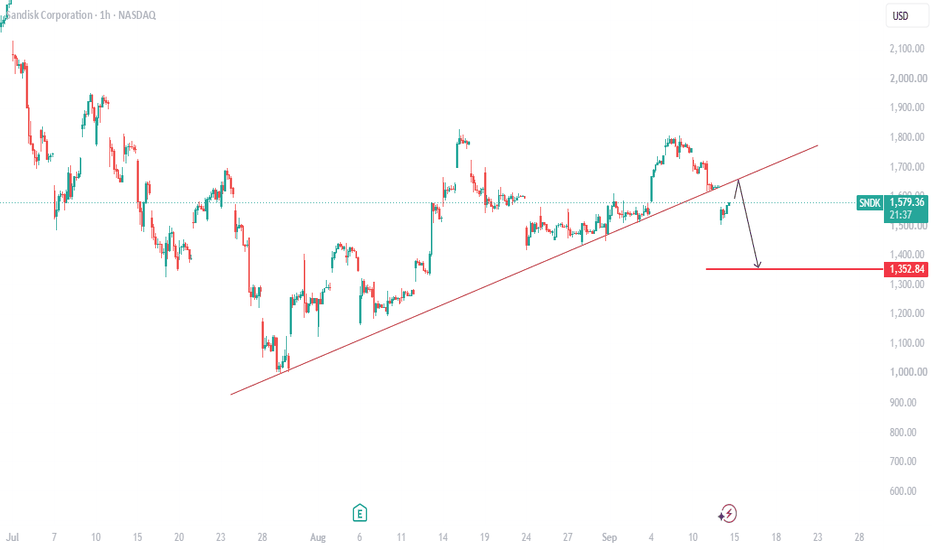
GigaCloud T: Why a Stop-Loss Does Not Always Cancel the SignalGigaCloud Technology: Why a Stop-Loss Does Not Always Cancel the Signal
GigaCloud Technology (NASDAQ: GCT) provides a useful real-world example of how I combine fundamental screening, a systematic entry level and predefined risk management.
The case is particularly interesting because the same Breakout 2 ATR setup has resulted in three separate trades. The first two were stopped out, while the third remains active in the model portfolio as of September 11, 2026.
This illustrates an important distinction within the strategy:
A stop-loss closes an individual trade. It does not automatically invalidate the underlying signal.
THE FUNDAMENTAL SCREENING
Before a stock is evaluated technically, it must first pass my seven-part RERC ERI screening:
1. Return on Invested Capital
2. Earnings Yield
3. Revenue relative to Market Capitalization
4. Cash or Working Capital relative to Market Capitalization
5. Earnings Growth
6. Revenue Growth
7. Institutional and Insider Ownership
At the time of screening, GCT passed four of the seven criteria:
✅ ROIC above 20%
❌ Earnings Yield below 20%
✅ Revenue/Market Cap above 50%
❌ Cash or Working Capital/Market Cap below 50%
✅ Quarterly earnings growth of approximately 27.1%
✅ Quarterly revenue growth of 27.6% year over year
❌ Institutions and insiders below 75% combined ownership
The result was therefore 4/7.
Under my broader screening rules, ROIC must qualify and at least four of the seven RERC ERI criteria must be positive. GCT met both requirements and could proceed to the technical Breakout 2 ATR analysis.
THE ORIGINAL BREAKOUT REFERENCE
The relevant reference was GCT’s highest daily closing price over the preceding three-year period:
Highest three-year closing price: $43.15
Only daily closing prices are used throughout the system. Intraday highs and lows are ignored.
With ATR at approximately $1.49, the Breakout 2 ATR level was calculated as:
$43.15 + (2 × $1.49) = approximately $46.13
This became the active buying trigger.
Adding two ATR above the former high requires more than a marginal breakout. The stock must move sufficiently beyond its previous resistance to demonstrate meaningful strength relative to its own volatility.
THREE TRADES FROM ONE ACTIVE SIGNAL
TRADE #1
GCT produced its first actionable entry on February 26, 2026.
Entry: $46.98
Exit: $42.60 on March 3, 2026
Result: approximately –9.3%
The stop-loss performed its intended function by limiting the loss when the breakout initially failed to follow through.
However, closing the trade did not automatically cancel the underlying Breakout 2 ATR signal.
TRADE #2
GCT subsequently moved back through the active trigger, resulting in a second entry:
Entry: $46.50 on April 9, 2026
Exit: $40.18 on May 8, 2026
Result: approximately –13.6%
The binding stop area was approximately $40.69, based on the system’s absolute maximum loss threshold of 12.5%.
Because the strategy requires confirmation through a daily closing price, the actual closing-price exit was $40.18. The realized loss was therefore slightly greater than 12.5%.
This second unsuccessful trade could easily have created an emotional reason to abandon the stock entirely. The system, however, required a different question:
Had the underlying signal been formally reset?
The answer was no.
TRADE #3
GCT later crossed the still-active Breakout 2 ATR level again and entered the model portfolio for a third time:
Entry: $46.46 on August 4, 2026
Closing price on September 11, 2026: $51.87
The unrealized result was:
($51.87 − $46.46) / $46.46 = approximately +11.6%
The third position therefore remained active and was classified as:
ACTIVE BREAKOUT / HOLD
WHY THE SIGNAL SURVIVED TWO STOP-LOSSES
This is the central lesson from the GCT case.
A stop-loss and a signal reset are two different events.
The stop-loss protects the capital allocated to an individual trade. It does not, by itself, prove that the broader technical setup has disappeared.
The original Breakout 2 ATR buying level remains valid until the stock completes the required 4 ATR reset from a relevant new closing-price top. If such a reset occurs, the old trigger is retired and a new breakout cycle must be calculated from the updated reference top.
That reset had not occurred before the third entry.
The active trigger therefore remained approximately $46.13, allowing the system to act again when GCT returned above it on a daily closing-price basis.
This approach accepts that a valid breakout may require more than one attempt. Small and predefined losses are part of the process. What matters is that every entry, stop and possible re-entry follows the same rules.
HOW THE STOP-LOSS IS ESTABLISHED
Once a position has been purchased, the system waits for the stock to close back below the trade’s entry price.
Wilder ATR(14) is then locked using the final trading day immediately before that downward crossing.
Two possible stop levels are calculated:
1. Entry price minus 2 ATR
2. Entry price minus the absolute maximum loss of 12.5%
The binding stop is whichever of these two levels is closest to the entry price.
The position is sold only when a subsequent daily closing price breaks that stop level. Intraday movements do not count.
This distinction is important. The stop-loss is designed to control the risk of the current trade, while the 4 ATR reset determines whether the underlying Breakout 2 ATR signal remains valid for a possible later entry.
THE ROAD TO PROFIT MANAGEMENT
Profit Management had not yet been activated for Trade #3 as of September 11, 2026.
The model-portfolio entry was $46.46. A 50% gain will therefore be reached at:
$46.46 × 1.50 = $69.69
Profit Management level: $69.69
At the September 11 closing price of $51.87, GCT was:
$17.82 below the Profit Management threshold
From $51.87, the stock would need to rise by approximately 34.4% to reach $69.69.
Until GCT closes at or above $69.69, the position remains governed by the system’s ordinary stop-loss rule.
If the stock eventually reaches the +50% threshold, its status changes from:
ACTIVE BREAKOUT / HOLD
to:
PROFIT MANAGEMENT / TRACK PROFIT
Only then does the system begin monitoring the highest relevant closing price and a subsequent 2 ATR decline for a possible profit-protection exit.
CURRENT SYSTEM STATUS — SEPTEMBER 11, 2026
RERC ERI: 4/7
Original breakout reference: $43.15
ATR used for the breakout trigger: approximately $1.49
Active Breakout 2 ATR trigger: approximately $46.13
Current model-portfolio entry: $46.46
Entry date: August 4, 2026
Closing price on September 11: $51.87
Current Trade #3 result: approximately +11.6%
Profit Management threshold: $69.69
Additional rise required to reach +50%: approximately 34.4%
Profit Management reached: No
4 ATR reset: No
Current status: ACTIVE BREAKOUT / HOLD
CONCLUSION
GCT demonstrates why a rules-based process must separate four different decisions:
1. Does the company qualify fundamentally?
2. Has the technical entry level been reached?
3. When must the individual trade be stopped?
4. Has the underlying signal actually been reset?
GCT qualified with four of seven positive RERC ERI criteria, including ROIC above 20%. Its Breakout 2 ATR trigger was approximately $46.13.
The first two trades were stopped out with losses of approximately 9.3% and 13.6%. However, the underlying signal remained actionable because the required 4 ATR reset had not occurred.
A third entry was established at $46.46 on August 4, 2026. At the September 11 closing price of $51.87, this position showed an unrealized gain of approximately 11.6%.
The next major milestone is $69.69.
That is the level at which Trade #3 reaches +50% and formally enters Profit Management.
Until then, GCT remains an active breakout position governed by the system’s normal stop-loss discipline.
This case does not demonstrate a strategy that avoids losses. It demonstrates a strategy designed to control individual losses, preserve valid opportunities and remain consistent when a stock requires more than one attempt.
Disclaimer: This article is presented for educational purposes only and does not constitute financial advice or a recommendation to buy or sell any security. The figures describe a rules-based model portfolio and should not be interpreted as guaranteed future results.
 Long
Long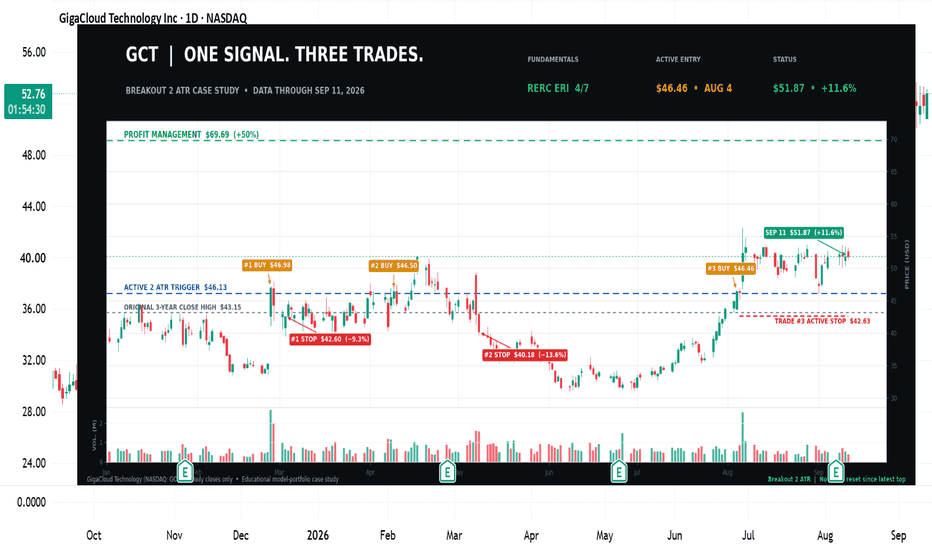
TESLA Last Bear Cycle Leg is starting. $250 possible.Last time we looked at Tesla (TSLA) was exactly 1 month ago (August 13, see chart below) when we gave a strong Buy Signal at the bottom of its 1-year Channel Down:
This time we move back to the wider, long-term charts, more specifically the 1W time-frame to get a sense of the long-term trend now that the price approaches the top of that 1-year Channel Down.
This is our main, key chart for Tesla, which has helped us identify strong Buy/ Sell opportunities over the years. This time it calls for a final Bearish Leg below its 0.382 (orange) Fibonacci level, where the market is expected to bottom above but close to the 1M MA100 (green trend-line).
That's what happened again within the 6.0 - 7.0 Time Fibonacci extension on the previous expansion Cycle in 2019. As you can see, it's not just the price action among the two fractals (2022 - 2026 and 2015 - 2019) that's identical but also their 1W RSI sequences. And every time that turned oversold (RSI < 30.00), Tesla had the most optimal long-term Buy Signal.
We believe that Signal will emerge again with the price around $250.00 but if it does before that, we will again turn long-term buyers on Tesla regardless of the price.
---
** Please LIKE 👍, FOLLOW ✅, SHARE 🙌 and COMMENT ✍ if you enjoy this idea! Also share your ideas and charts in the comments section below! This is best way to keep it relevant, support us, keep the content here free and allow the idea to reach as many people as possible. **
---
💸💸💸💸💸💸
👇 👇 👇 👇 👇 👇  Short
Short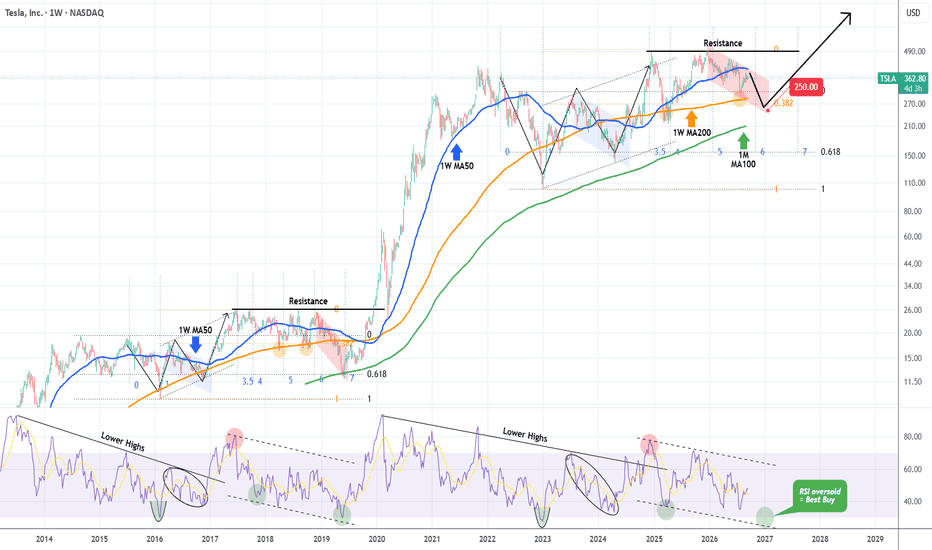
 Long
Long
 Long
Long