SWIGGY: Swing Setup Above ₹285SWIGGY is attempting a tactical recovery after a prolonged decline.
Price has reclaimed ₹270, broken the falling trendline and formed a higher high. It is now testing the ₹282.40–₹285 follow-through zone.
Trade setup
Entry: Clean breakout and hold above ₹285
Target 1: ₹303.85
Target 2: ₹357
Final target: ₹418.65
Stop-loss: Below ₹270
Structural weakness: Below ₹258.80
Complete invalidation: Below ₹239.38
The initial reward toward ₹303.85 is limited relative to the stop. The larger opportunity opens only if price accepts above ₹303.85 and continues toward ₹357.
Avoid chasing a vertical move into the first target. Wait for confirmation above ₹285 and manage the position strictly through the defined levels.
This is a tactical swing setup, not a long-term investment thesis.
Not financial advice (NFA). Shared for educational purposes only. Do your own research and manage risk appropriately.
The Secret Tech Fueling Netflix's EmpireQ2 2026 Earnings and Financial Outlook
Netflix prepares for its Q2 2026 earnings release. Investors anticipate strong revenue growth. Options markets price in an 8% post-earnings jolt. Analysts expect robust subscriber additions. The streaming giant faces high expectations. These financial metrics rely entirely on technological superiority.
Deep Patent Analysis
Netflix holds an incredible patent portfolio. They file numerous patents in machine learning. They patent advanced video compression algorithms. These patents protect their core delivery mechanisms. Competitors cannot easily replicate this infrastructure. Patent analysis reveals a focus on predictive caching. This tech predicts what users will watch next. It pre-loads content to eliminate buffering. This creates an unbeatable competitive moat.
High-Tech and Science
Netflix engineers push computer science boundaries. They develop novel content delivery networks. This infrastructure handles massive global internet traffic. Advanced data science models predict viewer preferences. They use artificial intelligence to optimize streaming quality. Science drives every engineering decision here. This high-tech foundation guarantees superior user experiences.
Cybersecurity Defenses
Cybersecurity remains a top priority for Netflix. They protect petabytes of proprietary content. Hackers constantly target unreleased shows and movies. Netflix employs robust encryption to stop piracy. Their security teams patent novel threat detection models. These systems secure user data and intellectual property.
Industry Trends and Business Models
Industry trends shift toward hybrid monetization. Netflix leads with ad-supported and premium tiers. This business model maximizes global revenue capture. The company monetizes password sharing effectively. Streaming competitors struggle to match this profitability. Netflix dictates the pace of the entire industry.
Culture, Innovation, and Leadership
Management fosters a culture of radical candor. This unique approach accelerates innovation. Leaders empower engineers to take massive risks. They reward bold technological breakthroughs. This culture attracts top global talent. Innovation thrives under such dynamic leadership.
Macroeconomics and Economics
Global macroeconomics shape consumer spending habits. Yet, Netflix proves remarkably resilient during downturns. The economics of streaming favor massive scale. High fixed costs require a massive subscriber base. Netflix achieved this scale years ago. Smaller rivals face brutal economic realities.
Geopolitics and Geostrategy
Geopolitics heavily influences content strategies. Netflix navigates complex regulatory environments worldwide. They invest heavily in local foreign content. This geostrategy builds strong global market share. It also creates soft power across borders. Geopolitical tensions sometimes force market exits. However, global diversification mitigates these regional risks.
The Pharmaceutical Connection
Does a pharmaceutical industry connection exist? Surprisingly, yes. Prolonged screen time impacts global sleep patterns. This trend directly drives demand for sleep aids. Furthermore, Netflix’s data infrastructure inspires biotech firms. Pharma uses similar predictive AI models for drug discovery. High-tech analytics seamlessly cross traditional industry lines.
NVIDIA (NVDA): Final Upside Impulse Targets 237-275 area This stock has clear impulsive structure as I broke it down in the chart
4 large waves (yellow) are completed
RSI confirms the structure with Bearish Divergence of waves 3 and upcoming wave 5
4 minor waves (white) within the final large wave 5 finished as well
Minor wave 4 was about to dip into the territory of minor wave 1 risking invalidation
Luckily for NVDA it did not happen and RSI also kept bullish so far
Final minor wave 5 within the last large wave 5 is underway
Wave 3 already hit regular Fibonacci based targets
Hence, minimum target for wave 5 is to hit the all-time high at $237
The resistance of the white uptrend channel built through waves 2 and 4
offers optimistic target highlighted with the blue box between $237 and $275
Invalidation is still there at the peak of minor wave 1 of large 5 below $177
NB: Strategic Mineral Supply Chain Catalysts Fuel Macro Setup### **The Macro Picture**
Following a multi-year consolidation phase, **NioCorp Developments Ltd. ( NASDAQ:NB $)** has coiled into a massive, textbook **Symmetrical Triangle** pattern on the weekly timeframe.
Price is currently trading at **$4.75** (with overnight active pricing hovering around **$4.62**), testing the absolute lower ascending support boundary. This is a massive, high-timeframe "make-or-break" accumulation region. A successful defense of this primary structural floor sets the stage for an explosive macro breakout.
---
### **Key Technical Parameters**
Our high-timeframe layout highlights a highly structured bottoming play with asymmetric upside potential:
* **Entry Trigger Zone:** **$4.79** *(Requires a weekly close above the immediate consolidation structure to confirm the initial shift in trend)*.
* **Current Price:** **$4.75** (testing the macro triangle support).
* **Stop Loss (Invalidation):** **$2.00** *(Set safely below the major multi-year horizontal support zone)*.
* **Macro Target:** **$30.64** *(Projected using the full structural height of the multi-year symmetrical triangle)*.
---
### **Supporting Indicators & Fundamental Tailwinds**
* **Adaptive RSI Supertrend:** The weekly momentum oscillator has cooled off completely and is resting near oversold territory. This confirms selling exhaustion at the exact moment price is testing the key lower boundary of the triangle.
* **Weekly Bias:** The right panel displays a **"WEEKLY BULLISH"** status, indicating that the higher-timeframe trend retains structural support despite near-term downward volatility.
* **Major Fundamental Catalysts:**
* **Imminent Strategic Alliances:** In a blockbuster CNBC "Squawk Box Asia" appearance on **July 13, 2026**, NioCorp CEO Mark A. Smith stated that multinational trade agreements to secure critical and rare-earth minerals with U.S. allies (such as the G7, Japan, the EU, and Mexico) are actively ongoing and could be announced "literally any day." This follows the expiration of the administration's 180-day Section 232 deadline to address foreign critical mineral reliance.
* **EXIM Debt Financing Precedent:** NioCorp is in advanced, late-stage discussions with the U.S. Export-Import Bank (EXIM) for a major debt financing package to fund its flagship Elk Creek Project. The execution of EXIM's massive $2.9 billion commitment to Perpetua's Stibnite project earlier this year serves as a powerful precedent.
* **Policy Tailwinds:** Elk Creek is rapidly de-risked by state tax incentives of up to $200 million in Nebraska, alongside the rollout of the White House's **"Project Vault"** critical mineral stockpile initiative designed to build strategic domestic reserves.
---
### **Trade Outlook**
With the price compressing heavily near the apex of this multi-year triangle, the risk-to-reward ratio is heavily asymmetric. We are looking for a clean weekly close above **$4.79** to confirm the breakout and unlock the macro path toward the long-term **$30.64** target. Meanwhile, maintaining structural support above the **$2.00** invalidation level is essential to keep the macro bullish thesis intact.
What are your thoughts on NioCorp's position in the race for domestic critical mineral independence? Drop your thoughts in the comments below, and don't forget to like and follow for more clean setups!
**#TaxpayerTrades**
---
### **Disclaimer**
*This analysis is for educational and informational purposes only and should not be construed as financial, investment, or trading advice. Trading equities and critical mineral stocks involves a high degree of risk, volatility, and can result in the loss of principal. Please conduct your own due diligence or consult a licensed financial advisor before making any investment decisions. Past performance is not indicative of future results.*
NIO: Macro Accumulation Base Eyes $+12$ Trend Reversal### **The Macro Picture**
Following a prolonged macro correction, **NIO Inc. ( NYSE:NIO $)** is carving out a major high-timeframe accumulation base on the weekly chart.
Price is currently trading at **$5.03** (with overnight active pricing hovering at **$5.12**). The bulls have successfully defended the crucial macro support zone at **$4.00**, and the price action is beginning to curve upward within the horizontal range. This successful defense of the range lows presents a highly asymmetric risk-to-reward bottoming opportunity before the macro trend reversal confirms.
---
### **Key Technical Parameters**
Our high-timeframe layout highlights a highly structured bottoming play with asymmetric upside potential:
* **Accumulation Buy Zone:** **$4.00 - $5.50** *(Lower end of the macro consolidation range)*.
* **Current Price:** **$5.03** (showing solid baseline support).
* **Breakout Confirmation Pivot:** **$8.00** *(A decisive weekly close above major horizontal resistance is required to trigger the macro trend reversal)*.
* **Stop Loss (Invalidation):** **$4.00** *(Invalidated on a weekly candle close below the primary "BULL" support zone)*.
* **Macro Target:** **$12.81** *(The automated projection target once the baseline accumulation phase completes)*.
---
### **Supporting Indicators & Fundamental Tailwinds**
* **Adaptive RSI Supertrend:** The weekly momentum oscillator is curving up strongly from deep oversold territory. The bullish crossover above its signal line confirms long-term selling pressure has officially exhausted, creating a strong underlying bullish divergence.
* **Weekly Bias:** The higher-timeframe trend continues to hold a "WEEKLY BULLISH" bias, signaling that the primary structural trend is shifting positive despite short-term consolidation.
* **Game-Changing Semiconductor Strategic Alliance:**
* **Strategic Investment in CXMT IPO:** On **July 14, 2026**, NIO officially became a strategic investor in the initial public offering of **ChangXin Memory Technologies (CXMT)**—China's largest DRAM manufacturer. NIO committed **¥158 million ($23.3 million)** through its subsidiary, Nio Power Technology (Hefei) Co Ltd, securing a 0.27% stake (18.24 million shares) subject to an 18-month lock-up.
* **Securing Next-Gen EV Supply Chains:** This strategic alliance focuses on automotive-grade **LPDDR4X and LPDDR5X memory products**. These high-performance chips are critical components powering NIO's next-generation smart cockpits, vehicle infotainment systems, and advanced driver-assistance systems (ADAS).
* **Hedging Cost Pressures:** Surging global memory prices have heavily pressured EV manufacturer margins, adding up to 20,000 yuan (~$3,000) in production costs per vehicle. By aligning directly with China's top domestic silicon giant, NIO vertically integrates its supply chain to protect future vehicle margins and manufacturing timelines.
---
### **Trade Outlook**
With NIO currently coiling near the floor of its macro accumulation base, we are looking for a continuation back toward the range high. A clean weekly close above **$8.00** will confirm the macro trend reversal and rapidly open the path toward our target at **$12.81**. In the meantime, maintaining weekly structure above **$4.00** is key.
What are your thoughts on NIO's strategic shift toward silicon integration? Drop your thoughts in the comments below, and don't forget to like and follow for more clean setups!
**#TaxpayerTrades**
---
### **Disclaimer**
*This analysis is for educational and informational purposes only and should not be construed as financial, investment, or trading advice. Trading equities and ADRs involves a high degree of risk, volatility, and can result in the loss of principal. Please conduct your own due diligence or consult a licensed financial advisor before making any investment decisions. Past performance is not indicative of future results.*
UAMY: Multi-Year Symmetrical Triangle Eyes Huge $+30$ Target### **The Macro Picture**
Following a multi-year consolidation phase, **United States Antimony Corporation ( NYSE:UAMY $)** has coiled into a massive, textbook **Symmetrical Triangle** pattern on the weekly timeframe.
Price is currently trading at **$5.92** (with active positioning hovering right around **$6.00**), testing the lower ascending support boundary of the triangle structure. This puts NYSE:UAMY $ in a crucial "make-or-break" accumulation zone. A successful defense of this key structural boundary sets the stage for a major macro breakout.
---
### **Key Technical Parameters**
Our automated pattern detector has mapped out a highly precise structural setup with an asymmetric **1:4 Risk-to-Reward ratio**:
* **Entry Trigger Zone:** **$9.30** *(Requires a definitive weekly candle close above the descending resistance line)*.
* **Current Price:** **$5.92** (coiling tightly within the apex of the structure).
* **Stop Loss (Invalidation):** **$3.03** *(Set just below the ascending support trendline)*.
* **Macro Target:** **$34.38** *(Projected using the full height of the symmetrical triangle structure)*.
---
### **Supporting Indicators & Fundamental Tailwinds**
* **Adaptive RSI Supertrend:** The weekly momentum oscillator has cooled off significantly from prior overbought territory and is now leveling off near oversold thresholds, signaling that selling pressure is exhausting right as the price tests macro trendline support.
* **Weekly Bias:** The higher-timeframe trend continues to hold a "WEEKLY BULLISH" bias, indicating that the larger structural trend is still leaning positive despite short-term consolidation.
* **Massive Fundamental Catalysts:**
* **Government Contracts & Funding:** NYSE:UAMY $ holds a massive, sole-source **$245 Million contract** with the Defense Logistics Agency (DLA) to supply military-grade antimony metal ingots. This is heavily backed by a **$27 Million Pentagon grant** to upgrade domestic smelting capacity.
* **Radersburg Mill Milestone:** On **July 7, 2026**, the company celebrated the "wet commissioning" of its freshly acquired and upgraded $7.7M Radersburg flotation mill. This facility completes a fully integrated, 100% US-owned supply chain, allowing the company to ramp up the processing of high-grade antimony ore from its Montana mines.
* **Silver JV & AI Integration:** NYSE:UAMY $ recently partnered with Americas Gold and Silver to build a state-of-the-art hydrometallurgical processing plant, while integrating advanced AI geological modeling to unlock major value from its legacy Los Juarez silver asset.
---
### **Trade Outlook**
With the price compressing heavily into the apex of this multi-year triangle, we are looking for a definitive weekly close above **$9.30** to trigger the macro expansion phase toward our **$34.38** target. Meanwhile, maintaining support above the **$3.03** invalidation level is essential to keep the macro bullish thesis intact.
What are your thoughts on this critical minerals macro play? Drop your thoughts in the comments below, and don't forget to like and follow for more clean setups!
**#TaxpayerTrades**
---
### **Disclaimer**
*This analysis is for educational and informational purposes only and should not be construed as financial, investment, or trading advice. Trading equities and critical mineral stocks involves a high degree of risk, volatility, and can result in the loss of principal. Please conduct your own due diligence or consult a licensed financial advisor before making any investment decisions. Past performance is not indicative of future results.*
Goldman Sachs (GS): Earnings Beat Fuels Buying InterestGS is attracting buying interest after reporting earnings that surpassed market expectations. The stock remains in a strong uptrend, continuing to make higher highs and higher lows, reflecting sustained bullish momentum.
The Goldman Sachs Group, Inc. is a $339.87 billion market capitalization company that provides a broad range of financial services to corporations, financial institutions, governments, and individuals worldwide. It operates through three business segments: Global Banking and Markets, Asset and Wealth Management, and Platform Solutions. The Global Banking and Markets segment provides investment banking, financing, securities services, and client execution services across equities, fixed income, currencies, and commodities markets. The Asset and Wealth Management segment offers investment and wealth advisory solutions, including lending, deposit-taking, and investing services. The Platform Solutions segment includes consumer platforms, strategic partnerships offering credit cards and point-of-sale financing, as well as transaction banking services.
GS is a wide economic moat company that has grown revenue in two of the last three quarters and delivered earnings-per-share growth in each of the last three quarters. The company maintains strong profitability, with a net margin of 52% and a return on equity (ROE) of 17%, underscoring management's ability to generate attractive returns for shareholders. Its diversified business model, leading position in investment banking and capital markets, and growing wealth management franchise continue to support its competitive advantages and long-term growth prospects.
NVO: Bullish Pennant Breakout Unlocks $+70$ Macro Target### **The Macro Picture**
Following a strong rally into early **2026**, **Novo Nordisk A/S ( NYSE:NVO $)** entered a healthy, multi-month consolidation phase. During this time, the price formed a textbook **Bullish Pennant** pattern, systematically carving out a series of lower highs and higher lows.
The compression phase has officially resolved to the upside. With price currently trading at **$50.56**, NYSE:NVO $ has cleanly broken out of the descending resistance trendline and is showing strong signs of a structured, healthy uptrend.
---
### **Key Technical Parameters**
Our automated pattern detector has mapped out a highly precise structural setup with a clean **1:4 Risk-to-Reward ratio**:
* **Entry Trigger Zone:** **$43.94** *(Clean breakout and retest of the upper pennant boundary)*.
* **Current Price:** **$50.56** (showing solid momentum above the pivot).
* **Stop Loss (Invalidation):** **$36.99** *(Set just below the lower support boundary of the pennant structure)*.
* **Macro Target:** **$71.74** *(Measuring the length of the prior bullish pole applied to the breakout point)*.
---
### **Supporting Indicators & Fundamental Tailwinds**
* **Adaptive RSI Supertrend:** The momentum oscillator at the bottom of the daily chart shows a clean, upward curvature out of oversold territory. It confirms rising buying pressure without being overbought.
* **Regime Score:** Currently sitting at a maximum **100 / 100**, confirming strong high-timeframe (HTF) bullish alignment.
* **Fundamental Catalyst:** Underlying the technical breakout is a renewed surge in investor confidence. NYSE:NVO $’s semaglutide franchise (Wegovy and Ozempic) continues to secure key label expansions. Most notably, the brand-new oral Wegovy weight-loss pill launched on January 5, 2026, has already crossed a monumental milestone of over 3 million prescriptions in the U.S. alone, fueling upgraded commercial expectations for the year.
---
### **Trade Outlook**
The path of least resistance is firmly skewed to the upside. As long as the bulls maintain structure above the major **$44.00** breakout pivot, we expect this macro trend to continue marching toward our ultimate pattern target at **$71.74**.
Let me know what you think in the comments below! If you find this analysis helpful, please drop a like and follow for more clean setups.
**#TaxpayerTrades**
---
### **Disclaimer**
*This analysis is for educational and informational purposes only and should not be construed as financial, investment, or trading advice. Trading equities, options, and derivatives involves a high degree of risk and can result in the loss of principal. Please conduct your own due diligence or consult a licensed financial advisor before making any investment decisions. Past performance is not indicative of future results.*
NVDA: Buyers Return as Pullback Presents OpportunityNVDA is attracting buying interest after retracing to the $195 level and is beginning to resume its primary uptrend. The stock continues to trade constructively, maintaining its longer-term bullish structure.
NVIDIA Corp. is a $5.14 trillion market capitalization company that designs and manufactures computer graphics processors, chipsets, and related multimedia software. It operates through the Graphics Processing Unit (GPU), Tegra Processor, and All Other segments. The GPU segment includes leading product brands such as GeForce for gaming, RTX and Quadro for professional visualization, Tesla and DGX systems for artificial intelligence and data center applications, and GRID for cloud-based visual computing. The Tegra Processor segment integrates complete computing systems onto a single chip, powering autonomous robots, drones, vehicles, and gaming and entertainment devices. The All Other segment includes stock-based compensation expenses, corporate infrastructure and support costs, acquisition-related expenses, legal settlement costs, and other non-recurring items.
NVDA is a wide economic moat company that has delivered significant revenue and earnings-per-share growth over the past three quarters, driven by sustained demand for its AI and data center products. The company maintains exceptional profitability, with operating and net margins of 66% and 71%, respectively. Return on equity (ROE) and return on invested capital (ROIC) stand at an impressive 114% and 106%, highlighting NVIDIA's efficient use of capital. Its strong balance sheet is reflected in a current ratio of 3.4x and a low debt-to-equity ratio of 0.1x, providing substantial financial flexibility to support future growth initiatives.
ICICIGI - Bullish flag - Ready for breakout if history rhymesCustom Index General insurance NSE:ICICIGI+NSE:GICRE+NSE:STARHEALTH+NSE:NIACL+NSE:GODIGIT+NSE:NIVABUPA
gave a wedge breakout on weekly timeframe.
ICICIGI is the industry leader with good fundamentals. Jun - Sep 1Y duration stock price has also been good. Results has also been good during Q1, Q2. 60% potential. Price broke out 50DMA, 200DMA. Fib & Pivot targets are displayed in chart.
Coupe with HandlePratap snacks is trying to made Coupe with handle form on daily chart. If you look at present handle its ready to give some more side ways and give breakout on upside. This is strong Bullish signal but lets see volume gives us the support to grow or will it remain in consolidation for more days.
RPGLIFE: 1H High-Level Consolidation Threatening 3,000 Breakout 📊 RPG Life Sciences Limited (RPGLIFE) - 1-Hour (1H) Chart Analysis
This post is shared for EDUCATIONAL PURPOSES ONLY to analyze short-term consolidation boxes and moving average expansion. It is not financial or investment advice.
🟢 Technical Observations:
1. High-Level Consolidation Box: On the 1H timeframe, RPGLIFE has established a tight, high-level accumulation range between 2,830.00 and 2,990.00 following an aggressive upward surge.
2. EMA Ribbon Alignment: The price action is holding solidly above all key moving averages. The short-term EMA (green line at 2,831) and medium-term EMA (blue line at 2,699) are fanning upward, providing dynamic structural support.
3. Psychological Barrier: The stock is grinding directly underneath the major 3,000.00 psychological resistance milestone. A definitive 1H close above 3,000.00 confirms the next leg of momentum continuation.
4. Volume Validation: Significant green volume spikes backed the recent rally into the range, indicating strong underlying institutional interest and active absorption of supply.
🎯 Educational Swing Setup:
• Entry Zone: 2,880.00 – 2,970.00 (Sizing into position blocks within this consolidation box, or executing on a confirmed hourly breakout close above 3,000.00).
• Target 1: 3,200.00 (Near-term structural expansion target in blue-sky territory)
• Target 2: 3,400.00 (Extended momentum swing target)
• Invalidation / Stop-Loss: 2,680.00 (An hourly close back below the medium-term blue EMA support invalidates this short-term bullish thesis).
• Expected Duration: 4 to 10 Trading Days (Short-term hourly swing view)
⚠️ Risk Management:
Since the price is trading near all-time peak levels, watch for a high-volume hourly candle to confirm the breakout above 3,000. Keep your position sizing disciplined and manage risk appropriately!
A quick update to our Chinese stocks.I made this video for my subscribers because I really wanted to give an update to what I'm seeing in this chart and we go over our BABA chart were still long DCAing out of our position and I also cover the Hang Seng and my thoughts on the short term of things in the over all Chinese stock market. The Hang Seng is actually testing resistance as I publish this video so I expect some sort of a pull back in the short term and I will be looking to go long on other Chinese stocks IF they get to my levels!
Filatex India – Monthly Breakout SetupSetup: Monthly chart showing long consolidation between ₹30–₹70, now projecting upward momentum.
Current Price Action: Breakout zone forming above ₹70.
Target Projection: ₹160 (≈127.91% potential gain).
Trend Context:
Consolidation base built over multiple years.
Volume activity suggests accumulation.
Breakout projection box highlights upside potential.
Why Traders Care:
Long consolidations often precede strong directional moves.
Monthly timeframe adds conviction to the breakout.
Clear risk/reward defined with consolidation base as support.
My Take: Filatex India is breaking out of a multi‑year range — sustaining above ₹70 could open the path toward ₹160.
Community call: Will Filatex India deliver the full breakout or slip back into consolidation? Share your view.
Falling wedge in a falling wedgeFalling wedge in a falling wedge.. Waiting for a break out. Looking for momentum on the upside but this stock needs overall market sentiment to be bullish. Any negative news that takes down the indexes will drag this down, the best bull case is we get good news in overall market, good news for nuclear sector, good news with NYSE:OKLO . Am I looking for a unicorn?
Navin Fluorine – Inverted H&S Breakout SetupSetup: 1‑hour chart showing a Head & Shoulders formation with neckline breakout potential.
Current Price: Around ₹7,800 projection zone.
Trend Context:
Left Shoulder, Head, Right Shoulder clearly defined.
Moving average support aligning with breakout zone.
Long/Short signals marking trader interest.
Why Traders Care:
Head & Shoulders is a classic reversal pattern.
Breakout above neckline often signals strong upside.
Volume confirmation adds conviction to the move.
My Take: Navin Fluorine is flashing a bullish reversal — sustaining above neckline could open the path toward ₹7,800.
Community call: Will Navin Fluorine confirm the breakout or stall at resistance? Share your view.
GROWWGroww Ltd. (CMP ₹216.00, NSE: GROWW)
The SmartWay Research Desk | 16 July 2026
Groww, headquartered in Bengaluru, is one of India’s leading digital investment and financial services platforms, incorporated in 2016. It offers stockbroking, mutual funds, ETFs, fixed deposits, and digital wealth management, serving over 40 million retail investors.
Promoter Holding (Mar 2026): ~30% (no pledges)
FY22–FY26 Snapshot
Revenue Growth: FY26 revenue ₹1,842 Cr vs ₹1,512 Cr in FY25 (+21.8% YoY). → Good
Net Profit: FY26 PAT ₹212 Cr vs ₹168 Cr in FY25 (+26.2% YoY). → Good
Operating Margin: FY26 EBITDA ₹412 Cr, margin 22.4% vs 21.0% last year (+140 bps). → Good
Equity Capital: Stable, face value ₹10. → Good
Dividend Policy: No dividend declared; reinvestment in growth. → Neutral
Asset Building: Investments in AI‑driven advisory, trading infrastructure, and compliance systems. → Good
Sales: Strong demand from retail stockbroking and mutual fund SIPs. → Good
Expense: Marketing and tech infra costs remain high. → Neutral/Good
EPS: FY26 EPS ₹4.25 vs ₹3.40 last year (+25%). → Good
Institutional Interest & Ownership Trends (Mar 2026)
Promoter Holding: ~30% (no pledges)
FII Holding: 28.12%
DII Holding: 22.34%
Retail & Others: 19.54%
Strategic Moves & Innovations
Expansion in direct equity trading and derivatives.
Focus on digital wealth advisory and robo‑advisory tools.
Partnerships with banks and fintechs for distribution.
Diversification into fixed deposits and insurance products.
Cash Flow & Balance Sheet Strength
Market cap ~₹20,200 Cr.
Debt‑to‑equity ratio ~0.25 (low leverage).
Book value per share ₹42.10; P/B ~5.1.
EPS (TTM) ₹4.25; P/E ~50.8.
Risk Factors
High P/E ratio ~50.8, indicating premium valuations.
Dependence on retail investor activity and market cycles.
Exposure to regulatory changes in SEBI norms.
Competition from Zerodha, Upstox, and Paytm Money.
Investor Takeaway
Groww has delivered strong FY26 performance, supported by retail participation, SIP growth, and digital expansion. With institutional backing, reinvestment in technology, and leadership in fintech broking, Groww remains a premium play on India’s retail investing boom. At CMP ₹216.00, valuations are expensive (P/E ~50.8, P/B ~5.1), reflecting growth expectations but also sectoral risks.
STT Update #4: The Entry Created the Trade—Trailing Stops ProtecThe breakout created the opportunity.
The trailing stop is what keeps the trade under control.
This is the fourth update in my ongoing analysis of State Street Corporation ( NYSE:STT ).
The original setup began with a constructive base and a clearly defined initial stop. Since then, price has continued to build higher structures, allowing the position to transition from initial risk management into active profit protection.
The progression has been straightforward:
The initial stop was first raised toward the breakout area
The trailing stop was updated again as a new higher low developed
After the latest consolidation resolved higher, the trailing stop has now been raised for the third time
The newest trailing-stop area is positioned around $174, beneath the most recent completed structure.
This does not mean the trend is guaranteed to continue. It means the position has earned additional room while accumulated gains receive stronger protection.
Price is now approaching the projected area near $195, but that level is not a reason to predict the top or force an exit. The priority remains the same: observe the structure and respond accordingly.
As long as STT continues to produce constructive higher lows, the position can remain open. If the current structure fails, the trailing stop provides the exit without requiring an emotional decision.
The broader lesson from this entire STT series is simple:
A breakout gets us into the trade.
Risk management keeps us in control.
Trailing stops allow a winner to reveal how far it can go.
No prediction of the final top.
No arbitrary profit-taking.
Just progressively protecting the position as the trend develops.
Previous stages of this STT series:
Multiple bases established the trend structure
Breakout confirmation activated the setup
The initial stop transitioned into a trailing stop
The trailing stop is now raised again as the trend expands
Educational and research purposes only. Not financial advice.
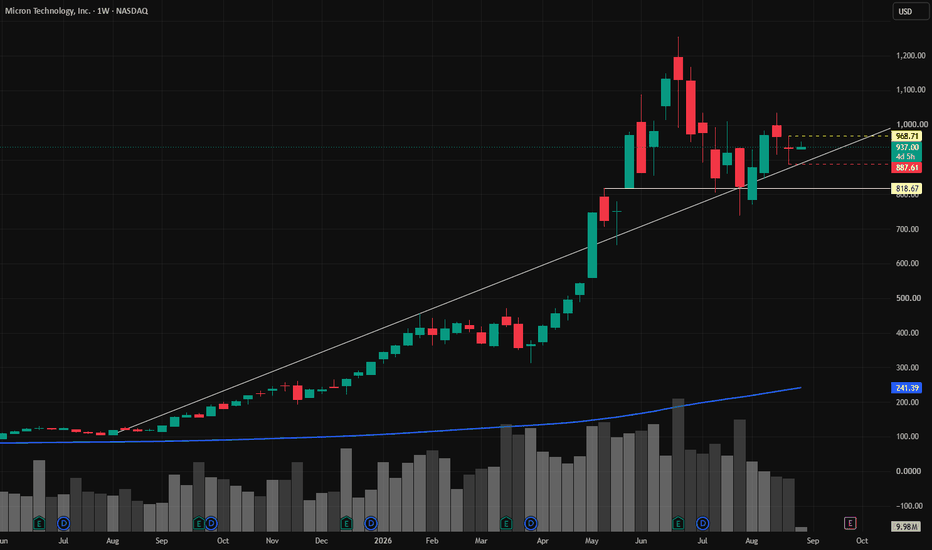
Micron 1.618 Fibonacci HitFrom the peak of the Dot Com Bubble to the nadir of the Great Financial Crisis, Micron actually hit it's 1.618 Fib. A Biblical move a quarter century in the making, this one is for the history books. There also appears to be a generational cup and handle formation playing out, although it's technical target may be years out of reach.
Low-Volume Node (LVN) : 145.30 ~ 154.60
Hello traders!
If you "Follow" us, you can always get new information quickly.
Have a nice day today.
-------------------------------------
Since this chart is still relatively new, the support and resistance levels marked on it have not been fully validated by price action yet. Therefore, extra caution is required when trading.
Based on the price action so far, I believe that any price below 168.35 is likely to fall within a medium-to-long-term accumulation zone.
A Low-Volume Node (LVN) has formed between 145.30 and 154.60 on the Volume Profile.
As a result, the key question is whether price can reclaim and hold support within the 145.30–154.60 range.
If the current downtrend continues, we should monitor the following Fibonacci extension levels for potential support:
1st target: Fibonacci Extension 1.618 (127.42)
2nd target: Fibonacci Extension 2.618 (102.41)
Support confirmation around these areas will be important.
As more time passes and additional price and volume data accumulate, indicators are gradually starting to form.
The first indicator to appear is the PC HH indicator.
Therefore, the short-term top is likely to be around the PC HH level at 198.98.
Since the PC LL indicator has not yet formed, the short-term bottom remains undefined and volatility is still relatively high.
In addition, the OBV indicator has established both a Low Line and a High Line. Therefore, we need to see whether OBV can move back above its Low Line and continue building bullish momentum.
Ideally, traders should wait until OBV returns above the Low Line and then confirm support at nearby support/resistance levels before entering positions.
If support is confirmed, that would be an appropriate short-term buying opportunity.
Since neither the HA-Low nor HA-High indicators—which form the foundation of my trading system—have appeared on the higher timeframe chart yet, I believe it is still too early for aggressive position trading.
---
Until then, trading should primarily be based on lower timeframes (1D and below), focusing on short-term/day trading opportunities.
On the 15-minute chart, both the HA-Low and HA-High indicators have already formed, providing useful trading signals.
A basic trading strategy would be:
- Buy when price finds support around the HA-Low or DOM(-60) levels.
- Take profit when price reaches the DOM(60) or HA-High levels.
It is always better to trade using objective market data.
Trying to predict price movements based on news, narratives, market rumors, external indexes, or unrelated market events is generally not a good approach.
At the end of the day, successful trading comes down to understanding how price and volume are actually behaving in the asset you are trading.
---
In my opinion, relying solely on traditional volume indicators is highly inefficient because they are often difficult to interpret correctly.
Instead, I prefer using indicators that incorporate actual volume flow more effectively, such as:
- OBV (On-Balance Volume)
- Volume Candles
Volume Candles provide a much clearer visual representation of whether current trading volume is stronger or weaker compared to previous periods.
In that sense, they are significantly more efficient than traditional volume bars.
One drawback of Volume Candles is that trendlines do not display very well on them.
Therefore, if you rely on trendline analysis, it is better to switch back to a standard candlestick chart when drawing or monitoring trendlines.
Personally, I rarely use trendlines because my core trading strategy revolves around the HA-Low and HA-High indicators.
When an HA-Low appears, it suggests that the market is attempting a bullish reversal and may be forming a bottom.
Therefore, if price successfully holds support near the HA-Low level, it can be considered a buying opportunity.
Conversely, when an HA-High appears, it suggests that the market may be preparing for a bearish reversal and could be forming a local top.
Therefore, if price encounters resistance near the HA-High level, it can be considered a selling opportunity.
If price remains somewhere between HA-Low and HA-High, then market direction should simply be interpreted based on ongoing price action.
I refer to a move below HA-Low as a "stair-step downtrend" and a move above HA-High as a "stair-step uptrend."
A stair-step downtrend eventually forms a bottom and transitions into an uptrend.
Likewise, a stair-step uptrend eventually forms a top and transitions into a downtrend.
Therefore, the primary strategy is:
- Build core positions around HA-Low levels.
- Gradually distribute those core positions during stair-step uptrends.
All other market conditions can be traded using a short-term/day trading approach.
For example, after building a core position near an HA-Low level, simply holding through the entire move often means that you will end up selling most or all of that position once price reaches an HA-High level.
Depending on market conditions, you may choose to take partial profits instead.
If price continues to rally afterward and develops into a strong stair-step uptrend, you may regret having sold.
However, that sale was still a well-executed trade because it followed a predefined trading plan.
This is why it is important to separate your core position from your active trading position.
While holding your core position, you should continue day trading around it to generate additional profits and potentially increase your overall coin holdings.
In that sense, traders should move away from focusing solely on their average entry price.
Instead, each purchase price should be managed independently.
When you trade based on individual entry prices, the average entry price displayed by the exchange becomes far less important.
Even if frequent trading causes your exchange-reported average cost to move closer to the current market price, there is no reason to feel pressured by it.
For that reason, I strongly recommend keeping a separate record of your true core-position average entry price.
---
Thank you for taking the time to read through this analysis.
Wishing you all successful trades and profitable opportunities ahead.
Risk off trade mod on ANET - long at 171.92This trade is a little different than what I usually do. It's something I've been playing around with for use during tough times. It's still a mean reversion, but with a little safety net just in case. It could involve a realized loss, so beware if you are used to my trades that don't go that route.
Things feel shaky in this market right now. The fact that they FEEL shaky doesn't mean that they ARE shaky, though. But as with much of trading, I'm no prognosticator where markets are headed - that's way above my pay grade. My normal trading methods are great in choppy non-trending markets, ok but locked out a lot in uptrending regimes and can be downright rough (though almost always ultimately profitable) in downtrends. This is a compromise for in case that last one is where ANET is headed.
As always, the goal here is a quick flip. Essentially there are 3 ways to play those - aggressively trying to squeeze every drop out of the trade; a more neutral version where exits are usually quick but stubborn holds until profit are part of the equation; and then a conservative version - which is the one I'm doing here.
The entry here is based on an abnormally large downward move. The twist is the exit which is based on a 4 part decision tree.
Part one - if the next bar opens above my entry price, I close and walk away with whatever profit I get. These are often small wins. But my game is to beat the average daily return of the market and do it all over again with that same money as soon as the trade clears. So the bar isn't high: more than .043% in one day puts me ahead of the game. If I can get 6x that (about .25%) once every week, I'd beat the market's long term average return. So I have no problem with a small quick win here and that is my preference.
Part 2: If that fails and the stock opens below my entry price tomorrow, then my next target becomes an above median move from that point. Now, if it Is a large gap down at the open, this option may immediately come off the table, as even a move to that level would still be below my entry price and I'm not taking a loss this quickly. But if the median high is above my entry price, I set a limit order at that level and I hope for the best.
Part 3 - If that target does not get hit, I will revisit the trade near the end of the trading day. If closing at that point gives me a profit I take it. And if not...
Part 4 - do it all over again tomorrow the same way. If that bar's open is above my entry, I close. etc. If, however, at the end of the 2nd day I'm still in the red, I eat the loss.
Some general notes about this. First, the most common result is out the next day. For ANET, this technique has had a win rate of 82% over the past year, with an average trade being about .33% with losing trades included in that average. That's around 7.5x the average market return and a level that if annualized, is an around 80% rate of return. Not too shabby. About 75% of the trades have been day 1 wins. Once you get to day 2, it becomes closer to a coin toss.
However, and this is important, losses tend to be asymmetrically large. The key is that they are almost never huge. The average loss was 3.2% over the past year while the average gain was only 1.2%. But an 80% win rate, even with smaller magnitude wins overwhelms the losses. This is not a fluke of recent strength in the stock, either. The dynamics are similar, though a bit weaker, over the long haul.
Over the 12 years since ANET went public, covering 650 backtested and live trades, the win rate on this is around 70%, but the discrepancy between win and loss magnitude is smaller, producing an average daily return on invested capital of .25% - still a 63% annualized rate of return.
The more aggressive ways to trade this would, predictably, lower win rate and raise average gains overall, but jeopardize per day returns (capital efficiency). Given the run that ANET and its cohorts have been on and the weakness this part of the market keeps flirting with, after ANET has clocked a price jump of almost 50% just in the last 3 months, I'm choosing the path fraught with the least amount of short term danger.
If there is a market meltdown, I want my capital available and not tied up for months or years waiting to get back to even. This guarantees not to lock up capital. The biggest loss in the last 12 months on ANET doing this has been 6%. I can make that much on a single trade on one good day. I'll risk the loss for safety and liquidity right now.
By the way, stacking additional lots is possible, provided my entry criteria are met. Additional lots follow the same rules. I'll keep this idea live until all lots have been closed.
As always - this is intended as "edutainment" and my perspective on what I am or would be doing, not a recommendation for you to buy or sell. Act accordingly and invest at your own risk. DYOR and only make investments that make good financial sense for you in your current situation.
SWDY - EGX : Technical Review on the weekly time-frameEGX:SWDY
Timeframe: 1 Week (1W)
Current Price: EGP 90.50 (+1.69%)
Weekly Range: 87.41 – 91.49
Volume: 944.73K vs. 1.23M (20-week Volume Average)
1. Trend & Structure Breakdown
Macro Accumulation Breakout: Following the powerful bull run through 2023–2024, SWDY underwent a multi-month re-accumulation range between EGP 68.00–70.00 (support boundary) and EGP 85.00–86.00 (resistance line).
Rounded Base Completion: The chart displays a well-defined rounded consolidation structure (orange curved line), lifting higher lows out of the late 2025 trough.
Range Resistance Clearance: Weekly candle closing above 86.00 confirms a legitimate structural breakout from the consolidation box, opening the pathway for target expansion toward previous peak levels near 100.00+.
2. Technical Indicators
Volume Analysis: Volume stands at 944.73K, indicating stable re-accumulation without immediate distribution signals. A push above 1.23M on subsequent green candles will add strong confirmation to the rally.
RSI (14): Sitting healthy at 65.95 (above signal 62.87). It shows accelerating momentum in bullish territory with room to push into overbought territory before reaching exhaustion.
MACD (12, 26, 9): Operating cleanly above the signal line (3.08 vs 2.72) with positive green histogram bars (0.367), confirming macro bullish momentum expansion.
Key Price Levels
Immediate Target 95.00 – 98.00 Intermediate psychological resistance
Major Macro Target 105.00 – 110.00 Measure move projection / High-extension projection
Breakout Retest Support 85.00 – 86.00 Prior range resistance turned top-tier support
Key Invalidation Level 80.00 Mid-range consolidation pivot
Trading Setup & Summary
Bullish Continuation Bias: A weekly hold above EGP 86.00 keeps the major breakout intact, positioning SWDY for an upside move targeting psychological tests at 100.00 and beyond.
Retest Strategy: Dips returning toward the 85.00–86.00 breakout zone offer favorable risk-to-reward re-entry conditions, with structural risk defined below 80.00.