Short
Short
 Short
Short
 Long
Long
 Education
Is RCAT Loading Another 150% Explosive Rally?RCAT has one characteristic that immediately stands out—it respects structure remarkably well.
For a couple of years, the stock has been trading inside a well-defined ascending channel, repeatedly bouncing between support and resistance. Every major pullback has eventually found buyers near the lower trendline, setting the stage for another impulsive move higher.
Now, RCAT is back at that same decision point.
📊 The Story
Price has once again established a base at the lower boundary of the rising channel, where buyers have stepped in multiple times before. If history continues to rhyme, this could become the launchpad for another leg higher.
The previous rallies from channel support have produced gains of well over 150%, making this area worth watching closely.
As long as the channel remains intact, the broader uptrend is still alive.
🎯 Bullish Scenario
A sustained rebound from current levels could target:
🎯 $11.5– Mid-channel resistance
🎯 $15–16 – Previous swing highs
🎯 $18–19 – Upper channel resistance
⚠️ What I'm Watching
The lower trendline has done its job once again—but confirmation is still needed.
Ideally, I'd like to see:
✅ Higher highs and higher lows on lower timeframes
✅ Increasing buying volume
✅ A breakout above the channel's midline to confirm momentum has returned
Until then, patience remains the edge.
❌ Invalidation
A decisive daily close below the lower channel support (around $7) would invalidate this bullish thesis and suggest the current structure has broken down.
📖 Every Chart Tells a Story.
This one isn't predicting another 170% rally—it simply highlights that RCAT is once again sitting at the same high-probability area from which previous major advances began. Whether history repeats itself or not, price will reveal the answer soon.  Long
Long
Liquidity Sweep, Trendline Break, and Whats Next Here’s a clean way to walk your blog readers through this chart without overcomplicating it:
> **What I’m seeing on SPY**
>
> SPY spent most of the session recovering from an earlier selloff. The important part is that buyers started producing **higher lows**, which tells us selling pressure was being absorbed instead of price simply continuing straight down.
>
> At the same time, SPY was still trading underneath a larger **descending trendline** coming down from the prior high. That trendline represented an area where sellers had repeatedly been able to stop price from advancing.
>
> Late in the session, those two forces began squeezing price together: **rising support underneath and falling resistance above**. That creates a compression point. When price gets compressed like this, I’m looking for expansion—either buyers finally break resistance or sellers break the rising support.
### Why the breakout matters
On your chart, SPY began pushing **through the descending trendline** and then moved toward the **$762–$763 area**. That matters because the market is no longer just bouncing inside the downtrend. Buyers are attempting to change the short-term structure.
The sequence was basically:
**sell-side liquidity taken → buyers respond → higher lows → compression → trendline break → price expansion.**
That’s much stronger than simply saying, “SPY went up.”
The key question now is whether the breakout becomes **accepted**.
A breakout is not confirmed just because one candle crosses a line. The stronger confirmation is:
**breakout → pullback → old resistance holds as support → buyers continue higher.**
### readers
The area around **$760.5–$761** was important because that was where the descending trendline and previous resistance were sitting.
Now that price has pushed through it, that zone becomes the first place I would want buyers to defend.
Above that, the chart is moving into roughly **$762.5–$763**, which is the next meaningful resistance/liquidity area.
If buyers can hold the breakout and establish acceptance above that area, the structure becomes considerably more constructive.
But if SPY falls back underneath **$760.5–$761** and cannot reclaim it, then the breakout starts looking more like a **liquidity grab or failed breakout** rather than a true change in trend.
### One important detail on this screenshot
Your chart is also showing **post-market pricing around $763**, while the regular-session close was around **$761.69**.
That distinction matters.
After-hours moves can be useful information, but liquidity is thinner and price can move more easily. I would not treat the $763 print alone as confirmation.
The real test comes when regular trading resumes and institutional liquidity returns.
### What I would expect next
I would present it as two scenarios rather than pretending we know which one must happen.
**Bullish scenario:** SPY holds roughly **$761**, absorbs any pullback, then starts accepting above **$762–$763**. That would support the idea that buyers successfully broke the short-term downtrend.
**Bearish scenario:** SPY loses the breakout area, falls back underneath approximately **$760.5**, and fails to reclaim it. That would tell us the breakout did not attract enough sustained buying and could send price back toward the lower support/liquidity areas.
The important lesson for your readers is:
> **The trendline break gets our attention. The retest tells us whether we should trust it.**
That’s the difference between chasing a green candle and actually reading market structure.
 Long
Long
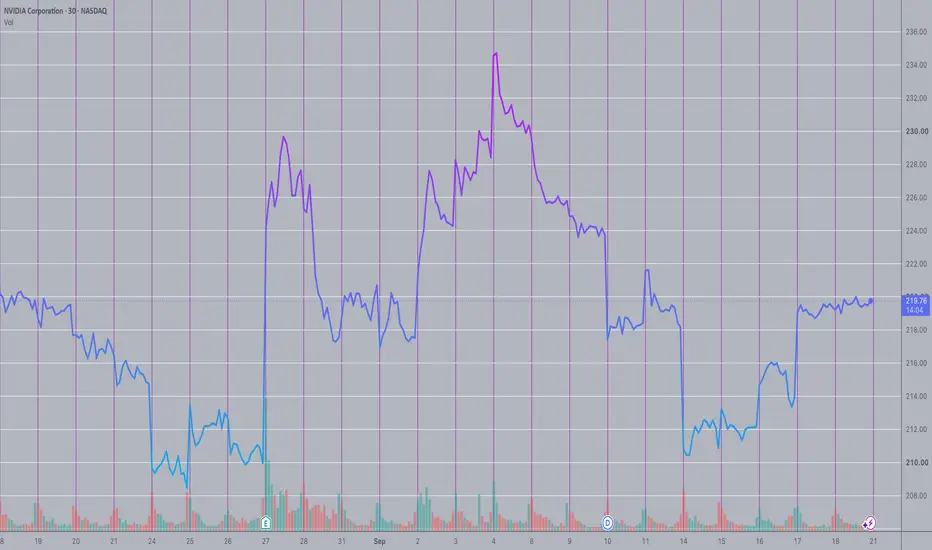
NVDA's September Drop: The 7-8% Rule in Real TimeNVIDIA printed an intraday high of $234.55 on September 4. Ten days later, on September 14, it traded down near $210 -- a peak-to-trough decline of just over 10%. It has since recovered back above $219.
I don't use this space to call tops or bottoms. I use it to talk about the mechanical rules that keep a portfolio intact when the story around a stock gets loud in either direction.
The rule here is William O'Neil's: sell if a position falls 7-8% below where you bought it. No exceptions, no waiting for the fundamentals to "catch up." Applied here, an 8% stop off the September 4 high sits around $215.80 -- a level the stock cleared on the way down well before the eventual low near $210.
The rule doesn't claim to catch the exact bottom, and it won't feel good in a case like this one, where the stock bounced back within days. That's fine. The rule isn't graded trade by trade -- it's graded over hundreds of trades, where the handful of names that don't bounce are the ones that would otherwise do real damage to an account. Capping the downside mechanically is what lets you stay in the game long enough for the winners to matter.
I apply the same logic outside of equities too -- real estate, the private fund, even the vehicle fleet at Glencore: know the number that gets you out before you're in the position, not after.
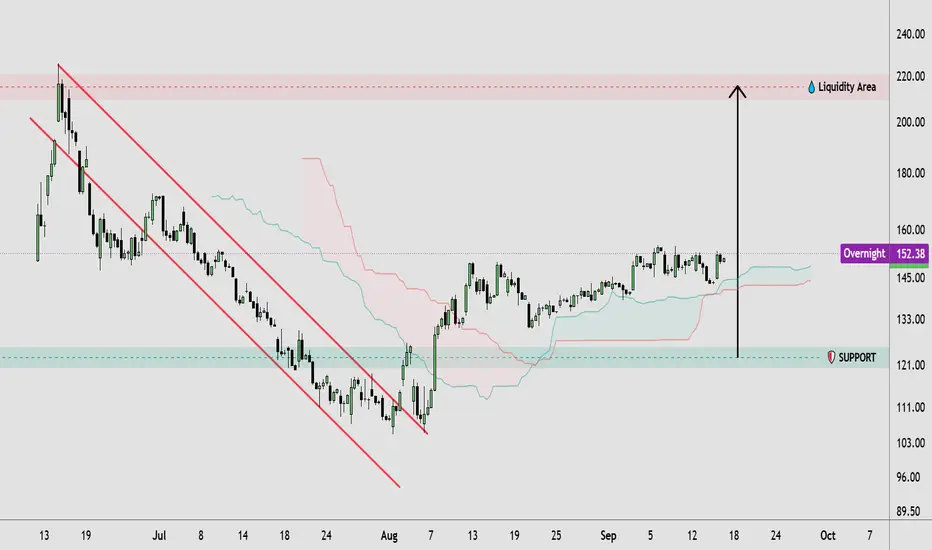
Educational breakdown of a risk-management framework, not a recommendation to buy, sell, or hold NVDA. Not investment advice. Do your own research before trading any security. SPCX: Breakout Structure & Liquidity Target🔹 SPCX price action shows a recovery from the previous descending structure, with price breaking above the falling trendline and developing a series of higher lows. The market has since entered a consolidation phase around the 145–155 area, while the 121–125 region remains a key support zone. Above the current structure, the 215–220 area is highlighted as a major liquidity region and potential resistance.
🔸 If SPCX maintains its structure above the highlighted support, price could continue developing toward higher resistance and the overhead liquidity area, particularly if a breakout above recent highs is confirmed. Traders may wait for price confirmation before considering any trade. If the key support zone fails, the bullish structure could weaken and price might revisit lower levels before establishing a new direction. This technical analysis focuses on SPCX price action, market structure, breakout, support, resistance, and liquidity.
This analysis is for educational purposes only and does not constitute financial or investment advice. Always conduct your own research before making trading decisions.  Long
Long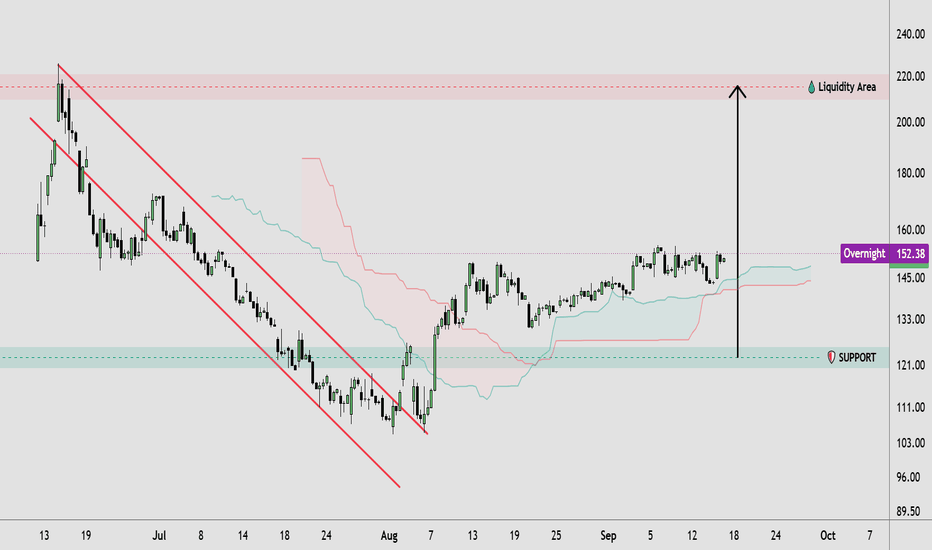
ONON | Brand Momentum Meets Major Support and Bullish Divergence
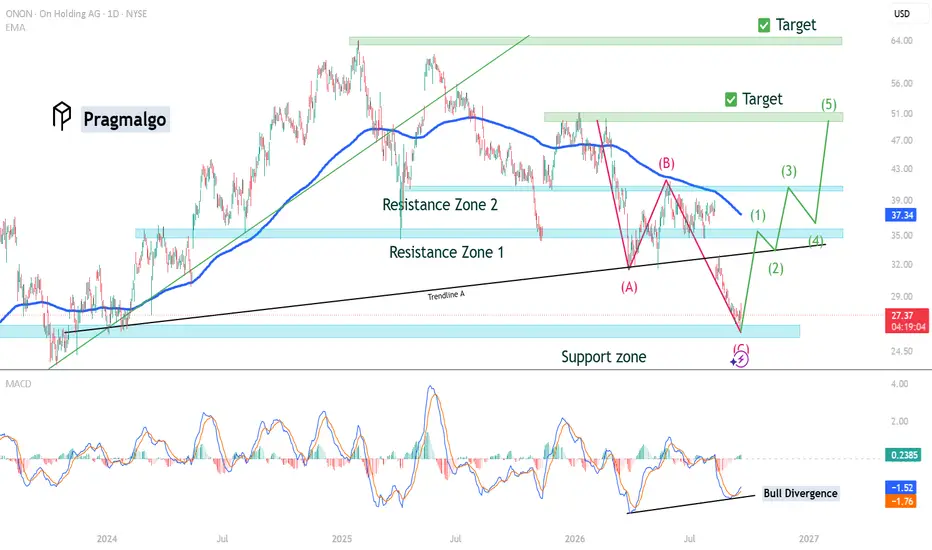
# ONON (NYSE: ONON) 1D: Brand Momentum Meets Major Support and Bullish Divergence
Kylian Mbappé officially parted ways with Nike to sign a landmark partnership as the new global face of On Holding. Locking in an athlete of this stature marks an aggressive commercial push, injecting strong brand visibility and institutional interest into the company right as valuation trades back toward baseline levels.
Price action is currently reacting off the Support Zone around $25.50 , with the daily candle printing around $27.41 . Momentum is shifting. Down on the indicator panel, the MACD is printing a distinct, sustained bullish divergence , where price formed lower lows while momentum carved higher lows. This setup provides solid short-term backing for an upward push.
Overhead conditions remain crowded. To sustain a broader recovery toward structural targets, price must cut through four clear supply hurdles: the broken Trendline A , the descending 200 EMA hovering at $37.34 , and two primary overhead blocks at Resistance Zone 1 (~ $35.00 ) and Resistance Zone 2 (~ $40.00 ).
The operating thesis focuses on building long exposure, defining risk strictly below the most recent swing low at support.
Initial expansion targets a mean reversion into the 200 EMA alongside a backtest of Trendline A , mapping out wave (1). A decisive break of this zone places price right at the doorstep of Resistance Zone 1 . Expect friction there. A corrective pullback—wave (2)—back toward Trendline A would offer a clean continuation structure. As this unfolds, the sloping 200 EMA should gradually flatten and slip beneath price action, transitioning into dynamic support where buyers can establish solid footing. From that launchpad, the next leg higher can drive straight into Resistance Zone 2 , eventually clearing path toward the primary Target at $51.00 and the extended swing objective at $64.00 .  Long
Long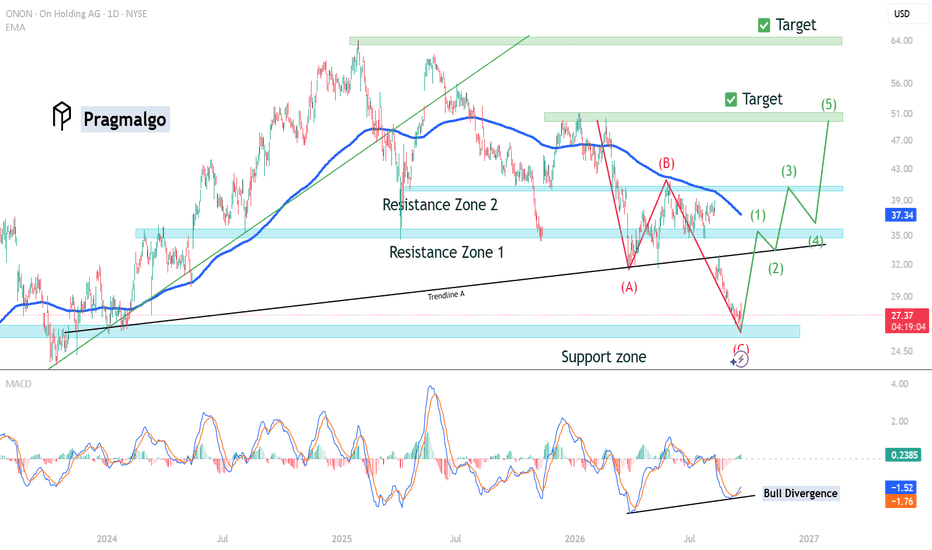
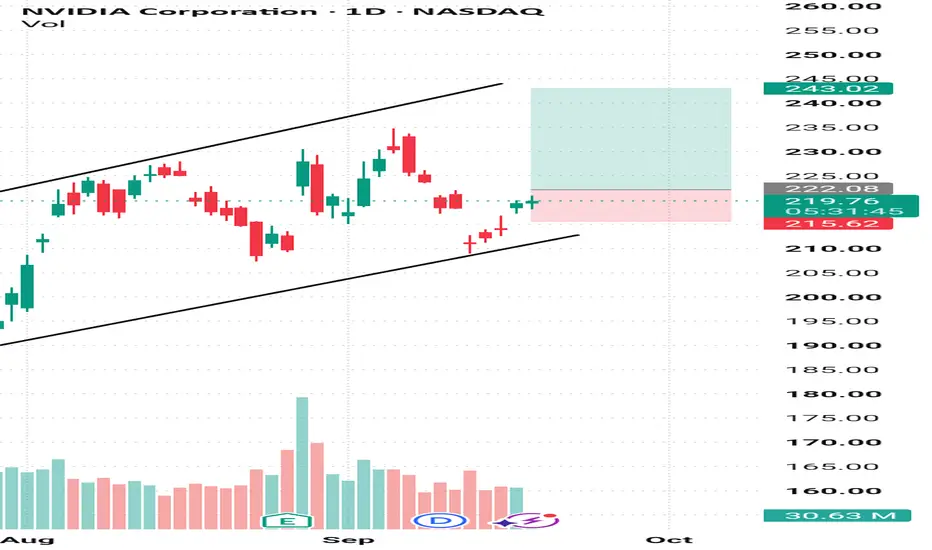
NVDA Is Back at $220 — But Can It Break the Next Wall?The FOMC reaction created a sharp pullback in NVDA, but buyers stepped back in quickly. Now price is back around $220, and this is where I think the next move starts to become interesting.
📊 My setup
On the daily chart, NVDA is trading around $220.42 inside an upward channel.
The first level I’m watching is $222.08. A clean break and hold above that level would give me more confidence that buyers are ready to push the stock higher.
If that happens, my next area of interest is around $243, which lines up with the upper part of the channel.
I’m not interested in buying just because price is moving up. I want confirmation first.
⚠️ What would change my view?
The level I’m watching on the downside is $215.62. If NVDA loses that area and starts trading below the lower part of the channel, I’d step back and reassess the setup instead of forcing a trade.
The FOMC decision also reminds me why these levels matter. The Fed raised rates by 25bps to 3.75%–4.00% on Sept. 16, and the following session saw a broad tech-led rebound.
💡 Why I’d trade this on Bitget
For an event-driven setup like NVDA, I want flexibility. Bitget gives me access to NVDAUSDT stock perps 24/7, so I’m not limited to the traditional U.S. stock market hours. Bitget also supports both long and short positions, which gives me a way to trade either direction when the setup changes.
Another thing I like is having Stocks, CFDs and Crypto on the same platform instead of moving between different exchanges when the market changes. Bitget’s stock perps are USDT-margined, so I can manage the position from the same trading environment I already use for crypto.
Liquidity matters too, especially around major U.S. market events. The campaign’s comparison highlights Bitget’s U.S. stock perp liquidity against Binance, OKX, Bybit and Hyperliquid. For me, that matters because a good setup is only useful if I can execute it properly.
🎯 My plan
Above $222.08 → watch for continuation toward $243.
Below $215.62 → bullish setup needs to be reassessed.
For now, I’m waiting for price to show me which level it wants to break rather than predicting the move.
Not financial advice  Long
Long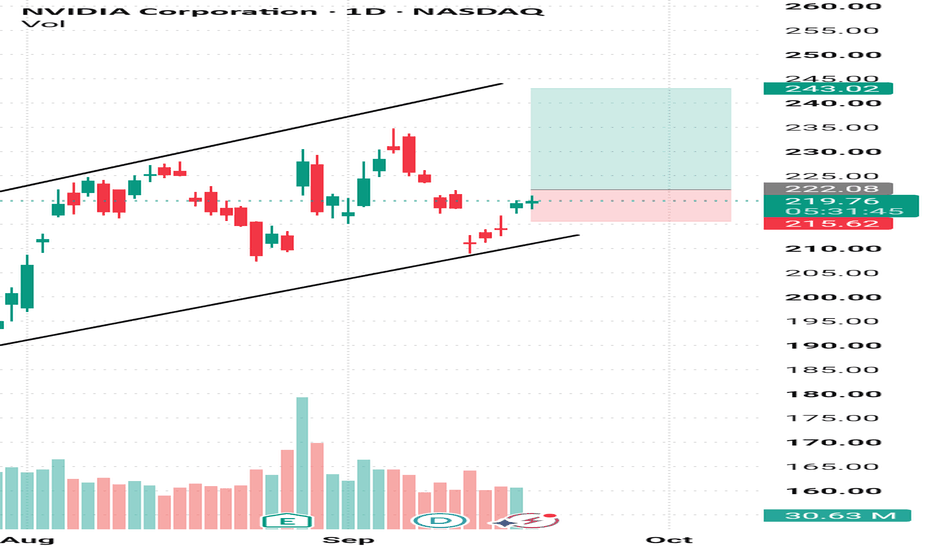
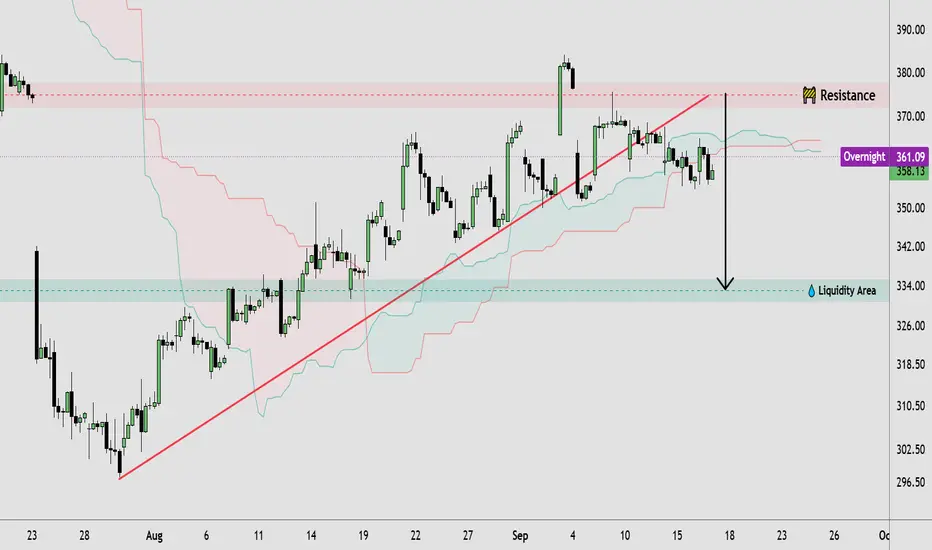
TSLA | Resistance Rejection & Liquidity Retest🔹 TSLA price action shows a broader upward market structure, with higher highs and higher lows developing from the August low. Price has recently consolidated beneath the highlighted resistance zone around 373–377, following a rejection from the 380+ area. The rising trendline continues to support the structure, while the current consolidation suggests a period of balance before the next directional move. The nearby liquidity area around 333–335 remains an important downside reference if selling pressure increases.
🔸 If TSLA breaks and holds above the resistance zone, the price structure could support further bullish continuation, particularly if the breakout is confirmed through sustained price action. Alternatively, rejection from resistance could lead to a deeper pullback toward lower support and the highlighted liquidity area. Traders may wait for clear price confirmation before considering any trade, while a decisive failure of the rising structure could shift attention toward the downside liquidity zone. This technical analysis focuses on price action, market structure, resistance, support, breakout, and liquidity.
This analysis is for educational purposes only and does not constitute financial or investment advice. Always conduct your own research before making trading decisions  Short
Short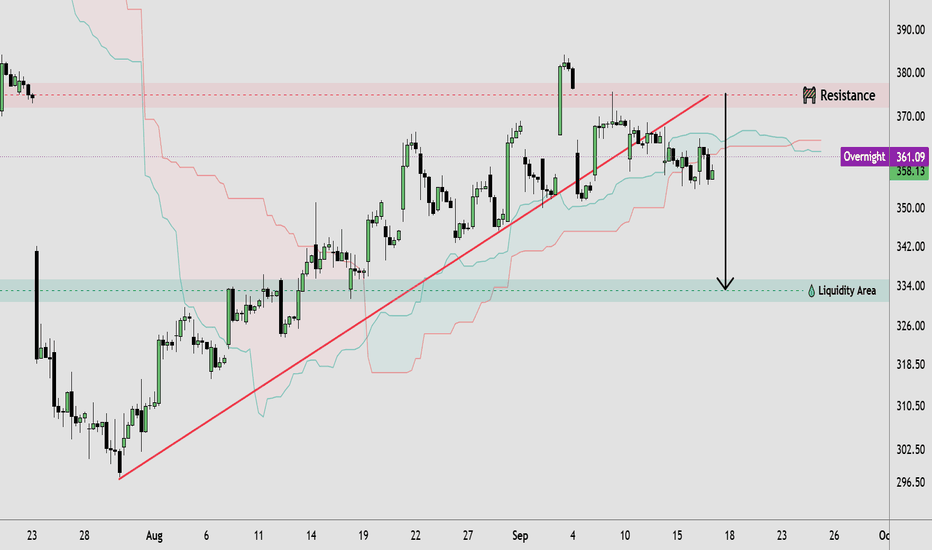
 Long
Long
 Long
Long
 Long
Long
 Long
Long
 Long
Long
Long 
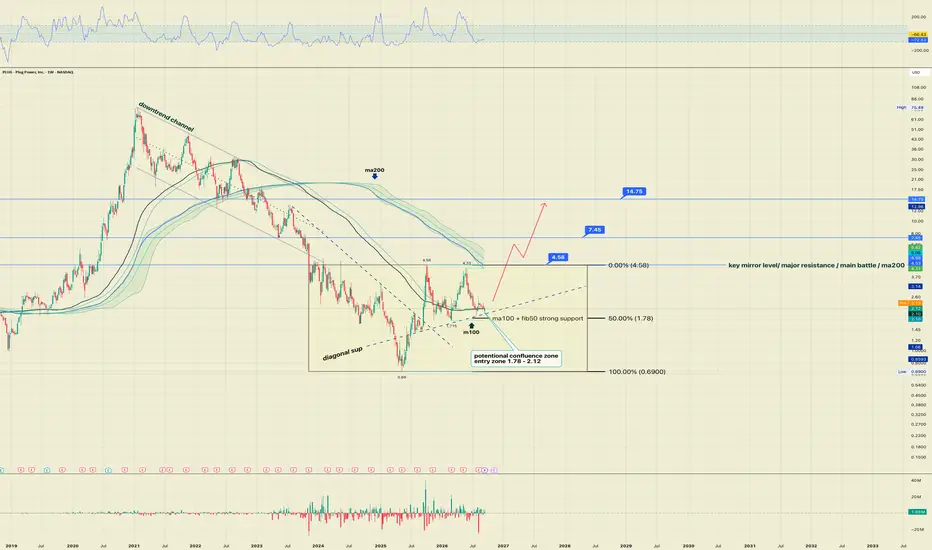
PLUG: Multi-year bottom is in. The end of the three-year dramaPLUG has been under heavy selling pressure for a long time. Following a multi-year protracted decline, a key structural shift occurred in November 2023 when the price broke below the lower boundary of the global downtrend channel. This breakdown was a major manipulation designed to shake out weak hands and capture short liquidity, triggering a final wave of capitulation where the market hammered out an absolute macro bottom at $0.69 . This flush out completely reset the old bearish cycle and launched a massive reversal base, where smart money has been systematically absorbing market supply via limit orders from late 2023 to the present day $PLUG.
This multi-year base forms a complex accumulation structure. The ascending dotted line (diagonal sup) has proven its absolute validity, acting as the primary dynamic axis holding the entire chart geometry together. Currently, the price is compressed within a local confluence zone of $1.78–$2.12. This is the most critical battleground for buyers to defend their positions, as it marks the intersection of the 50.00% Fibonacci retracement level ($1.78), the heavy 100-week moving average (ma100), and the dynamic support line. The $1.78–$2.12 area is the primary zone where the market must show a strong bullish reaction if the long-term base scenario is to remain valid. Crucially, this is not a guaranteed bottom. If the price closes the week below $1.55, the base structure will be compromised, the limit barrier broken, and the bullish thesis completely invalidated. A major headwind to keep in mind is the fundamental context — the company's high cash burn rate, which keeps Wall Street consensus conservative with intermediate targets set around $3.50–$5.00.
Overhead lies the absolute ultimate technical barrier of the macro structure — the key mirror resistance level at $4.58, which aligns with the heavy 200-week moving average (MA200). This is the "main battle" and the upper boundary of the multi-year base. As long as the price remains below it, the stock continues to trade within the global accumulation phase. A clean breakout and confirmation above $4.58 will fundamentally shift the technical landscape on a macro scale. Piercing through this heavy supply wall will trigger a massive short squeeze, confirm an official exit from the accumulation base, and unleash three years of coiled energy, clearing the path toward structural targets at $7.45 and a long-term macro target of $14.75.
This publication is for analytical purposes only and does not constitute individual investment advice. Technical levels are scenarios, not guarantees of price movement.  Long
Long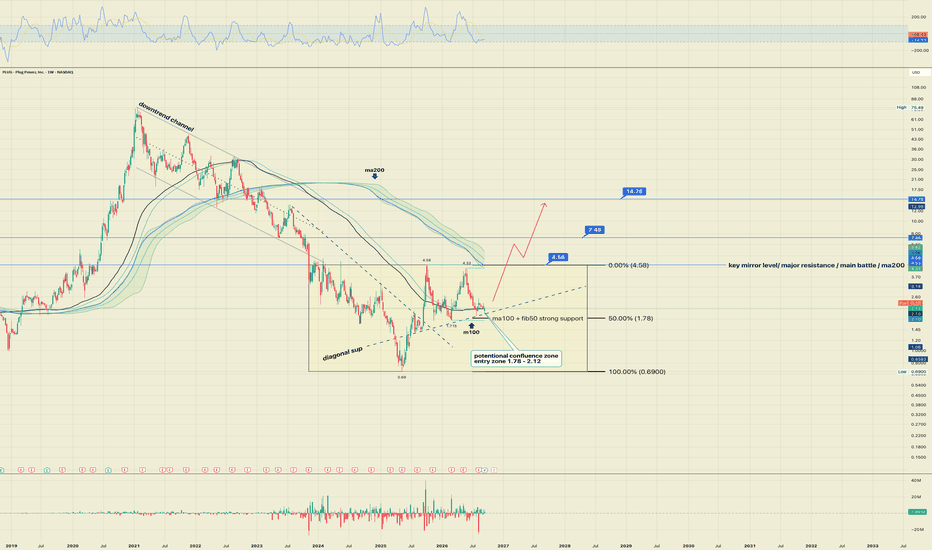
Is history about to repeat on SMCI? - Community IdeaOne of the best parts of this project has been the collaboration. A valuable member of the trading community recently gave me some feedback and pointed out a beautiful fractal developing on the daily chart, and it immediately stood out to me once I saw it. This is exactly the kind of collaboration I was hoping for when I started this journey. We are still early. The goal has never been for me to have all the answers. The goal is for us to work together, sharpen each other’s thinking, and continue building better tools and better trading ideas.
On the chart, what stands out is the similarity between the current daily structure and a prior bull flag continuation. In both cases, SMCI made an impulsive move higher, paused and consolidated in a tight range, then positioned itself for a potential continuation leg. I illustrated that earlier pattern on the chart because the current setup looks very similar. That does not mean price has to repeat history candle for candle, but it does mean there is a recognizable structure here worth respecting.
The larger backdrop matters too. SMCI is still trading beneath a well-respected descending trend line that has been in place for roughly 18 months. That trend line is not just another line on the chart. It is the critical area. If buyers can keep this daily bull flag intact and begin pushing into that zone with strength, the setup becomes much more interesting. A clean break could open the door to a larger continuation move, and the rough bull flag projection on my chart points toward the upper-50s if momentum really gets going.
That said, I am not pretending this is a low-risk setup. It is not. This is a smaller-sized, higher-risk swing for me, which is why I entered Oct 16 40C at 2.41 with only 5 contracts. I have talked about this before, but when I take these multiday options ideas I deliberately size down because the uncertainty is higher and the time component matters more. If this works, I will most likely look to exit into a critical level, ideally with a couple of weeks still left before expiration rather than trying to hold and squeeze every last dollar out of the contract.
For now, the bull flag is the main idea. If the structure continues to hold and price starts making progress toward that major trend line, I think this setup has a legitimate chance. If the flag fails, then the thesis weakens quickly and I will treat it that way. Either way, this is a great example of why collaboration matters. Sometimes another trader helps you see something that was sitting right in front of you the whole time.
This is just the start. We will keep working together, keep sharing ideas, and keep trying to build better tools and better trades.  Long
Long
Long