Tata Motors — Sellers Targeting 250 as Downtrend Extends📉 Tata Motors — Sellers Maintaining Control
Tata Motors is currently displaying a clear bearish structure, with price already moving lower and the selling pressure showing signs of further continuation. The recent price action indicates that sellers remain firmly in control, while bullish attempts are struggling to produce a meaningful recovery.
The ongoing decline suggests that the market may continue its downward trajectory, with 250 standing out as the next major projected downside objective. As long as the bearish structure remains intact, further weakness can remain on the table.
The projected path is straightforward:
Current price action → continued selling pressure → deeper downside movement → 250 target zone.
From a technical perspective, the market is respecting the bearish sequence, with lower price levels becoming increasingly vulnerable as selling momentum develops. Rather than treating the current decline as an isolated move, the broader structure points toward a continuation of weakness.
The 250 area is therefore the key downside destination in this setup. A sustained bearish structure would keep the selling bias active as price works toward that level.
The broader fundamental backdrop can also influence Tata Motors through automobile-sector demand, company-specific developments, input costs, interest-rate expectations, and overall Indian equity-market sentiment. These factors may affect the speed and volatility of the move, while the technical structure remains the primary roadmap.
📍 Market Bias: Bearish
📉 Current Direction: Selling
🎯 Projected Target: 250
⚡ Structure: Bearish continuation
The market is already moving in the projected direction — and the chart suggests there may be considerably more downside before the sellers complete this move.  Short
Short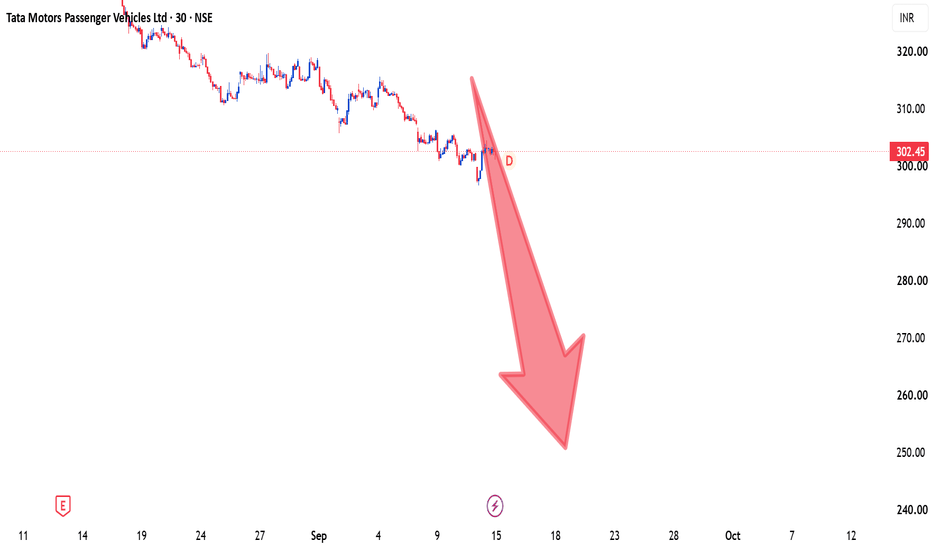
Reliance Industries — Pullback First, Then Upside ContinuationReliance is currently showing a setup where price may first experience a corrective move toward the 1237 area before the broader bullish structure resumes.
From a technical perspective, the current price action suggests that the market may need to retrace lower and revisit the 1237 region before establishing the next meaningful upward leg. This downside move can be viewed as a corrective phase within the larger structure rather than an immediate indication of a sustained bearish trend.
The 1237 level remains the key area to monitor. If price reaches this zone and the broader structure remains intact, the setup could transition back toward the buying side, opening the path for a recovery toward the 1330 target area.
The projected roadmap is therefore straightforward:
Current structure → downside move toward 1237 → bullish transition → upside expansion toward 1330.
The important factor here is not simply the direction of the next candle, but the overall sequence of the move. A temporary decline toward the lower level can create the foundation for the next bullish phase, with 1330 remaining the major upside objective.
From a broader market perspective, Reliance can also remain sensitive to developments across the Indian equity market, sector sentiment, crude-oil dynamics, currency movements, and expectations surrounding corporate earnings and growth. These factors can influence the pace of the projected move, while the technical structure provides the primary roadmap for this setup.
The analysis is built around a defined price path rather than chasing short-term fluctuations. 1237 remains the key downside level, while 1330 represents the projected bullish destination.
📍 Key Downside Level: 1237
🎯 Projected Upside Target: 1330
📊 Bias: Bearish correction → Bullish continuation
📈 Preferred Direction: Buy-side expansion after the projected pullback
A structured setup, clearly defined levels, and a roadmap that keeps the focus on price rather than noise.  Long
Long
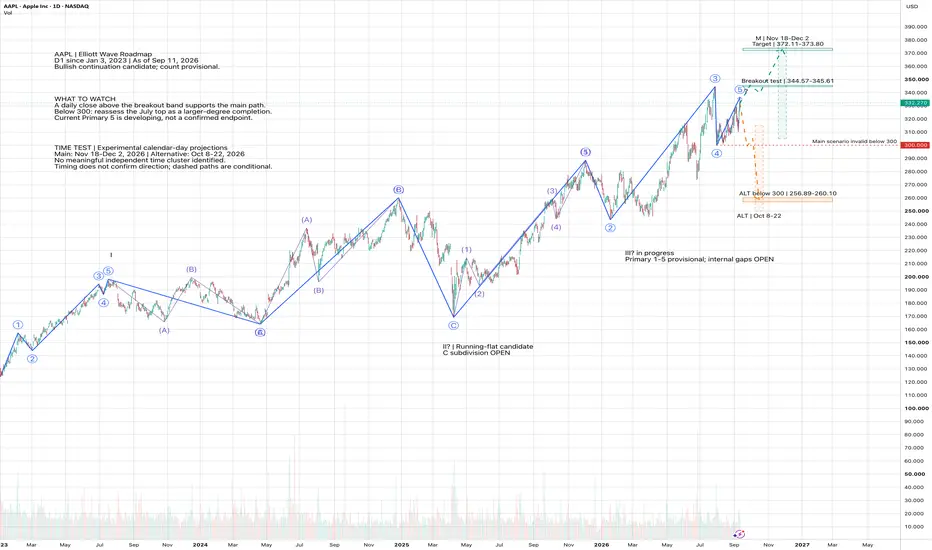
AAPL: A New High Within Reach?Apple is approaching an interesting moment. The recovery from the summer pullback has brought buyers back within sight of July’s high. The question now is whether they have enough strength to push through—or whether this rebound is setting up another disappointment.
The next test sits at $344.57–$345.61. Until Apple clears that band, the bullish story still has something to prove.
Looking back to January 2023, the chart tells a story of strong advances interrupted by difficult corrections. The first rally can be divided into five waves. What followed was much less straightforward: a long, overlapping stretch that produced a new high before another sharp decline into April 2025.
That messy middle matters. It leaves the larger Elliott interpretation open, even though the advance from April to December 2025 offers a clearer five-wave structure. The chart connects these smaller swings to the broader picture across three wave degrees. It does not turn every uncertain turn into a confirmed label.
The working view is that Apple may still have another upward leg ahead. But the latest recovery contains overlaps, so its final shape remains unresolved. This is a roadmap with conditions—not a claim that the next move has already been decided.
For buyers, a daily close above the breakout band would be an encouraging first step. Holding that area on a subsequent pullback would make the continuation case more convincing. If that happens, $372.11–$373.80 becomes the next projected area of interest. That zone brings together two Fibonacci measurements of earlier swings; it is a destination to watch, not a promised outcome.
The other side of the story starts at $300. Losing that summer low would undermine the immediate bullish setup and put a larger correction back in focus. The first downside reference would be around $277.58, followed by the marked $256.89–$260.10 zone. A local setback would require reassessing the count; it would not automatically erase the entire advance since 2023. Nor is $300 automatically an appropriate stop for every trade.
There is also a timing layer, although it offers less agreement than the price levels. Comparisons with earlier wave durations point to November 18–December 2, 2026 for the continuation scenario and October 8–22, 2026 for the correction alternative. These are experimental calendar-day windows. No convincing independent time cluster emerged, so neither window should be treated as a deadline or an entry signal.
For now, the most useful question is simple: can Apple turn resistance into support? The answer at the breakout band will tell us more than adding another wave label ever could.
Daily chart through September 11, 2026. Prices in USD, without dividend adjustment. Educational scenario analysis; the count remains provisional.  Short
Short
 Long
Long
 Long
Long
 Long
Long
 Long
Long
 Long
Long
 Short
Short
META Tests Weekly Ichimoku Cloud at a Key Kumo TwistMETA is attempting to reverse its corrective weekly structure after a strong +5.07% candle, closing at $648.03.
Price has moved above the descending trendline, currently around $637.60 , but the bullish breakout is not fully confirmed because META remains inside the bearish Ichimoku cloud.
The circled Kumo twist is an important area to monitor. It shows that the cloud is losing thickness and that the previous bearish structure is weakening. However, a twist does not predict direction by itself—it represents a potential transition zone where price may cross the cloud more easily.
The current Ichimoku levels are:
- Tenkan-sen: $605.29
- Kijun-sen: $605.89
- Senkou Span A: $605.59
- Senkou Span B: $655.53
Bullish Scenario
A weekly close above $655.50 , followed by a breakout above the recent high at $664.24 , would confirm:
- A breakout from the Ichimoku cloud
- A validated break of the descending trendline
- A potential bullish regime change around the Kumo twist
The next upside targets would be $680–$700, followed by $720–$740.
Bearish Scenario
A move back below $637–$638 would weaken the trendline breakout.
Below $620, META would risk moving deeper into the cloud. The major support and invalidation zone is located around $605–$606, where the Tenkan-sen, Kijun-sen and Senkou Span A converge.
A weekly close below this area would invalidate the bullish reversal scenario and expose $580, followed by $550.
Conclusion
The Kumo twist is constructive, but META is still in a neutral transition phase. The decisive bullish signal would be a confirmed weekly close above the $655.50–$664.25 resistance zone.
Until then, this remains a promising breakout attempt rather than a fully confirmed trend reversal.
This analysis is for informational and educational purposes only and does not constitute financial advice.
Laurent - Private Investor
✅ DL INVEST | Community Leader
SMCI: The server king returns. Cisco opens a second doorSuper Micro Computer NASDAQ:SMCI again looks far more interesting from a fundamental standpoint than the chart alone might suggest. After a prolonged downtrend, the stock is attempting to form a reversal structure, and price is now around $40.10. The main support zone sits in the $29 to $33 range. That remains the key area buyers must defend. Above, the first serious resistance zone is around $54.73 to $58.05. A breakout there could open the door to $68.05 and then $80.73. The all-time high is much higher, near $122.90, so the long-term potential remains significant if Supermicro truly transitions from recovery into a new sustainable uptrend.
And this is where the technical picture starts to be reinforced by fundamentals that look much stronger than the chart alone would imply. The company closed FY2026 with revenue of $39.1 billion versus $22.0 billion a year earlier. Net income came in at $2.2 billion, with EPS of $3.26 versus $1.68 a year earlier. The fourth quarter was especially strong: revenue reached $11.1 billion, net income $1.18 billion, and gross margin recovered to 17.5% from 9.9% in the prior quarter. That margin recovery is precisely the trigger the technical picture has begun to price in.
But the main fundamental catalyst is not even in the already published results. In Q4, Supermicro received more than $60 billion in new orders, after which the company reported a record backlog entering FY2027. Important: this is the volume of new orders to be shipped in future quarters, not guaranteed revenue for the next quarter. Management expects $65 to $72 billion in revenue for FY2027, which shows the scale of expectations from AI infrastructure. That order flow is what creates the fundamental backdrop allowing the current $29 to $33 support zone to be viewed as accumulation rather than a continuation of the decline.
And here comes Cisco. In August, Cisco announced the expansion of its Secure AI Factory with NVIDIA through a partnership with Supermicro. Cisco's ecosystem is adding Supermicro's high-density liquid and air-cooled systems, including rack-scale solutions for NVIDIA Vera Rubin NVL72 and HGX Rubin NVL8 . Cisco plans to begin offering Supermicro compute solutions as part of this platform starting in October 2026. This gives Supermicro an additional channel to large enterprise and cloud customers, and that could be the driver that helps price break through the $54.73 to $58.05 resistance zone.
At the same time, a key question about the quality of growth remains. At the end of FY2026, Supermicro had $7.5 billion in cash but also $8.7 billion in bank debt and convertible bonds. So calling the company free of financial risk would be wrong. The main task now is to ensure the huge flow of AI orders converts not only into revenue but also into sustainable margin and cash flow. Margin, cash flow, and the ability to scale production become the next key checkpoints, and they will determine whether the technical reversal is confirmed fundamentally.
Historical issues with auditing and corporate control should also not be presented as a current crisis. In 2024, EY left the company, after which Supermicro appointed BDO and conducted an independent review. The special committee found no grounds for a restatement of financial statements. Later, the company also conducted a separate review related to former employees and alleged export control violations. The review found no evidence that current management knew of the alleged scheme or that the company's financial statements were unreliable because of it. That backdrop removed part of the reputational pressure that weighed on the stock in 2024 and 2025, allowing the technical picture to begin forming a reversal structure.
MACD is also gradually changing character: the histogram and indicator lines show improving momentum after prolonged seller pressure. But while price remains below key resistance, it is premature to speak of a fully confirmed long-term reversal.
The main conflict for SMCI right now is simple: demand for AI infrastructure is huge, $60+ billion in new orders have already been received, Cisco is adding Supermicro to its AI infrastructure ecosystem, but the market wants to see how profitably the company can execute that volume.
If price can establish itself above resistance, the fundamental story gets additional confirmation from the chart. If the $29 to $33 support is lost, the entire current reversal structure will come under serious pressure.
This publication is for analytical purposes only and does not constitute individual investment advice. Technical levels are scenarios, not guarantees of price movement.  Long
Long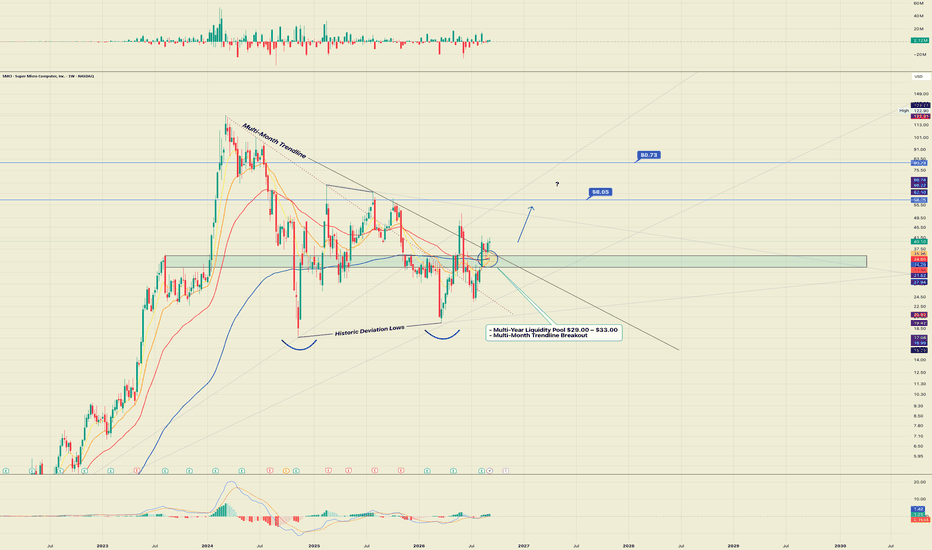
 Long
Long
 Long
Long
 Short
Short
 Long
Long
WEBULL: The Most Underrated Growth Engine in the Cycle.🚀💡 Executive Summary
Webull ( NASDAQ:BULL ) is quietly completing a major structural bottoming pattern while operating as one of the fastest-growing fintech platforms in global retail markets. Currently sitting at ~$9.22, the stock is heavily discounted relative to its expanding top-line revenue, accelerating profitability, and institutional accumulation. With major regulatory catalysts (PDT rule removal), global M&A expansion, and a structural chart fractal mirroring Robinhood’s ( NASDAQ:HOOD ) multi-hundred-day accumulation base, consistent accumulation (dollar-cost averaging through the base) represents the highest-conviction strategy to play NASDAQ:BULL for asymmetric risk-to-reward targeting $100+ over a 2–5 year horizon.
📈 Technical Breakdown: The Technical & Structural Fractal Horizon
* 🧱 Macro Bottom Absorption: Price action found a major structural floor around the $4.50–$5.00 zone, printing a clear high-timeframe SHM Buy Signal during the spring recovery.
* 📐 The 500+ Day Base Fractal ( NASDAQ:HOOD Comparison): NASDAQ:BULL 's current price structure closely mirrors Robinhood’s ( NASDAQ:HOOD ) initial post-listing markdown and subsequent ~530-day base channel ($7–$12). NASDAQ:HOOD spent over 18 months consolidating as smart money absorbed supply before triggering its multi-wave expansion toward $100B+. NASDAQ:BULL is currently inside this exact coiling window, building higher lows pressing against resistance near $9.50–$10.00.
* ⚡ Momentum Matrix Confluence: The SHM v8.0, CIMA MA, SHM RSI, and DWO indicators are aligning across trend, speed, and order flow to confirm institutional sell-side exhaustion:
* SHM v8.0 & CIMA MA (Trend Alignment): Price holds above the 63 WMA and 510 WMA baseline, with the CIMA MA (Cumulative Institutional Moving Average) stacking as dynamic support beneath price, confirming structural macro trend realignment.
* SHM RSI (Momentum Gate): The locked 24h RSI velocity gate (rsi_len = 6) is building steady momentum in the active band without hitting overbought exhaustion.
* DWO (Order Flow Absorption): Displays continuous bullish divergence and delta volume absorption, showing real buyers absorbing sell orders at the base.
* 🎯 Overhead Targets: A clean breakout past $10.00 opens the run toward the 52-week high of $16.04, with zero structural resistance above once macro blue-sky discovery begins.
💚 Fundamental & Institutional Growth Triggers (The Good)
* 📊 Q2 Earnings & Profitability Shift: Webull reported a 51% YoY revenue jump to $198.8M (beating estimates of $187.2M). Diluted GAAP EPS swung to a positive $0.04, while Adjusted Operating Profit per share reached $0.12 (surpassing $0.01 consensus) on $62.6M in adjusted operating profit (+168% YoY).
* 🔓 Regulatory Tailwinds (PDT Rule Elimination): The official SEC/FINRA elimination of the Pattern Day Trader (PDT) $25,000 minimum equity requirement on June 4, 2026, served as a primary growth catalyst. Management cited this as a "defining event" that drove record Daily Average Revenue Trades (DARTs) of 1.6M and lifted options contract volume 68% YoY to 213M contracts.
* 🌏 Aggressive Global M&A & Geographic Reach: Webull completed its acquisition of Thailand's Pi Securities (~99.36% stake), targeting THB 200B in combined AUM. Alongside recent active trading launches in Spain, Argentina, and Colombia, Webull’s operational footprint has expanded to 18 active markets and 35 licensed jurisdictions.
* 🤖 Tech Engagement (Vega AI Adoption): Active users on Webull’s native Vega AI platform reached 480,000 (adding 160,000 users in Q2 alone), deepening user retention and product engagement across retail trading tools.
* 🏛️ Institutional Accumulation: Smart money is aggressively building positions, highlighted by BlackRock adding 6.77M shares (+42.8%) and Citigroup increasing holdings by over 23,000% in Q2 filings.
⚠️ Headwinds, Risks & Counter-Headlines (The Bad & Market Rumors)
* 📜 Pre-Arranged Insider Realizations: Recent SEC Form 4 and Rule 144 filings indicate executive share sales, including pre-scheduled Rule 10b5-1 plan sales by President Anthony Denier. While executed under routine pre-arranged plans adopted earlier in May, insider supply remains a near-term absorbable friction at base resistance.
* 🔍 Payment for Order Flow (PFOF) Scrutiny: Regulatory proposals surrounding PFOF execution models remain an ongoing risk, as potential SEC mandates could compress transaction-based rebate margins.
* ⚔️ Intense Retail Competition: Webull faces aggressive counter-expansion from Robinhood ( NASDAQ:HOOD ), Interactive Brokers, and legacy giants (Fidelity, Schwab) who continue to slash trading costs and roll out competing round-the-clock features.
* 📉 Retail Trading Cyclicality: Platform top-line performance remains tied to retail volume liquidity cycles. Extended market chop or elevated interest rates could cool retail trading activity.
💎 The Valuation Path & Fractal Timeline ($100+)
* 🏷️ Current Market Cap: ~$4.88B – $5.0B at ~$9.22 per share.
* 🎯 Target Market Cap at $100/share: ~$52B – $53B (assuming current ~526M share count).
* ⏳ 3-Phase Fractal Lifecycle & Accumulation Plan:
1. Phase 1: Base Accumulation (~500–550 Days): Currently coiling beneath $10.00 base resistance. Because micro-timing exact breakout candles inside a 1.5-year channel is inefficient, consistent, systematic accumulation across the $7.50–$9.20 zone allows position-building at deep value before momentum spikes.
2. Phase 2: Breakout & Multiple Expansion (12–24 Mos): Re-rating toward $15B–$20B valuation ($28–$40/share) upon breaking $10.00 and clearing the $16.04 high.
3. Phase 3: Macro Cycle Peak (2–5 Yrs): Multiple expansion toward $50B+ as global AUM monetization (Pi Securities) and PDT volume velocity mature, aligning NASDAQ:BULL with NASDAQ:HOOD 's macro trajectory.
🏁 Final Setup & Directional Targets
Webull ( NASDAQ:BULL ) sits at the confluence of fundamental revenue expansion (51\% YoY growth), PDT regulatory tailwinds, international M&A, and a high-probability chart fractal mirroring NASDAQ:HOOD ’s historic ~530-day bottoming structure. Rather than chasing parabolic breakout candles, steady, continuous accumulation throughout the base structural support zone is the optimal way to play $BULL.
Directional Targets:
* ⏳ Near-Term (1–3 Months): Coiling under $9.50–$10.00 base resistance. A decisive daily close above $10.00 triggers upside expansion targeting the $16.04 52-week high sweep.
* 🚀 Macro Horizon (2–5 Years): Following the ~500-day base breakout phase, international expansion and trading velocity pave the path toward a $50B+ market cap, carrying price into the $100.00+ macro target zone.
📋 Strategic Setup
Parameter Execution Zone
Current Price 💵 ~$9.22
Playbook / Strategy 🧠 Systematic Accumulation (DCA) across the multi-month base
Accumulation Zone 🛒 $7.50 – $9.20 (Layering buys into SHM Baseline & CIMA MA support)
Mid-Term Target 1 🎯 $16.04 (52-Week High Sweep)
Macro Target (2-5 Yrs) 🌕 $100.00+ (Triple-Digit Expansion / $50B Market Cap)
⚠️ Disclaimer: For educational purposes only and does not constitute financial advice. Trading equities involves significant capital risk, and past performance does not guarantee future results. Always conduct independent research before making investment decisions.  Long
Long